49 / anno
Compatibile con

Favoriti:5   Visualizzazioni:488   Recensioni:0  

Find lastest weekly and default timeframe support/resistance areas on a same graph.

Report Abuse

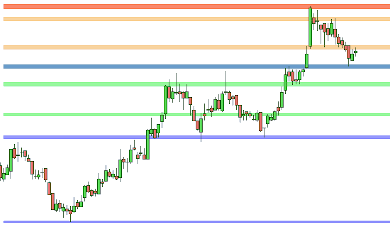
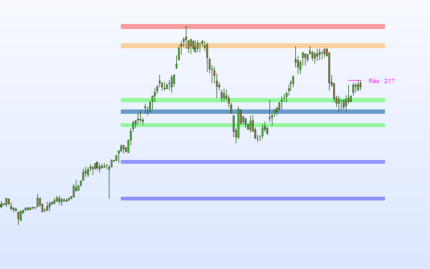
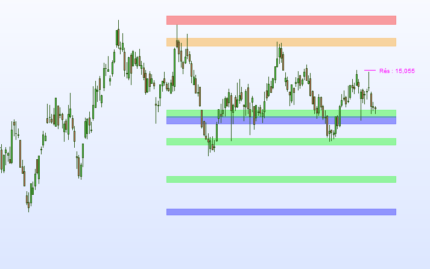
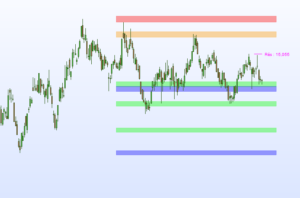
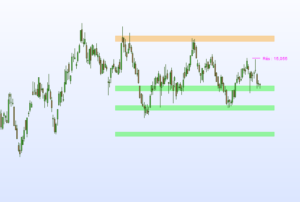
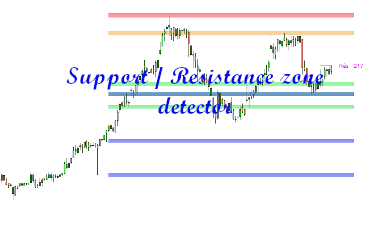
This indicator draws on the graph weekly and default timeframe support/resistance areas.
So, you can have on a daily chart weekly and daily support/resistance.

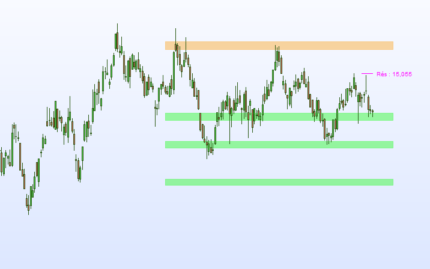
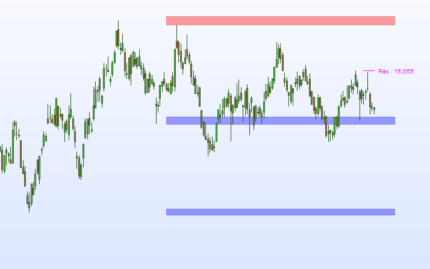
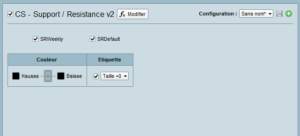
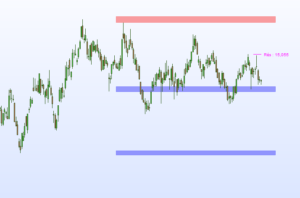
You can configure the indicator to see only weekly support/resistance or only default timeframe support/resistance.

  • weekly support/resistance areas are drawn in blue and red.

  • default timeframe support/resistance areas are drawn in green and orange.

Advantages :

  • easy to use.
  • it’s not working with ProRealtime v10.3
 

Recensioni

Ancora non ci sono recensioni.

Solamente clienti che hanno effettuato l'accesso ed hanno acquistato questo prodotto possono lasciare una recensione.

Richiesta Prodotto

Your personal data will be used to support your experience throughout this website, to manage access to your account, and for other purposes described in our privacy policy

Altri articoli da CoolScreeners

Product Image
49

1

Product Image

Swapping level

Quickly detect the underlying trend of an asset and get an entry point

69

2

Pronto a unirti al nostro Marketplace!
Più 1,000,000 i potenziali clienti hanno bisogno di prodotti commerciali di qualità pro
Unisciti a noi oggi