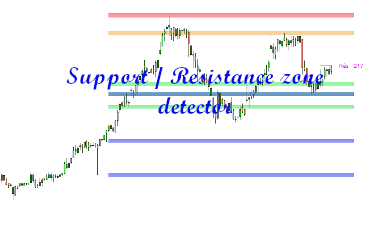
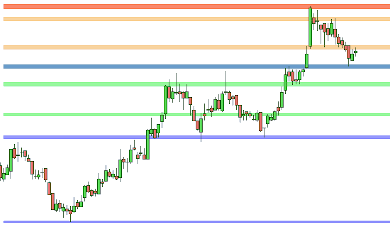
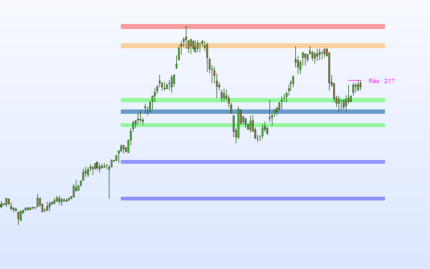
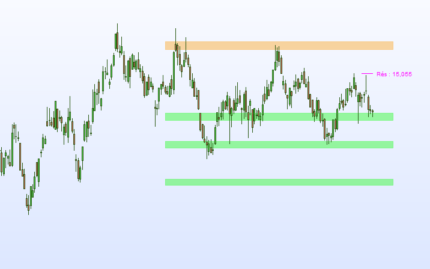
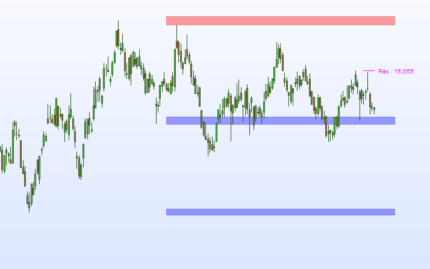
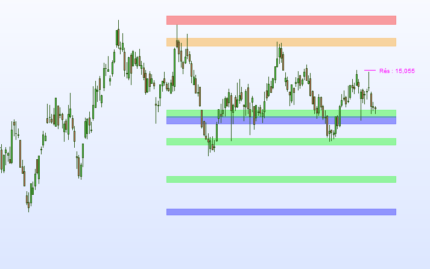
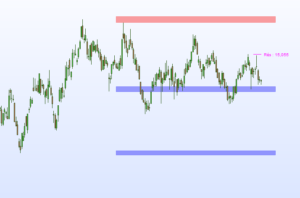
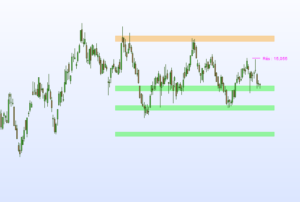
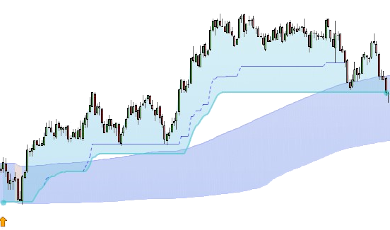
This indicator draws on the graph weekly and default timeframe support/resistance areas.
So, you can have on a daily chart weekly and daily support/resistance.
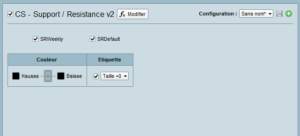
You can configure the indicator to see only weekly support/resistance or only default timeframe support/resistance.
- weekly support/resistance areas are drawn in blue and red.
- default timeframe support/resistance areas are drawn in green and orange.
Advantages :
- easy to use.
- it’s not working with ProRealtime v10.3





Avis
Il n’y a pas encore d’avis.