49 / Jahr
Kompatibel ab

Favoriten:5   Ansichten:466   Bewertungen:0  

Find lastest weekly and default timeframe support/resistance areas on a same graph.

Report Abuse

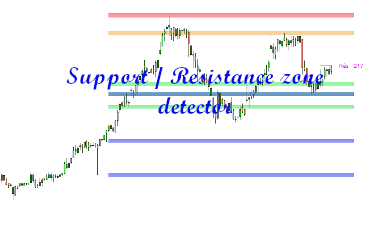
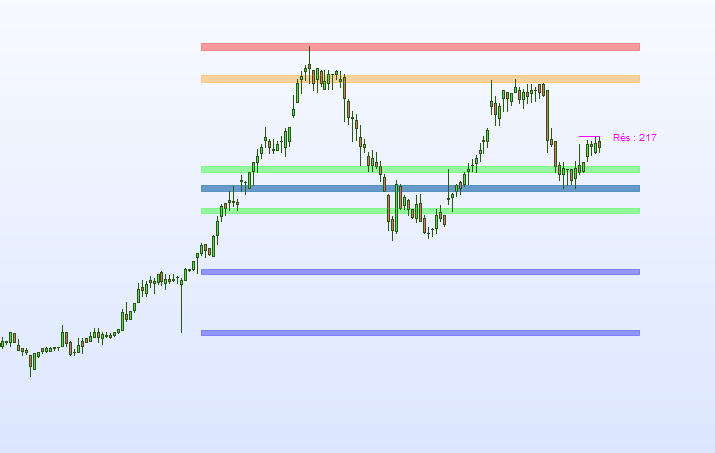
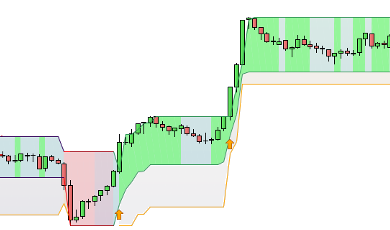
This indicator draws on the graph weekly and default timeframe support/resistance areas.
So, you can have on a daily chart weekly and daily support/resistance.

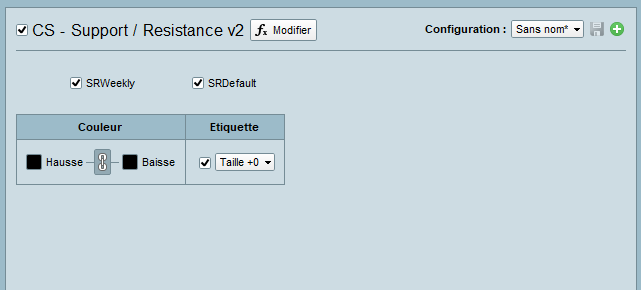
You can configure the indicator to see only weekly support/resistance or only default timeframe support/resistance.

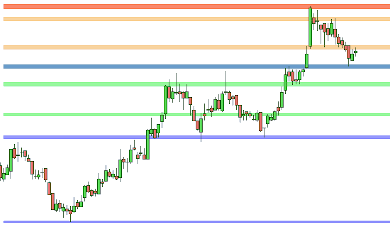
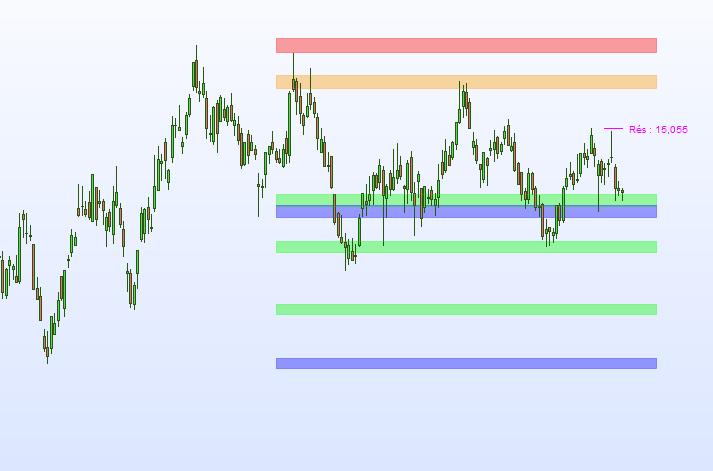
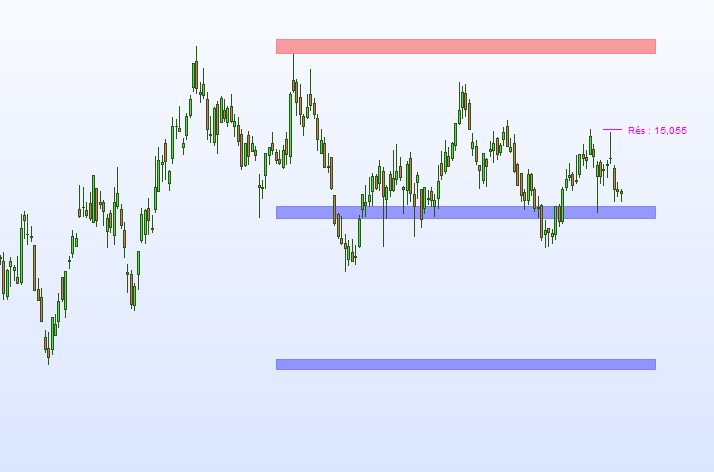
  • weekly support/resistance areas are drawn in blue and red.

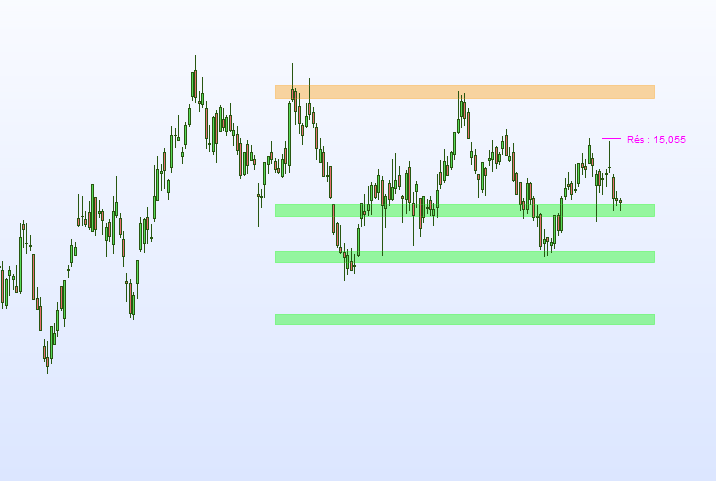
  • default timeframe support/resistance areas are drawn in green and orange.

Advantages :

  • easy to use.
  • it’s not working with ProRealtime v10.3


Bewertungen

Es gibt noch keine Bewertungen.

Nur angemeldete Kunden, die dieses Produkt gekauft haben, dürfen eine Bewertung abgeben.

Product Enquiry

Your personal data will be used to support your experience throughout this website, to manage access to your account, and for other purposes described in our privacy policy

Mehr Artikel von CoolScreeners

Product Image

Trendfollowing Toolkit

A bundle of 5 Indicators and screeners for a better approach of trendfollowing

129

1

Product Image

Scalping Toolkit

4 indicators for a better approach to scalping

129

3

Bereit für unseren Handelsmarktplatz!
Über 1,000,000 Potenzielle Kunden haben Bedarf an qualitativ hochwertigen Handelsprodukten
Heute mitmachen