49 / año
Compatible desde

Favoritos:5   Vistas:535   Reseñas:0  

Find lastest weekly and default timeframe support/resistance areas on a same graph.

Report Abuse

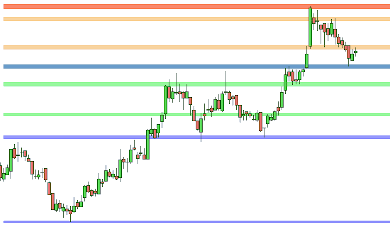
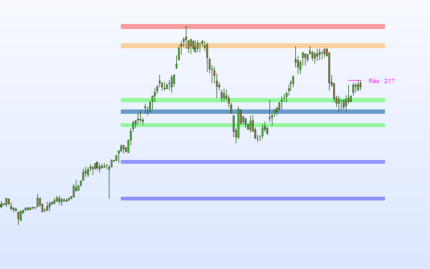
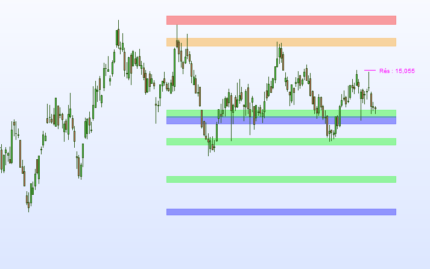
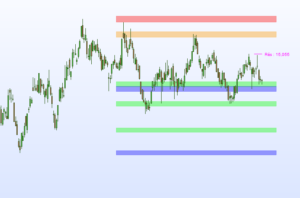
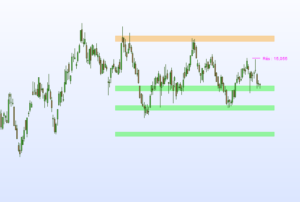
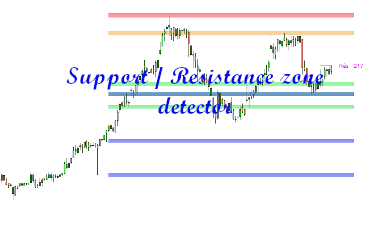
This indicator draws on the graph weekly and default timeframe support/resistance areas.
So, you can have on a daily chart weekly and daily support/resistance.

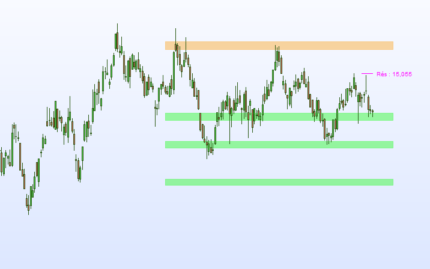
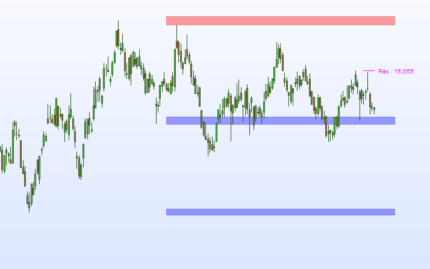
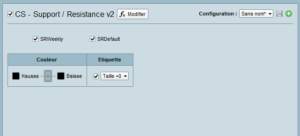
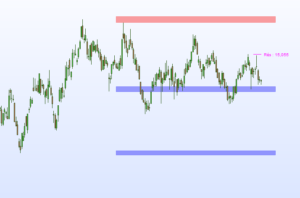
You can configure the indicator to see only weekly support/resistance or only default timeframe support/resistance.

  • weekly support/resistance areas are drawn in blue and red.

  • default timeframe support/resistance areas are drawn in green and orange.

Advantages :

  • easy to use.
  • it’s not working with ProRealtime v10.3
 

Valoraciones

No hay valoraciones aún.

Solo los usuarios registrados que hayan comprado este producto pueden hacer una valoración.

Solicitud de información

Your personal data will be used to support your experience throughout this website, to manage access to your account, and for other purposes described in our política de privacidad

Más artículos por CoolScreeners

Product Image

Swapping level

Quickly detect the underlying trend of an asset and get an entry point

69

2

Product Image

Moving Average + High volume Screener

Detect high volume + conditions on MA for trendfollowing

49

0

Product Image

Trend IntraDay Screener

Detect the begin of an uptrend and some buying/selling point (...)

49

2

¡Listo para unirse a nuestro mercado trading!
Además de 1,000,000 los clientes potenciales necesitan productos trading de calidad profesional
Únase a nosotros hoy mismo