49 / anno
Compatibile con

Favoriti:1   Visualizzazioni:284   Recensioni:0  

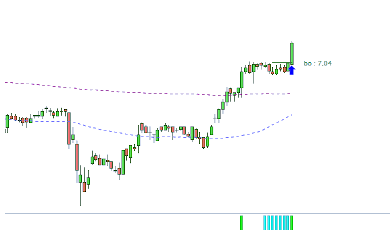
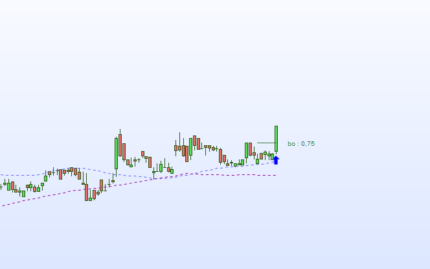
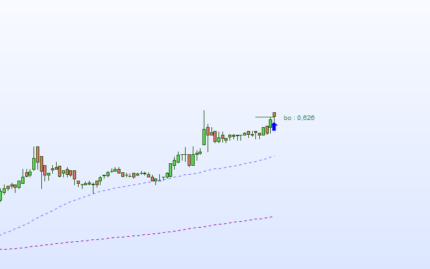
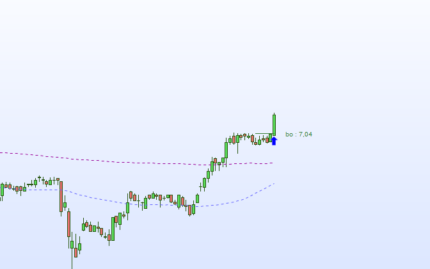
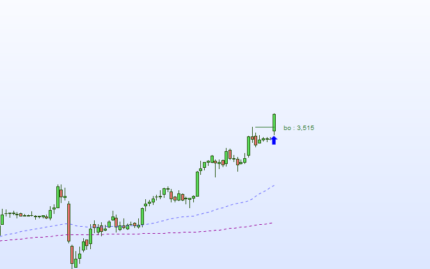
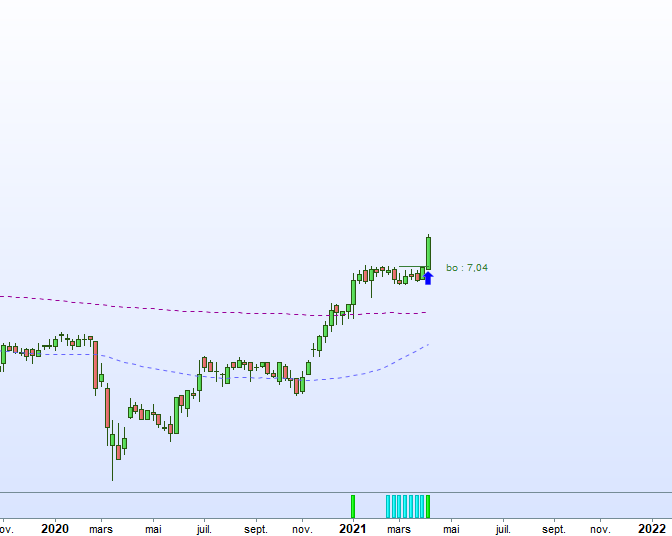
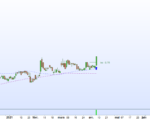
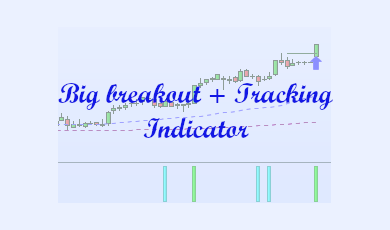
This indicator shows under the chart when a breakout with volume have been made and candles where we were near the highest price before another breakout.

Report Abuse

This indicator shows when a breakout with volume have been made and candles where we were near the highest price before a possible another breakout.

The indicator must be installed under the chart.

There are two categories:

  • a green bar means there is a breakout of the last highest price with volume.
  • a blue bar means the price is near the highest price after a breakout and could make another one.


Advantages :

  • the indicator can be used in DAILY or WEEKLY timeframes.
  • a screener is available to detect actions with these configurations.
Recensioni

Ancora non ci sono recensioni.

Solamente clienti che hanno effettuato l'accesso ed hanno acquistato questo prodotto possono lasciare una recensione.

Richiesta Prodotto

Your personal data will be used to support your experience throughout this website, to manage access to your account, and for other purposes described in our privacy policy

Altri articoli da CoolScreeners

Product Image

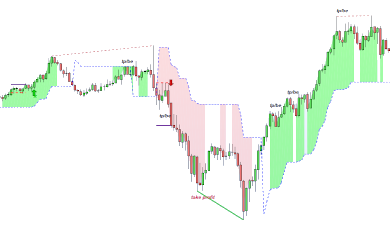
Moving Average cross indicator

View a crossing of MA for trendfollowing

49

0

Product Image
49

0

Product Image

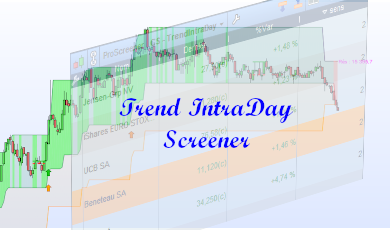
Trend IntraDay Screener

Detect the begin of an uptrend and some buying/selling point (...)

49

2

Pronto a unirti al nostro Marketplace!
Più 1,000,000 i potenziali clienti hanno bisogno di prodotti commerciali di qualità pro
Unisciti a noi oggi