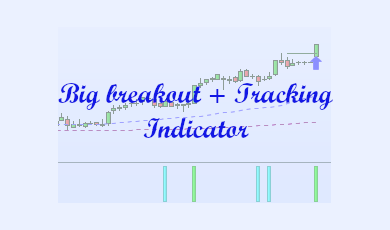
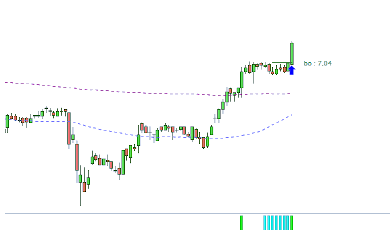
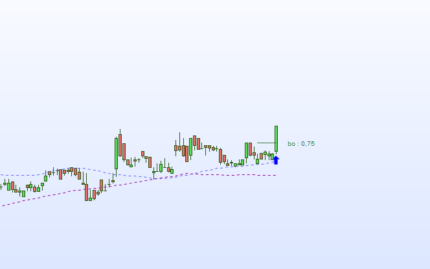
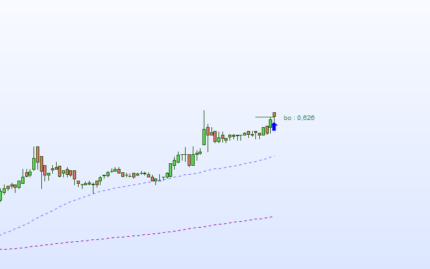
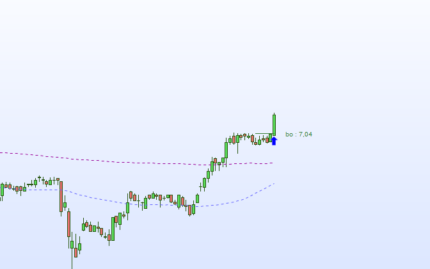
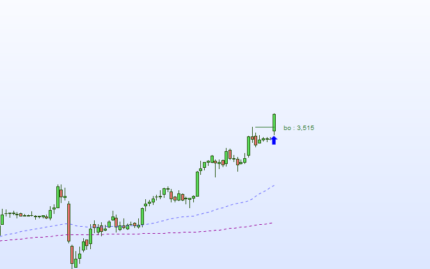
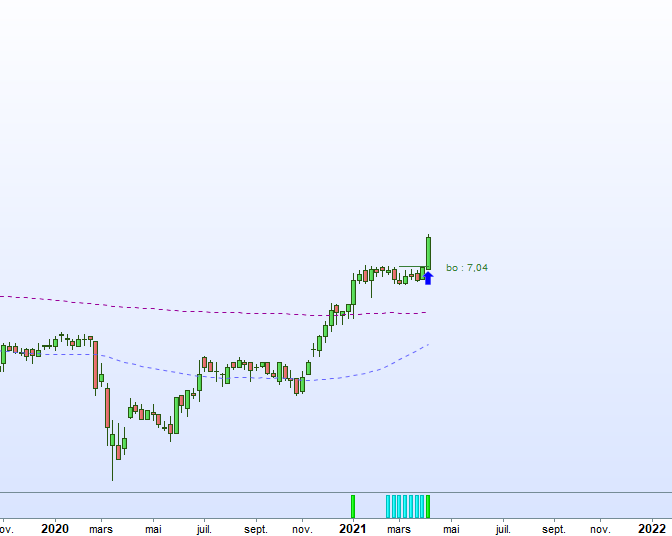
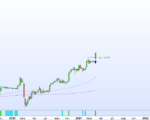
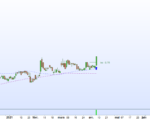
This indicator shows when a breakout with volume have been made and candles where we were near the highest price before a possible another breakout.
The indicator must be installed under the chart.
There are two categories:
- a green bar means there is a breakout of the last highest price with volume.
- a blue bar means the price is near the highest price after a breakout and could make another one.
Advantages :
- the indicator can be used in DAILY or WEEKLY timeframes.
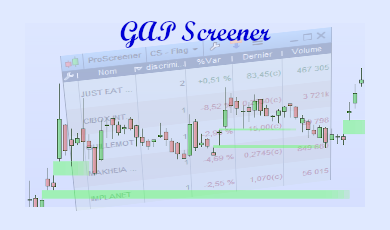
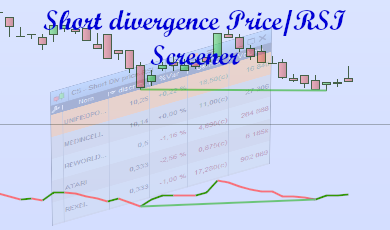
- a screener is available to detect actions with these configurations.


Avis
Il n’y a pas encore d’avis.