49 / año
Compatible con

Favoritos:1   Vistas:245   Reseñas:0  

This indicator shows under the chart when a breakout with volume have been made and candles where we were near the highest price before another breakout.

Report Abuse

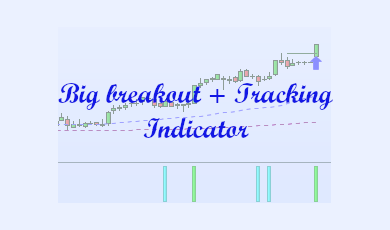
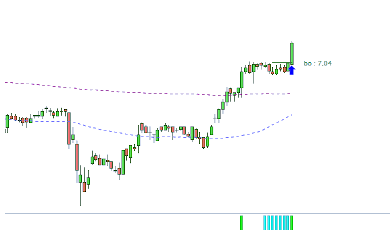
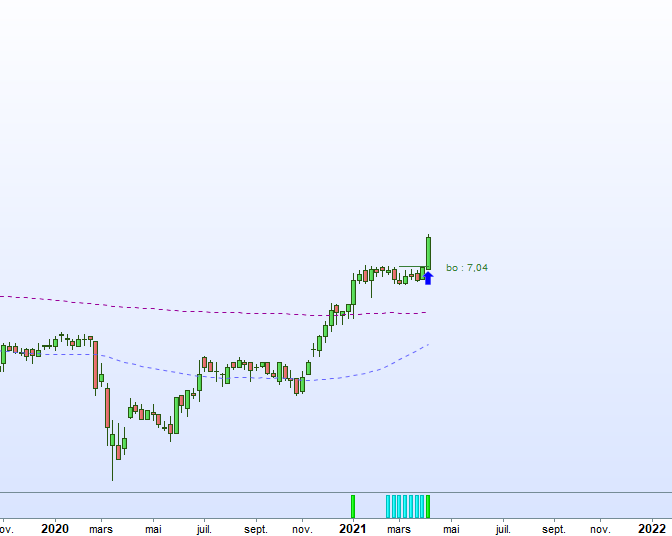
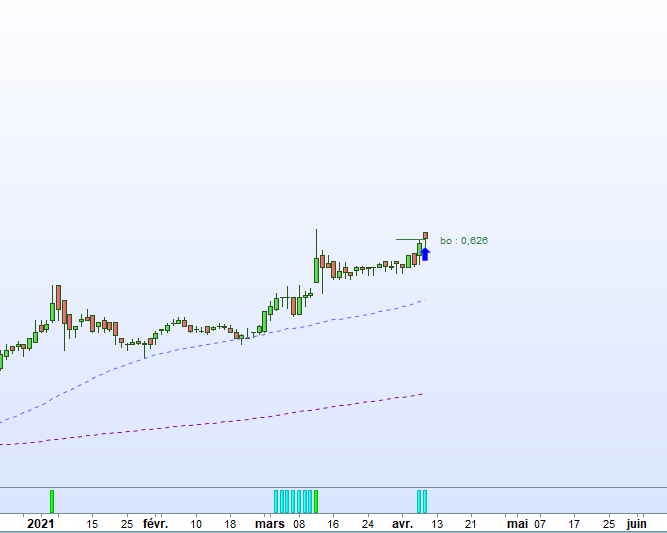
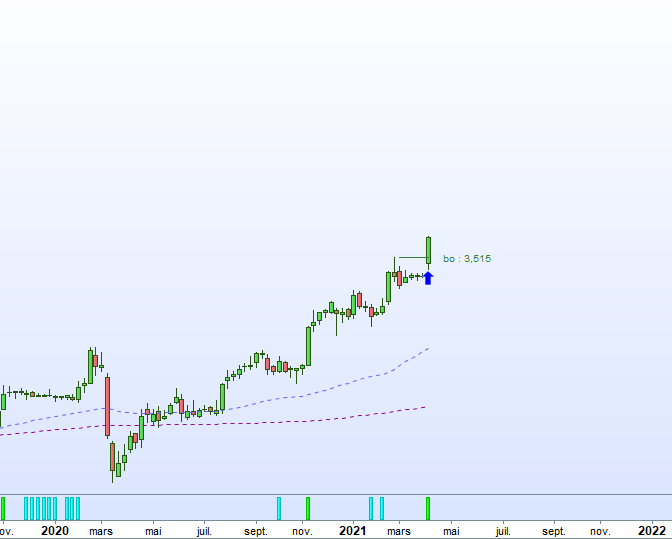
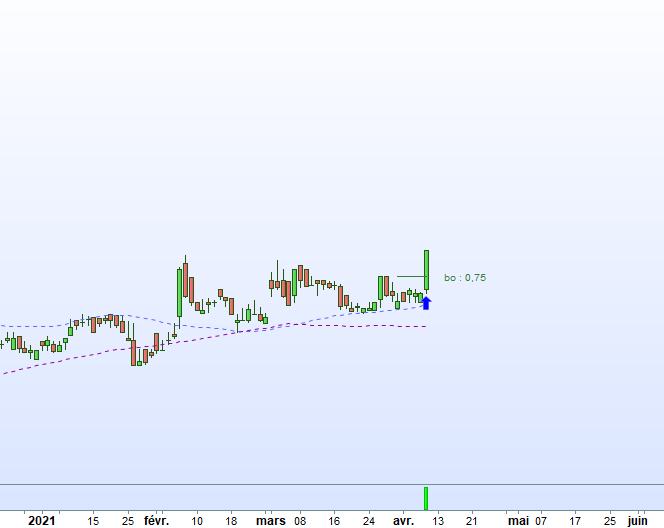
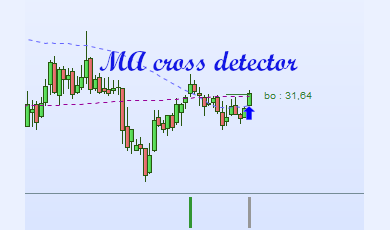
This indicator shows when a breakout with volume have been made and candles where we were near the highest price before a possible another breakout.

The indicator must be installed under the chart.

There are two categories:

  • a green bar means there is a breakout of the last highest price with volume.
  • a blue bar means the price is near the highest price after a breakout and could make another one.


Advantages :

  • the indicator can be used in DAILY or WEEKLY timeframes.
  • a screener is available to detect actions with these configurations.

Reviews

There are no reviews yet.

Only logged in customers who have purchased this product may leave a review.

Product Enquiry

Your personal data will be used to support your experience throughout this website, to manage access to your account, and for other purposes described in our privacy policy

More Items by CoolScreeners

Product Image
49

1

Product Image

Wolfe Waves screener

Detect Wolfe Waves pattern on a list of stocks

49

1

Product Image
49

0

Ready to Join Our Trading Marketplace!
Over 1,000,000 potential customers are in need for pro quality trading products
Join Us Today