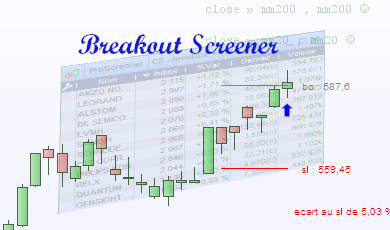
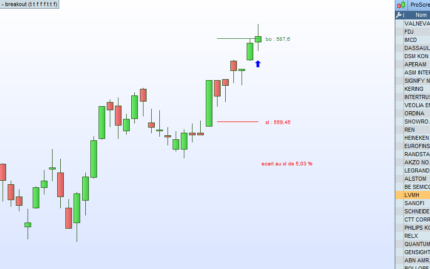
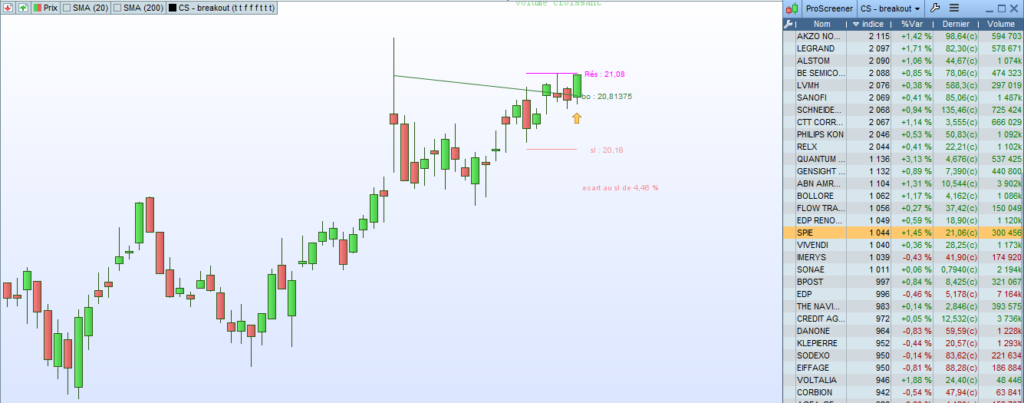
This screener detects the break of a horizontal resistance or a bearish oblique resistance.
Stocks are classified according to the breakout :
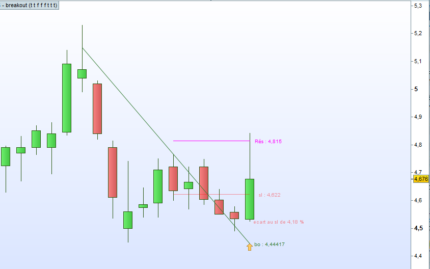
- a value around 1000 means the price broke a bearish oblique resistance.
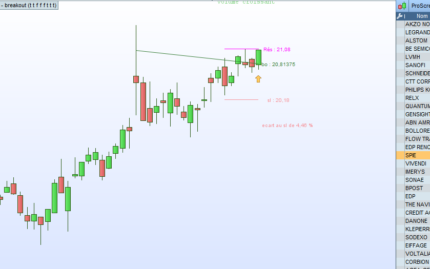
- a value around 2000 means the price broke a horizontal resistance and is already in an uptrend.
- a value around 2500 means the price broke a horizontal resitance, was in a downtrend and begins an uptrend.
- a value around 3000 means the price broke a long horizontal resistance.
Advantages:
- the screener can be used in many timeframes : Weekly, Daily, hourly and M15.
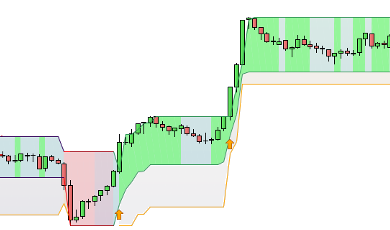
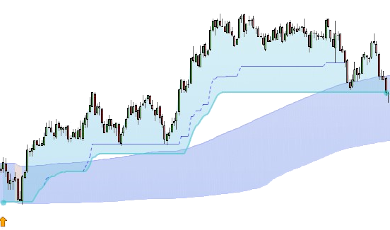
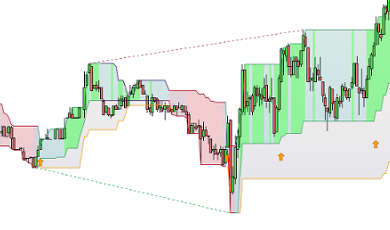
- an indicator is available to view the resistances, possible Stoploss and more again…



Recensioni
Ancora non ci sono recensioni.