59 / year
Compatible with

Favorites: 1   Views: 406   Reviews: 0  

Detect breakout of a horizontal resistance or a bearish oblique resistance.

Report Abuse

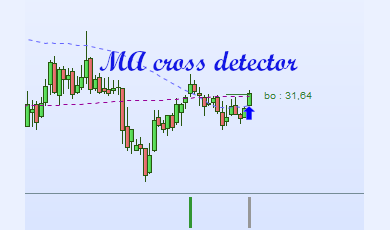
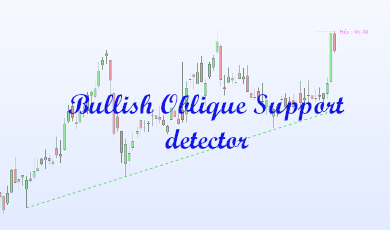
This screener detects the break of a horizontal resistance or a bearish oblique resistance.

Stocks are classified according to the breakout :

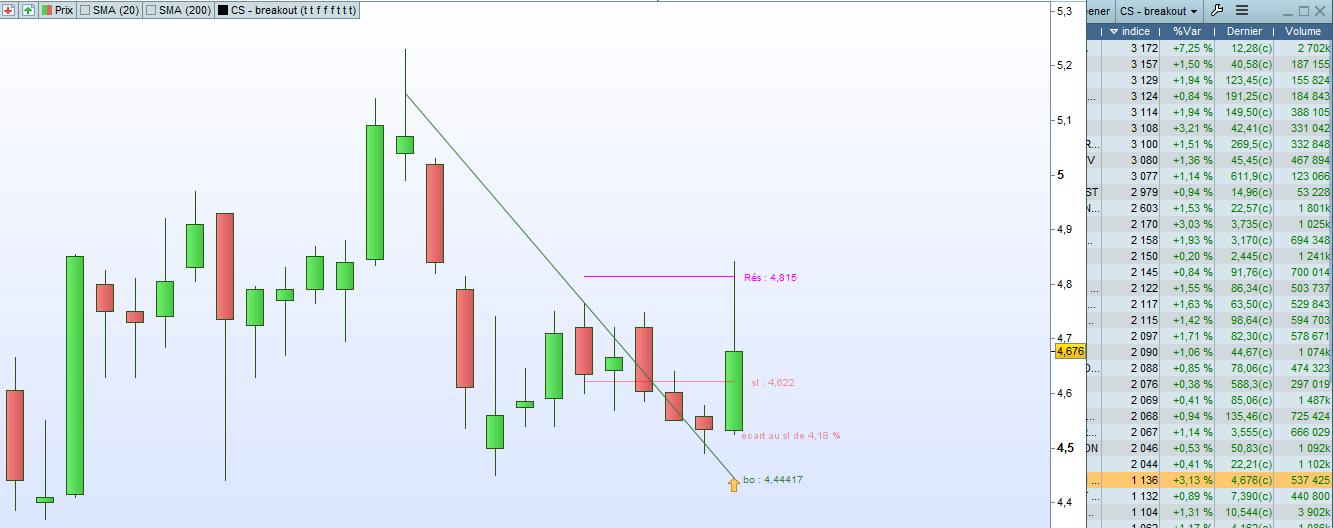
  • a value around 1000 means the price broke a bearish oblique resistance.
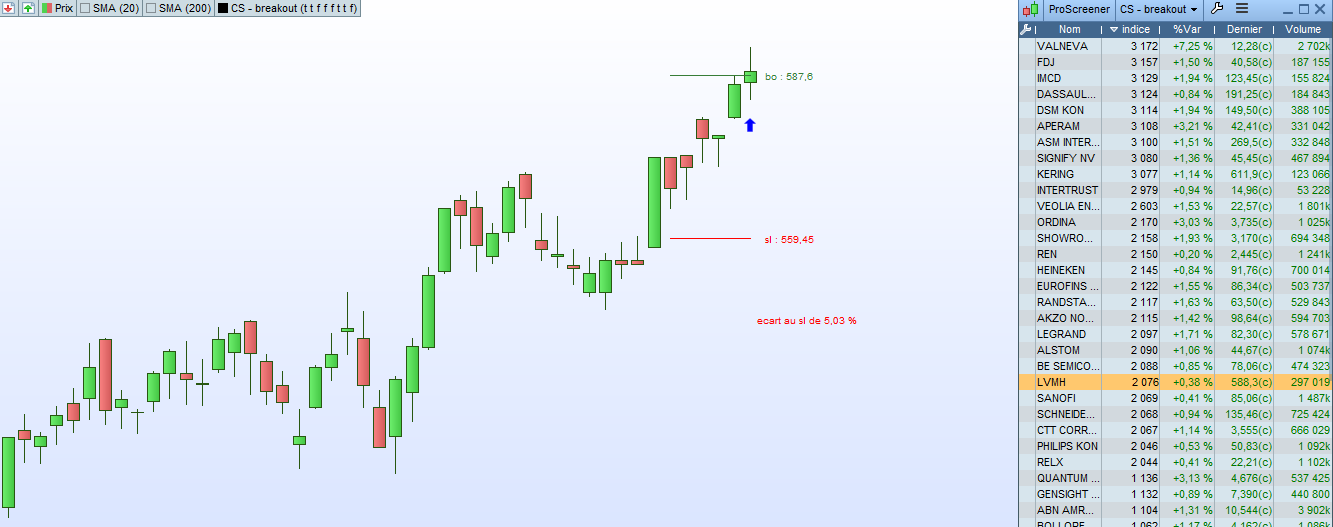
  • a value around 2000 means the price broke a horizontal resistance and is already in an uptrend.
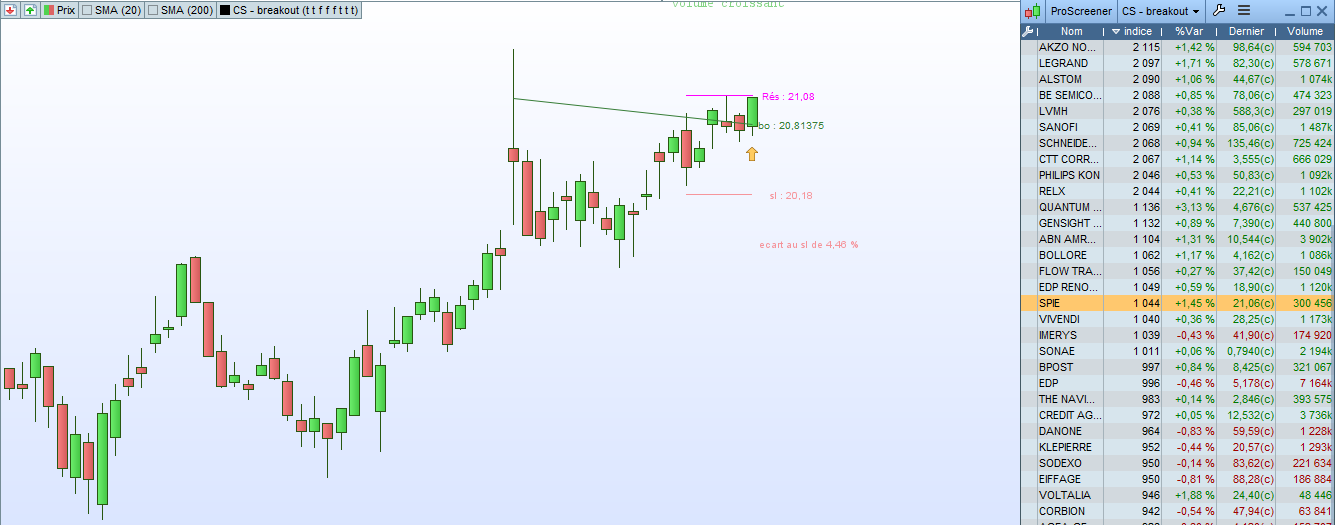
  • a value around 2500 means the price broke a horizontal resitance, was in a downtrend and begins an uptrend.
  • a value around 3000 means the price broke a long horizontal resistance.


Advantages:

  • the screener can be used in many timeframes : Weekly, Daily, hourly and M15.
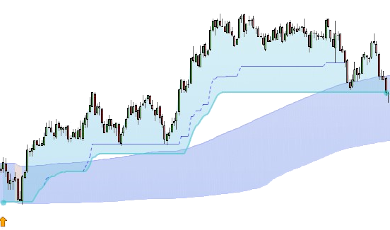
  • an indicator is available to view the resistances, possible Stoploss and more again…


Reviews

There are no reviews yet.

Only logged in customers who have purchased this product may leave a review.

Product Enquiry

Your personal data will be used to support your experience throughout this website, to manage access to your account, and for other purposes described in our privacy policy

More Items by CoolScreeners

Product Image
49

0

Product Image

Bullish Oblique Support detector

Detect Bullish Oblique Support (SOH) on a graph.

49

0

Product Image

Trend IntraDay Screener

Detect the begin of an uptrend and some buying/selling point (...)

49

2

Ready to Join Our Trading Marketplace!
Over 1,000,000 potential customers are in need for pro quality trading products
Join Us Today