What Are Footprint Charts?
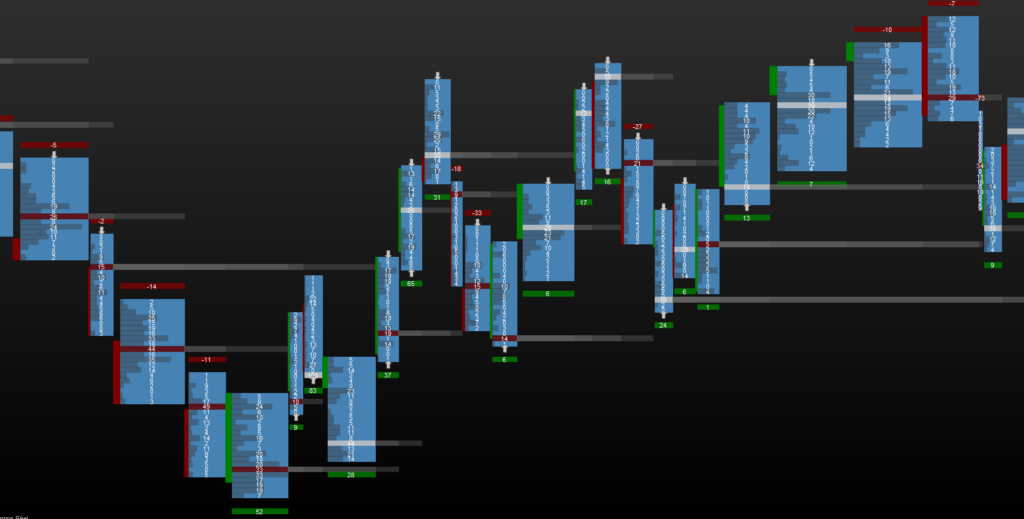
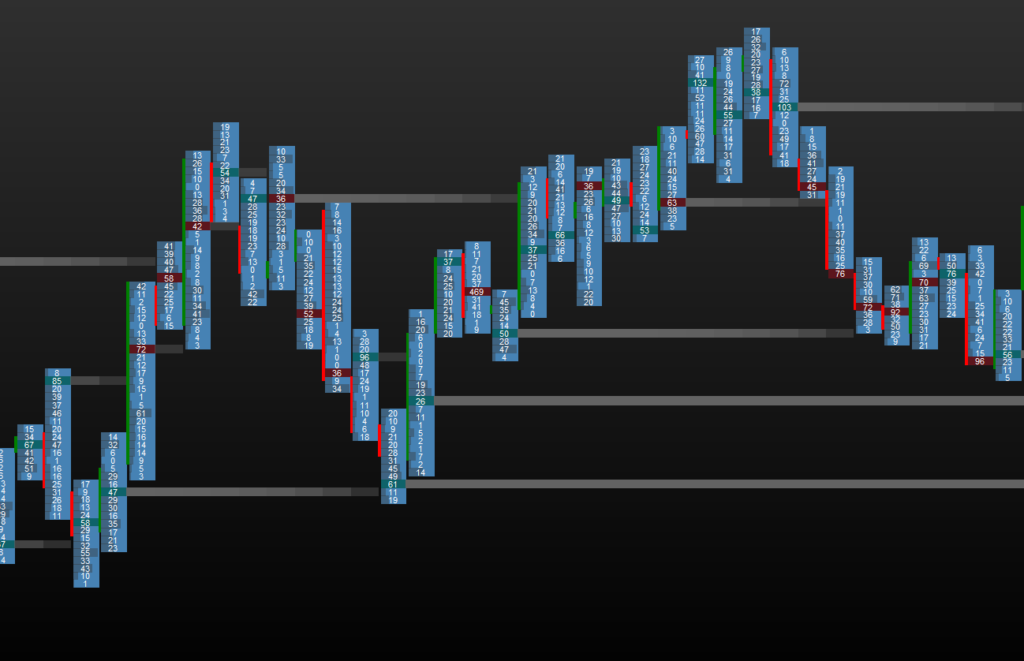
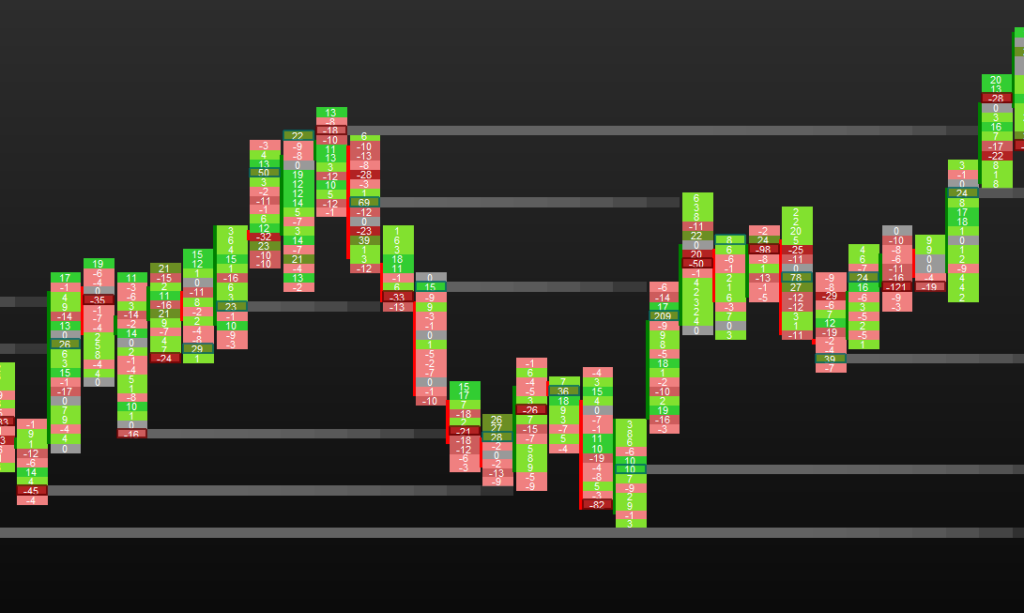
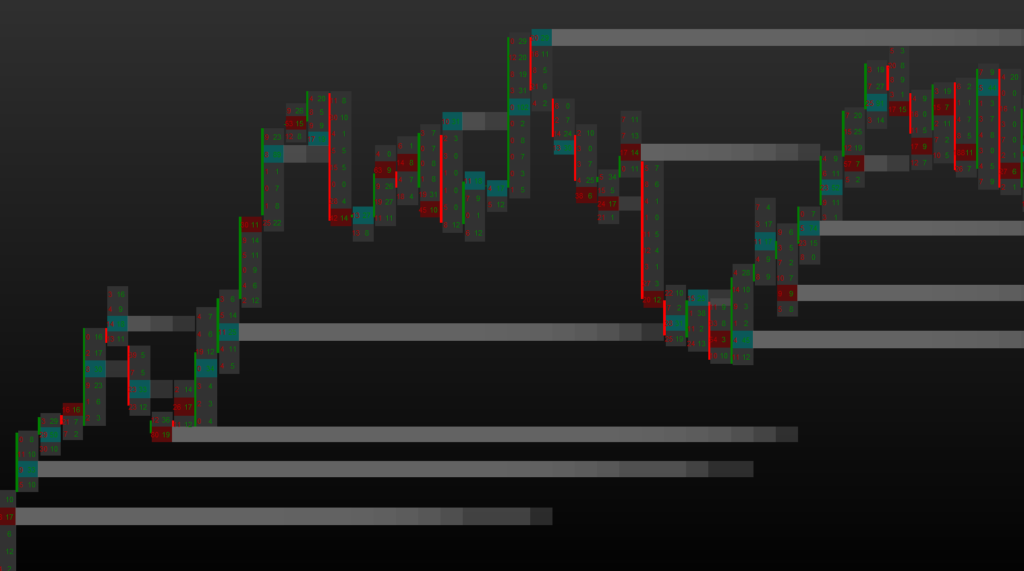
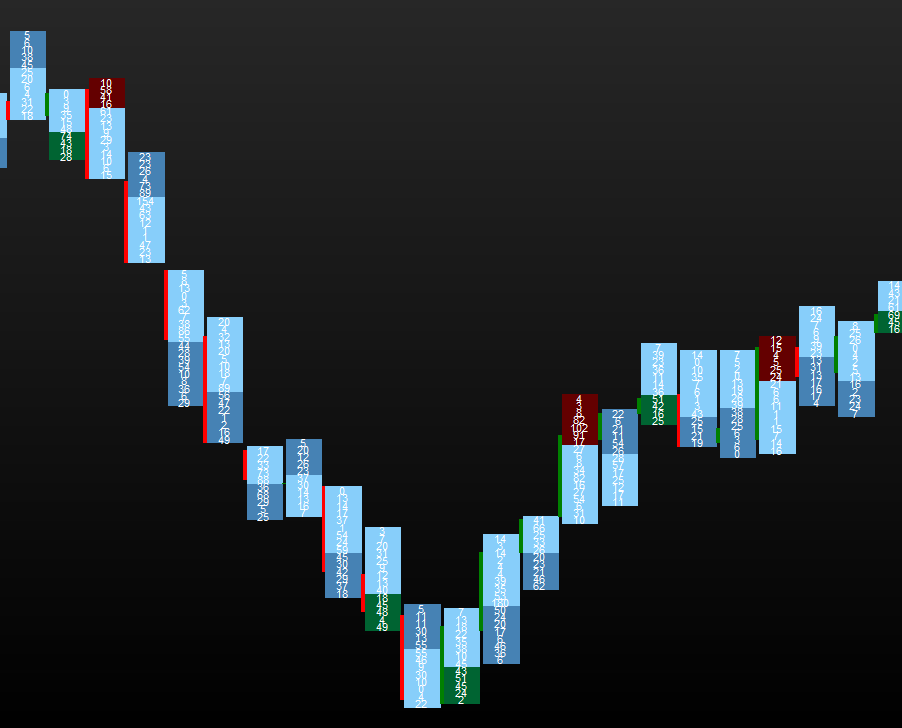
Footprint charts are a type of candlestick chart that provides trade volume information in addition to price. This gives an additional dimension that allows the investor a more in-depth analysis. The footprint chart is a major tool for many professional traders.
What are the features?
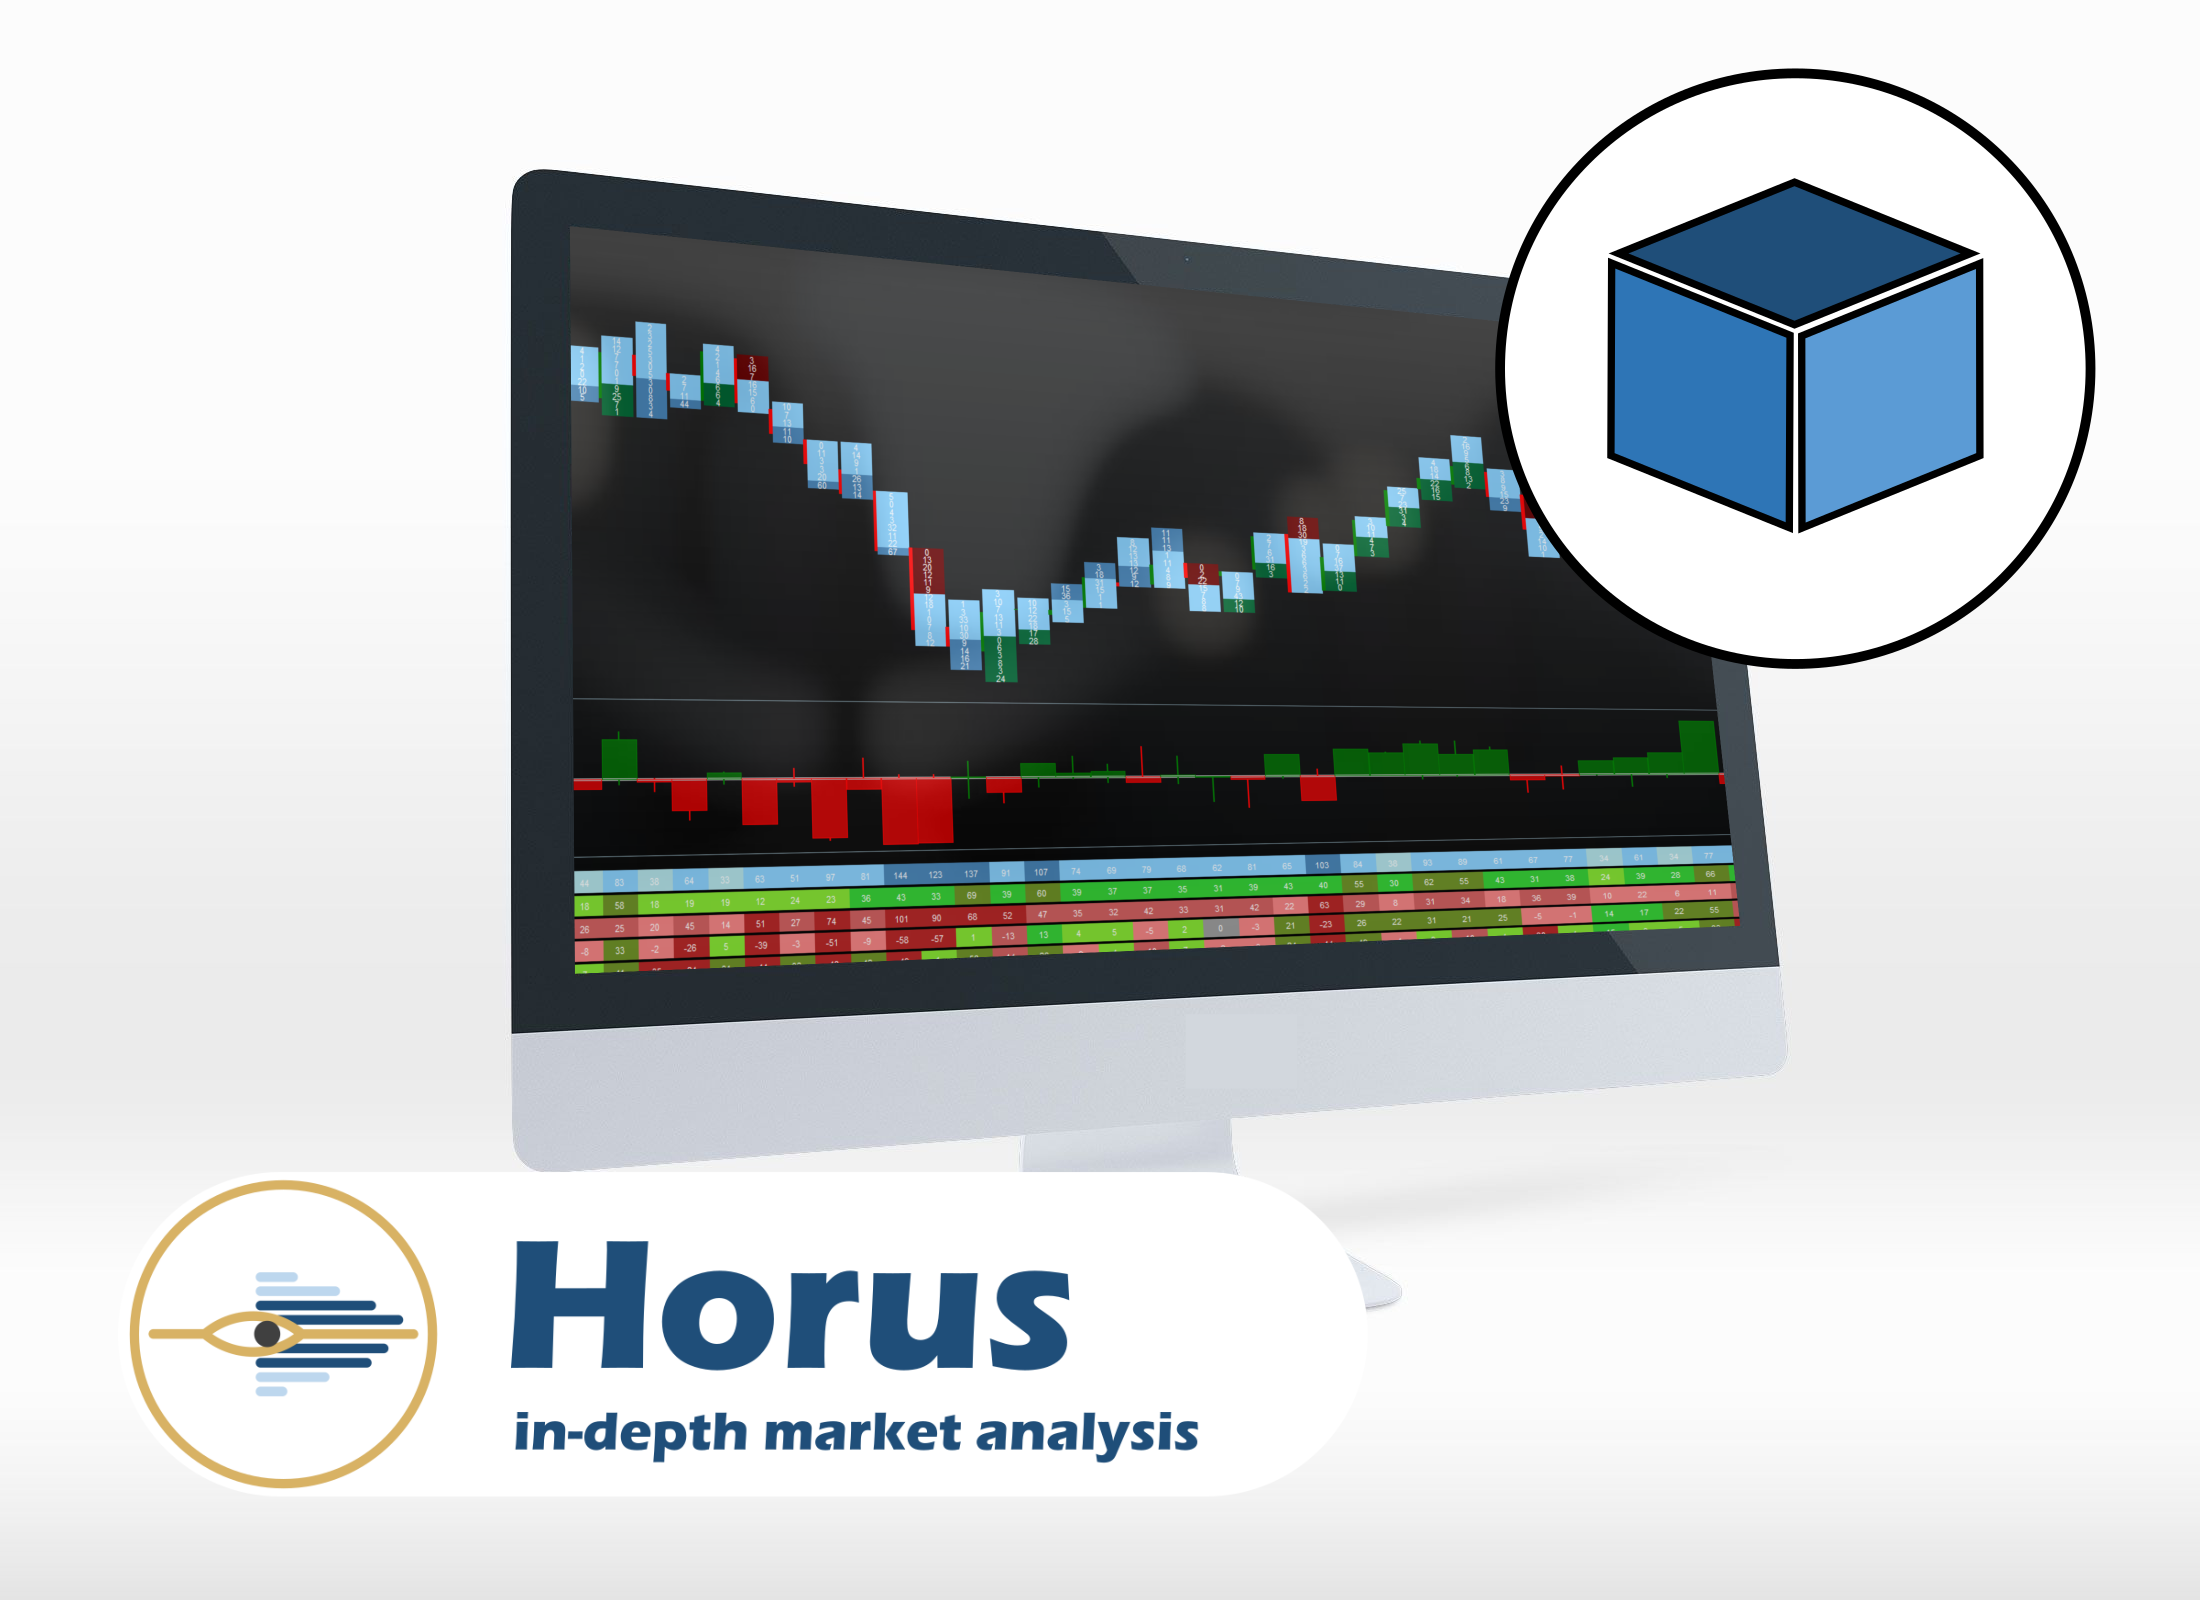
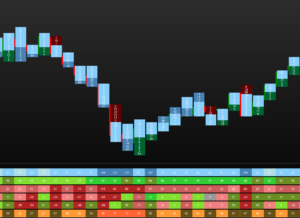
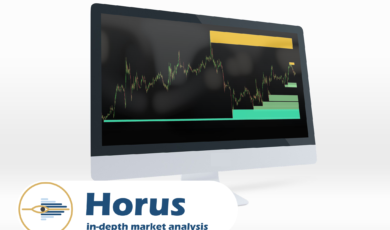
Horus – Footprint :
- Live current candle display
- Tick candle or range bar (New) of your choice
- Number of levels of your choice
- Volume filter
- 5 kinds of volume information that can be displayed :
- Bid/Ask – Sellers and buyers volume are separated
- Volume – Sellers and buyers volume are cumulative
- Only the Buyers volume
- Only the Sellers volume
- Delta between Buyers and Sellers
- 4 kinds of colourization :
- VPOC highlighted
- Median display
- Volume profile display
- Custom Display
- Naked VPOC – display untested vpocs
- Delta Volume the whole candle (New)
- Auction End Display (New)
!!New Update!!
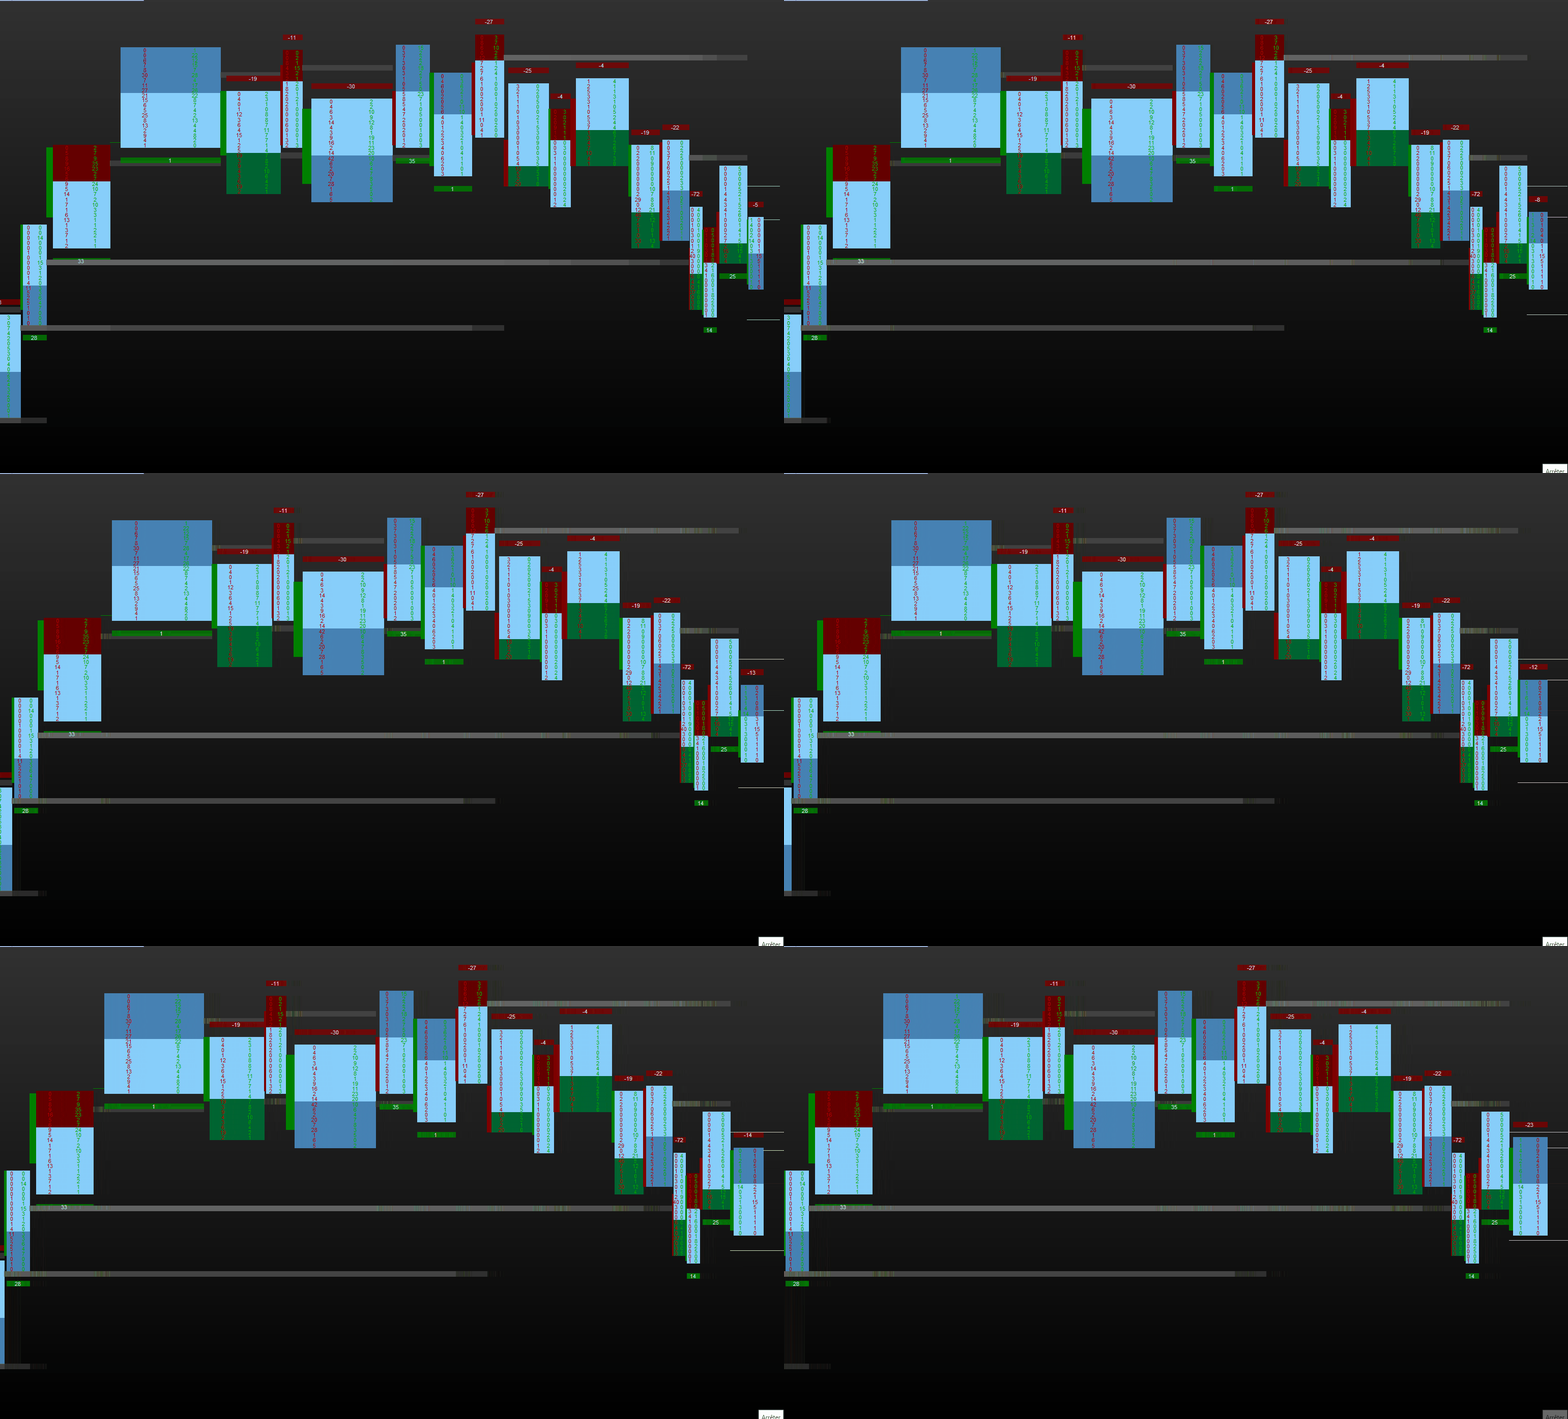
Here Footprint Range bar with Volume Delta and Auction end
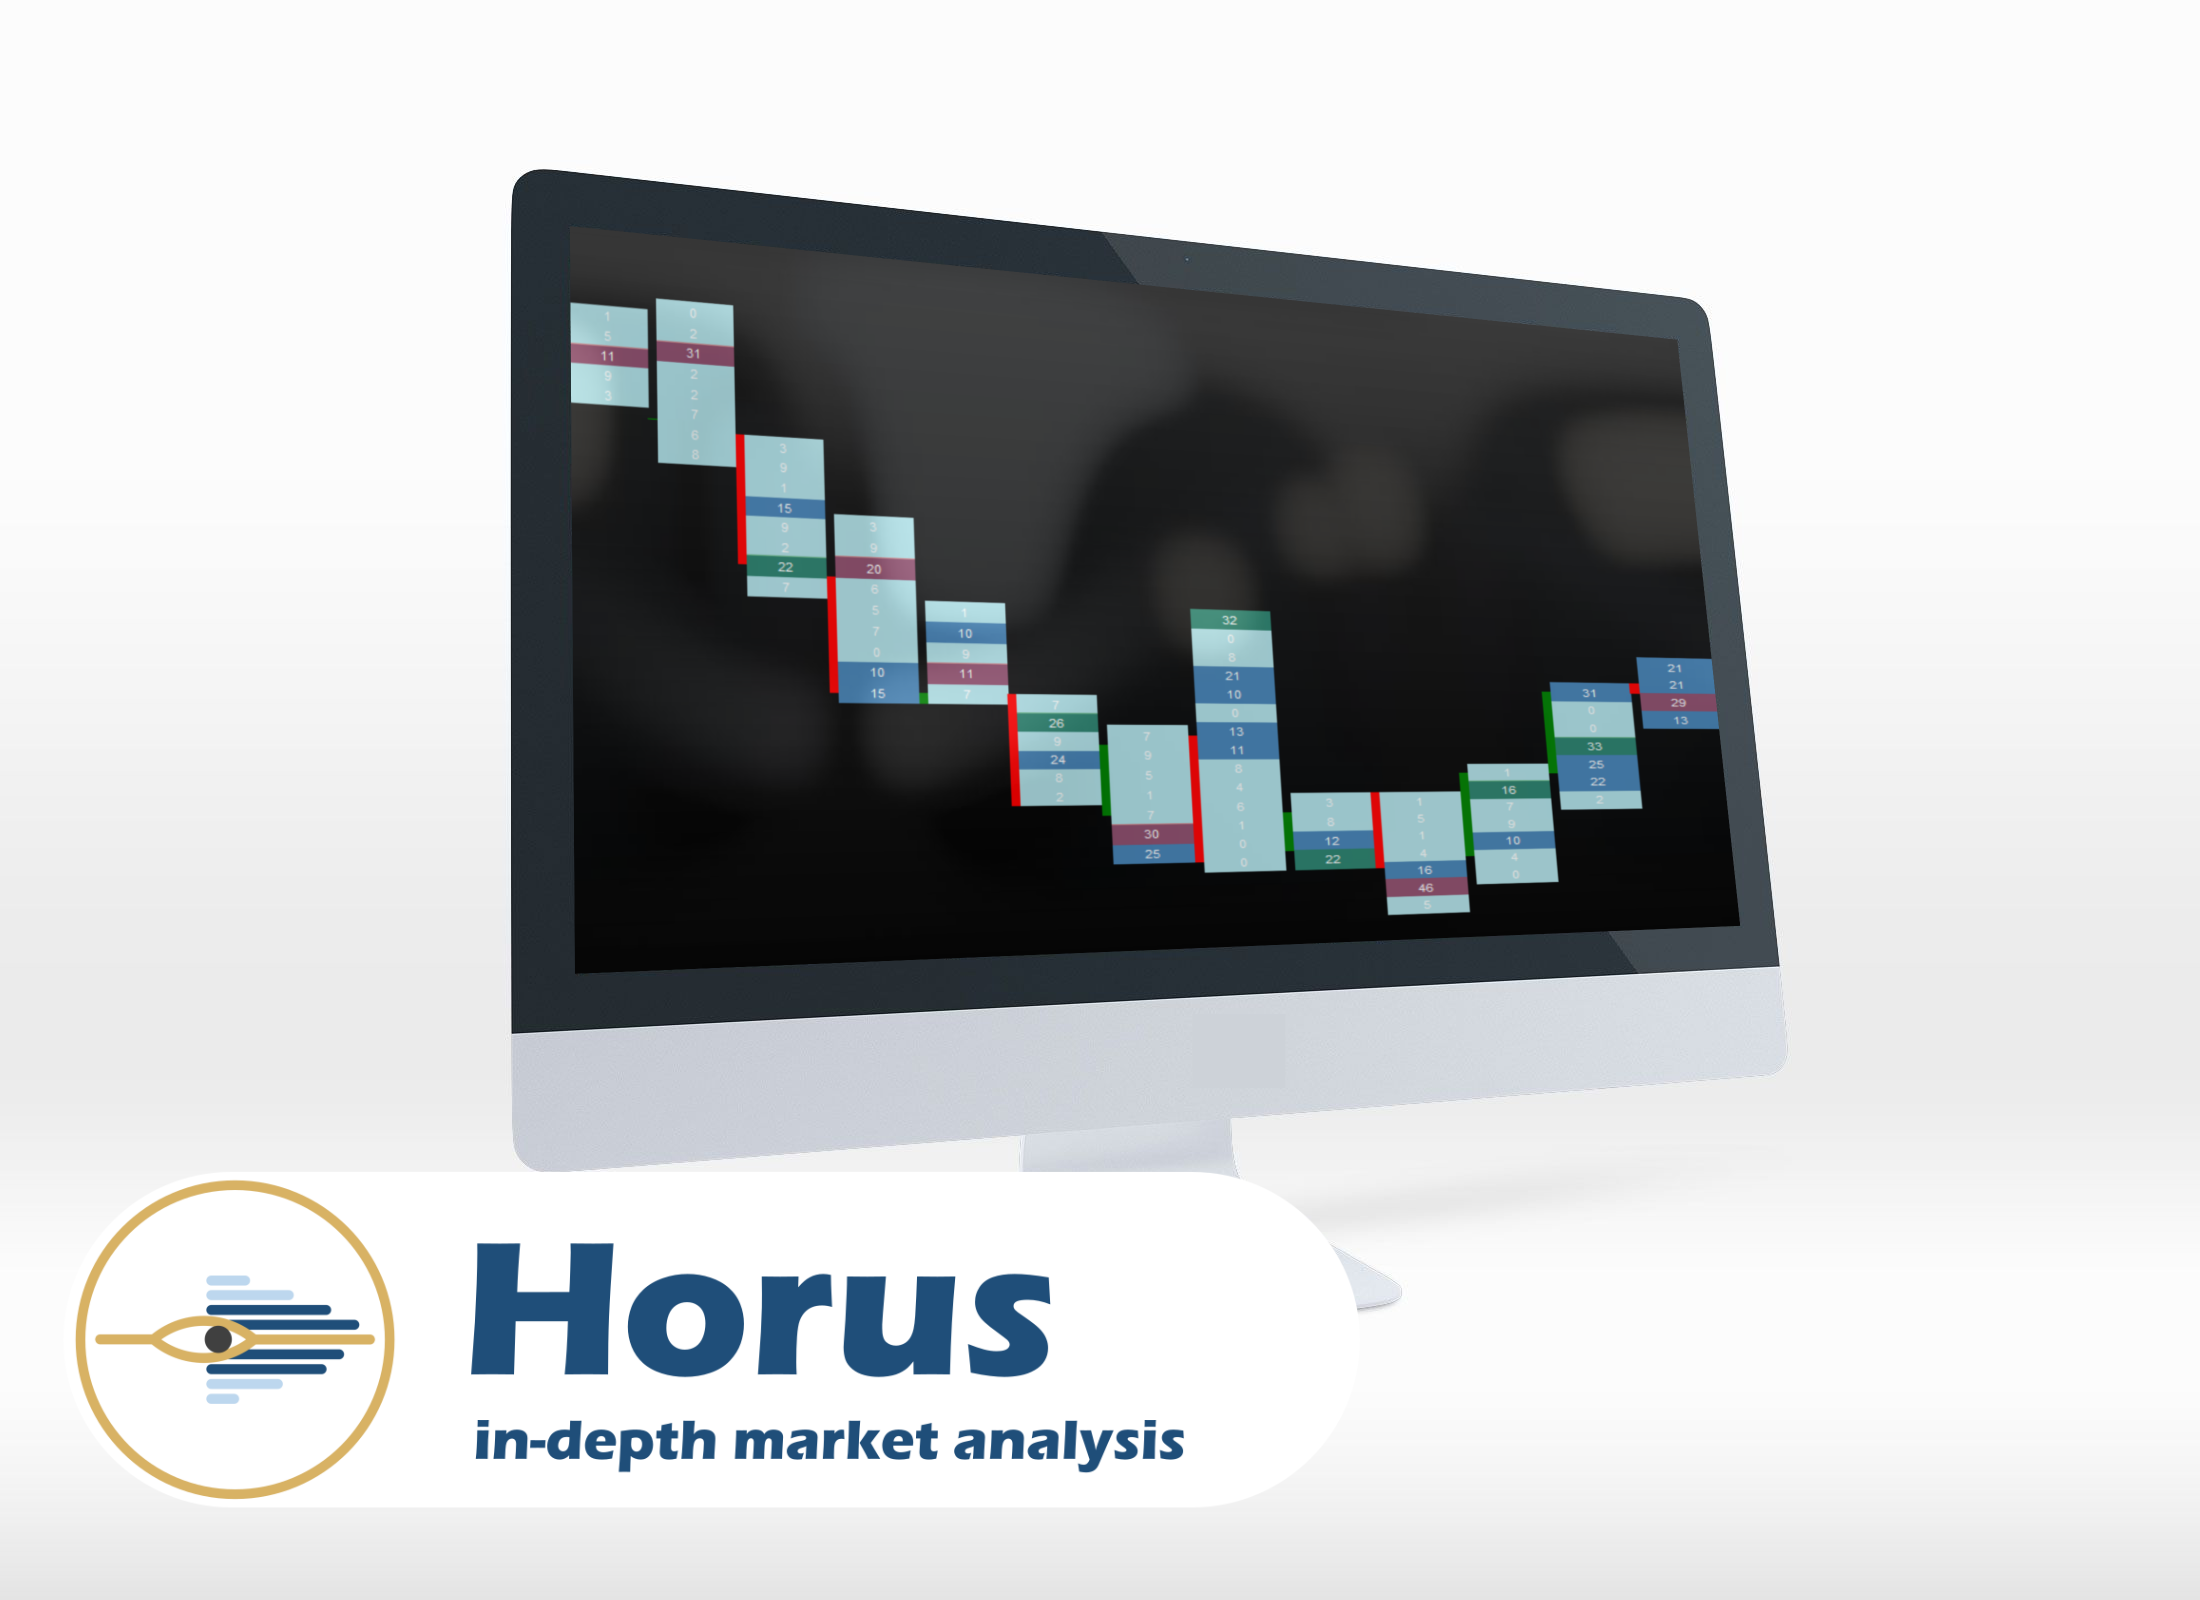
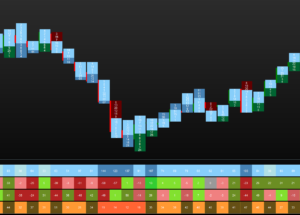
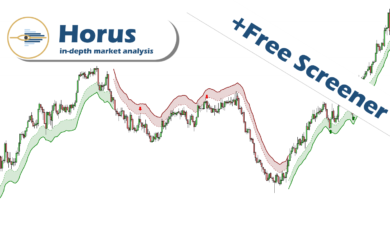
Horus – Statistic :
- Tick candle or range bar (New) of your choice
- Volume filter
- 6 kinds of statistics to display or not (1 to 6 statistics displayed) :
- Volume – Sellers and buyers volume are cumulative
- Only the Buyers volume
- Only the Sellers volume
- Delta between Buyers and Sellers
- Volume Delta with the previous candle
- Speed, the number of seconds the candle lasts
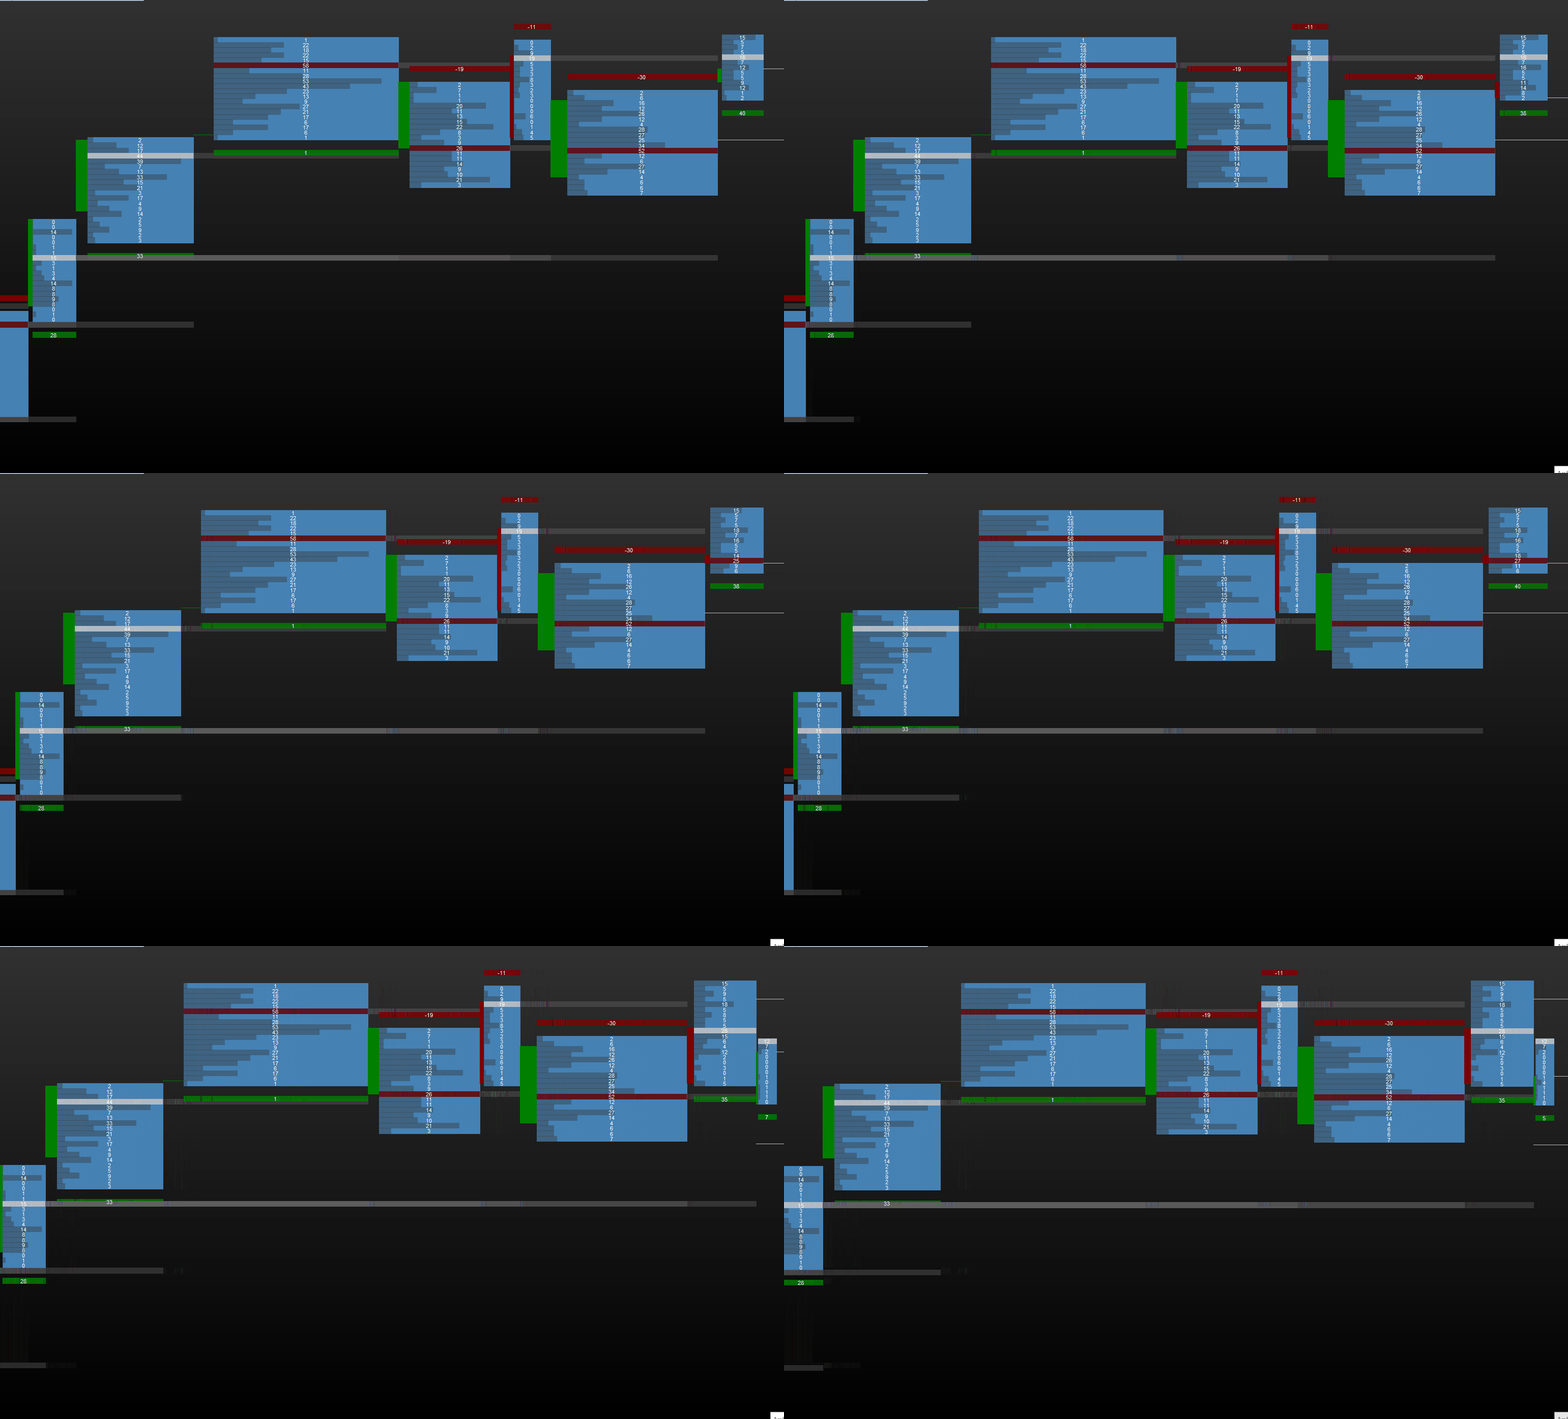
With 6 statistics
With 4 statistics
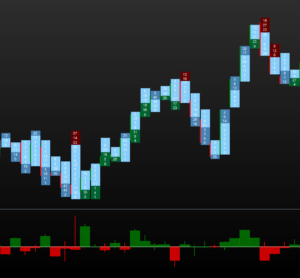
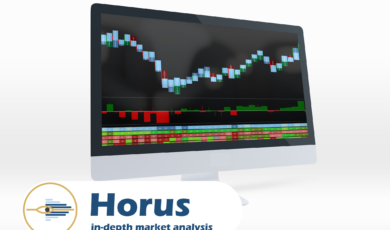
Horus – Volume Delta :
- Tick candle or range bar (New) of your choice
- Volume filter
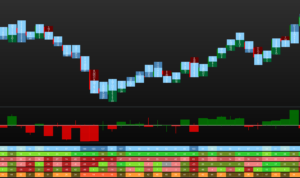
Full environment


bpater79 (proprietario verificato) –
Funziona davvero bene. Molto soddisfatto di questo plugin.
carl-wright (proprietario verificato) –
sarebbe stato più alto se la tabella delle statistiche avesse avuto delle etichette. ma nel complesso un buon prodotto con buone informazioni e display chiari.
arpenagos (proprietario verificato) –
Ottimo complemento per il processo decisionale, fornisce informazioni dettagliate che non è possibile reperire con altri strumenti.
chris_blu (proprietario verificato) –
Ciao, è un ottimo software di cui sono molto soddisfatto. Ci sono molte impostazioni e filtri diversi, alcuni unici per questo, quindi è necessario prendere tempo e studiare. È possibile tornare indietro nel tempo su timeframe più alti per vedere come appaiono le inversioni, i breakout, i fake out, i trend ecc. con le diverse impostazioni disponibili. Si tratta di un’aggiunta permanente ai miei grafici, che fornisce un ulteriore livello di conferma che le barre dei prezzi non possono offrire da sole, oltre a contribuire a rafforzare gli stop dietro le stampe basse!