What Are Footprint Charts?
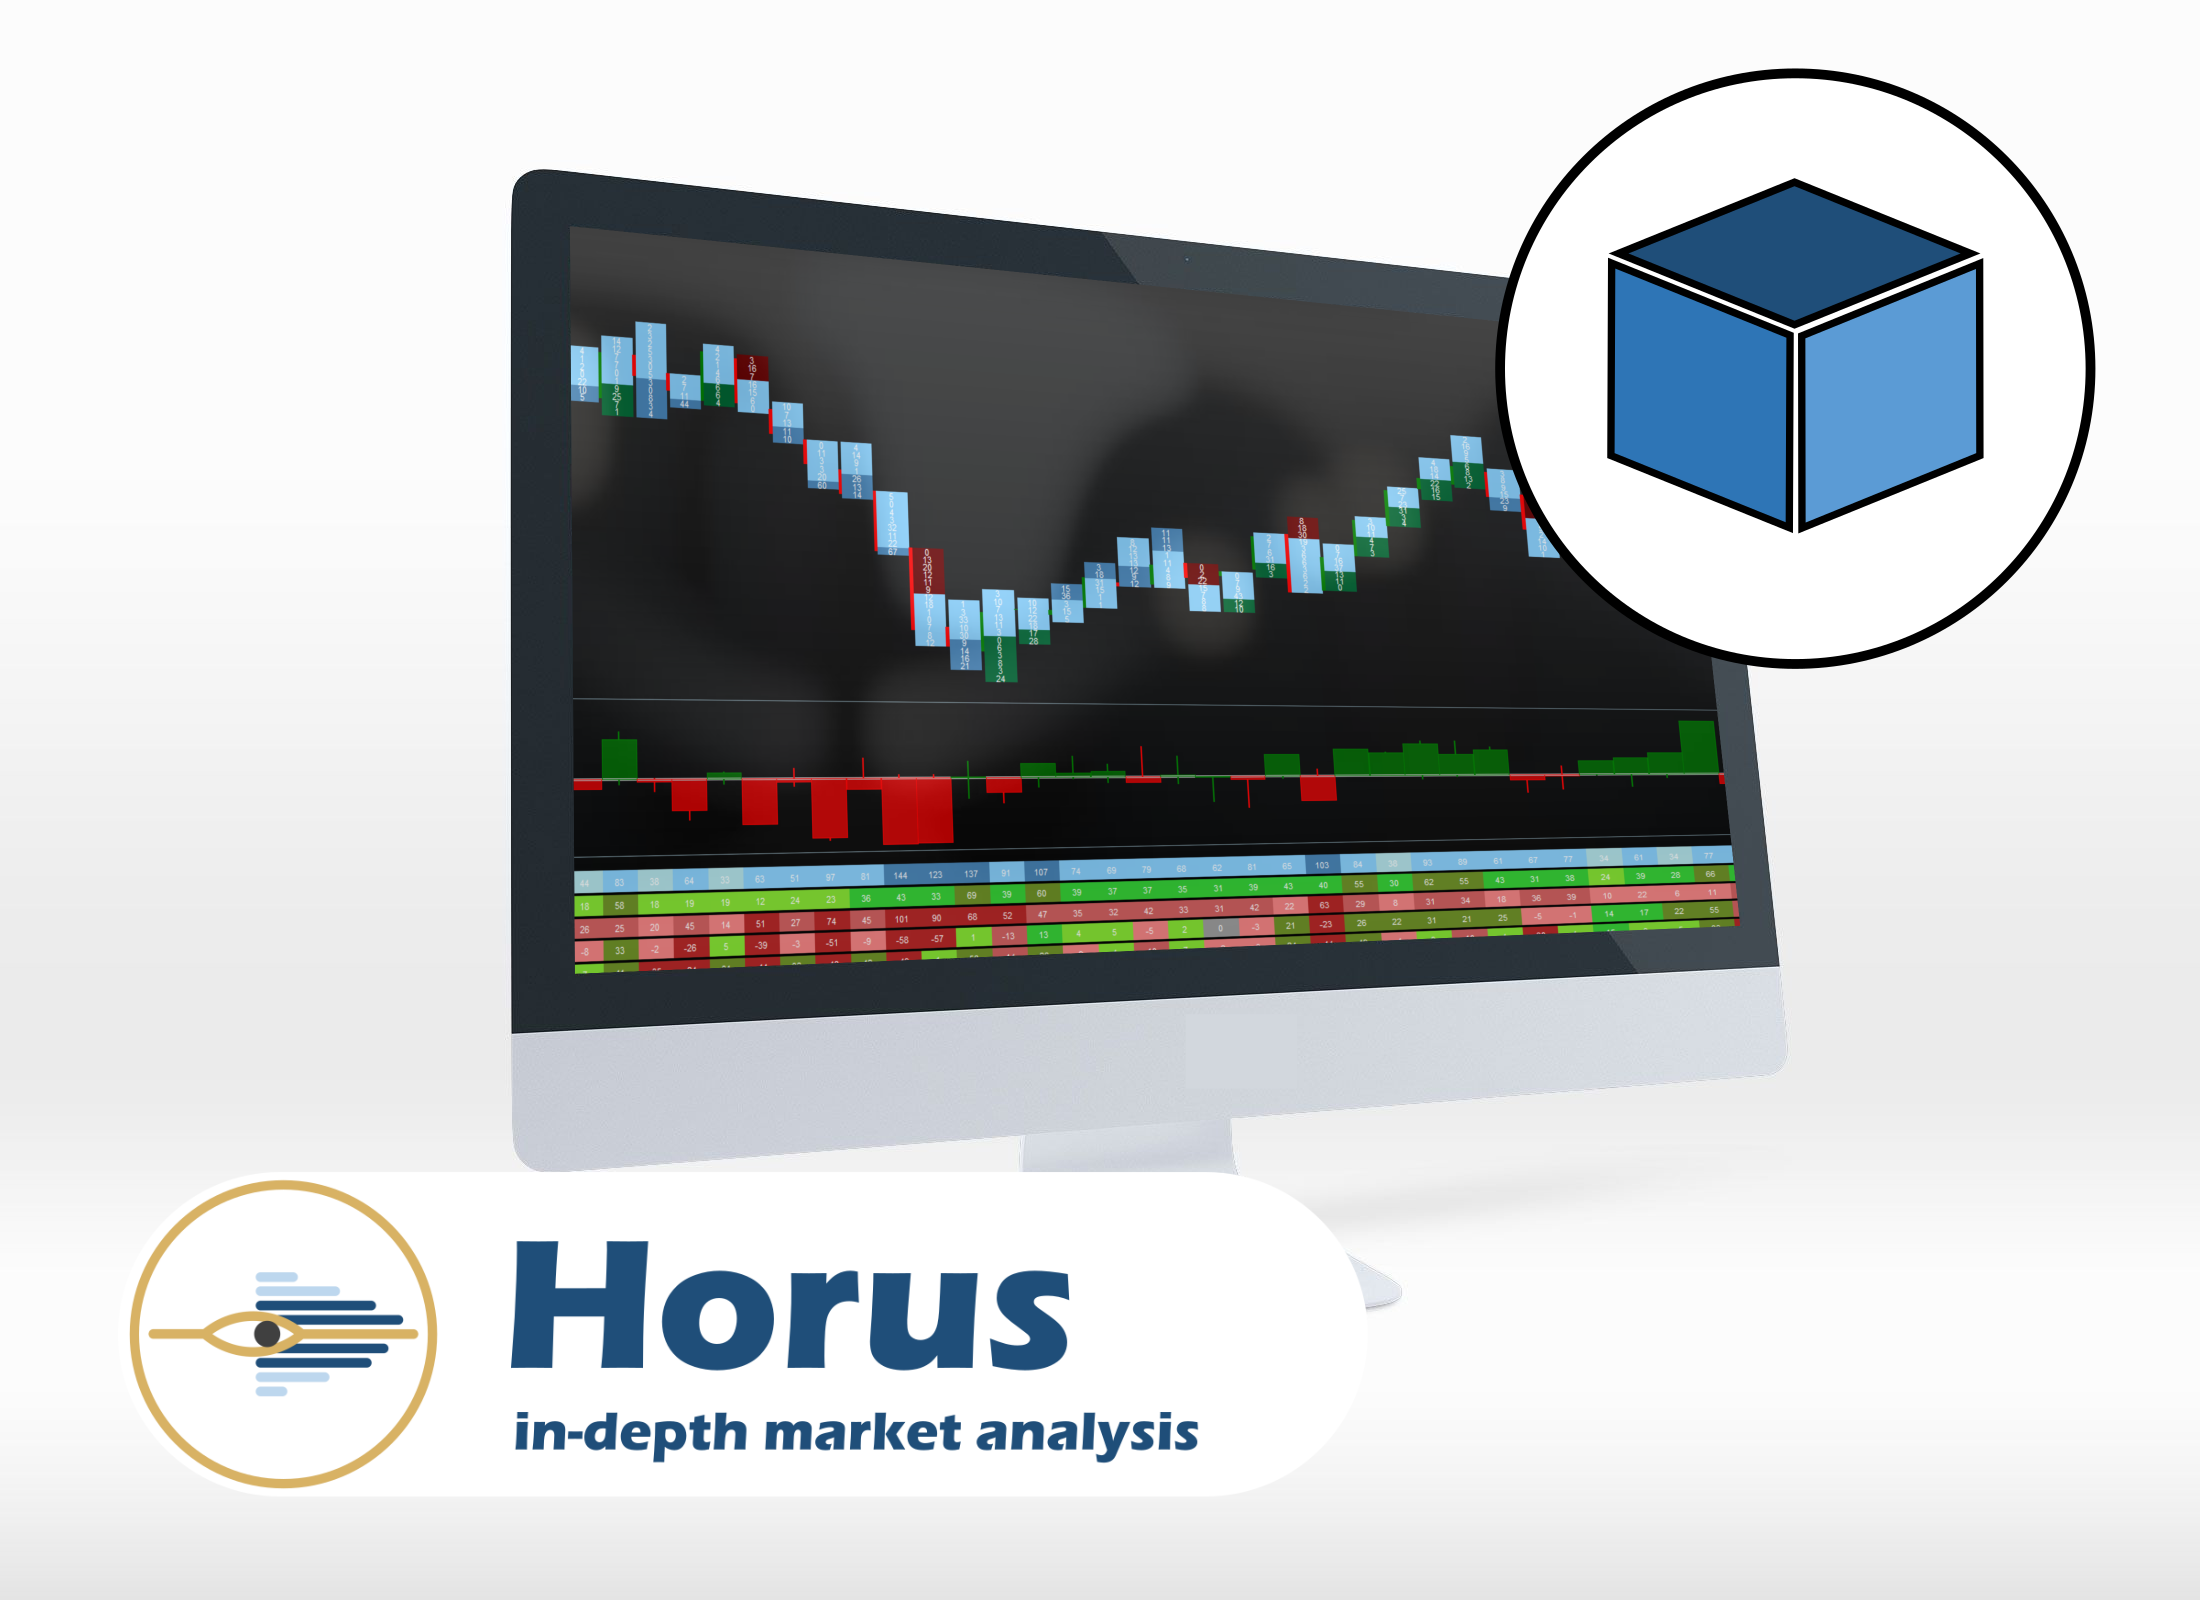
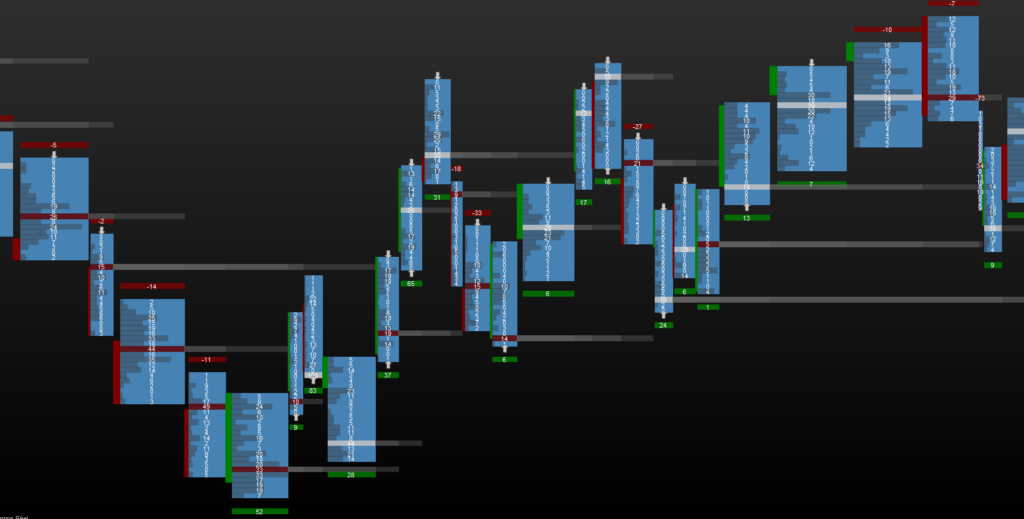
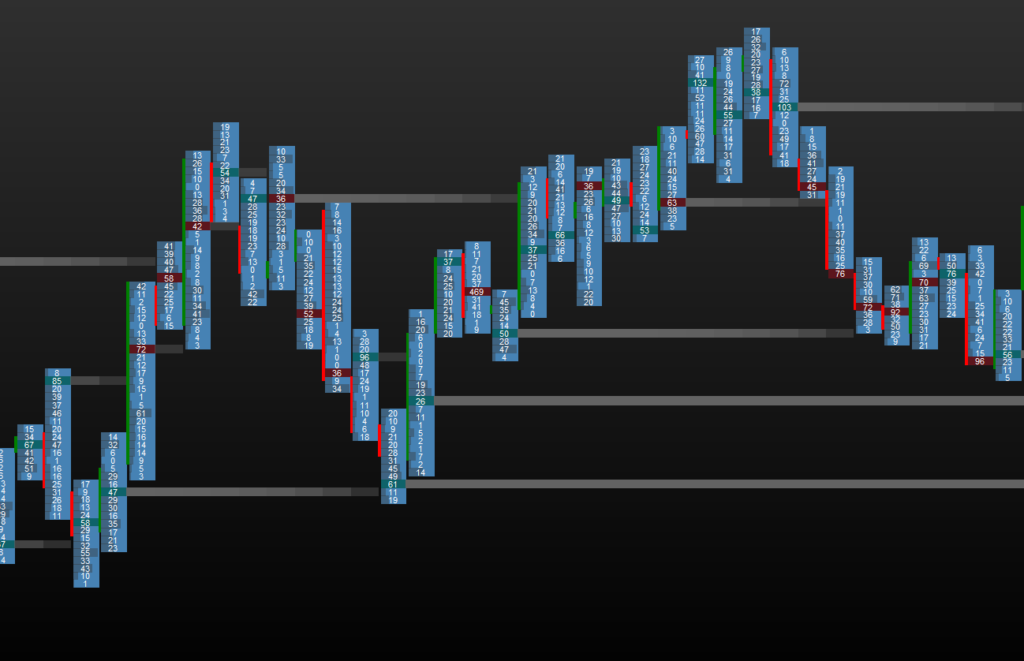
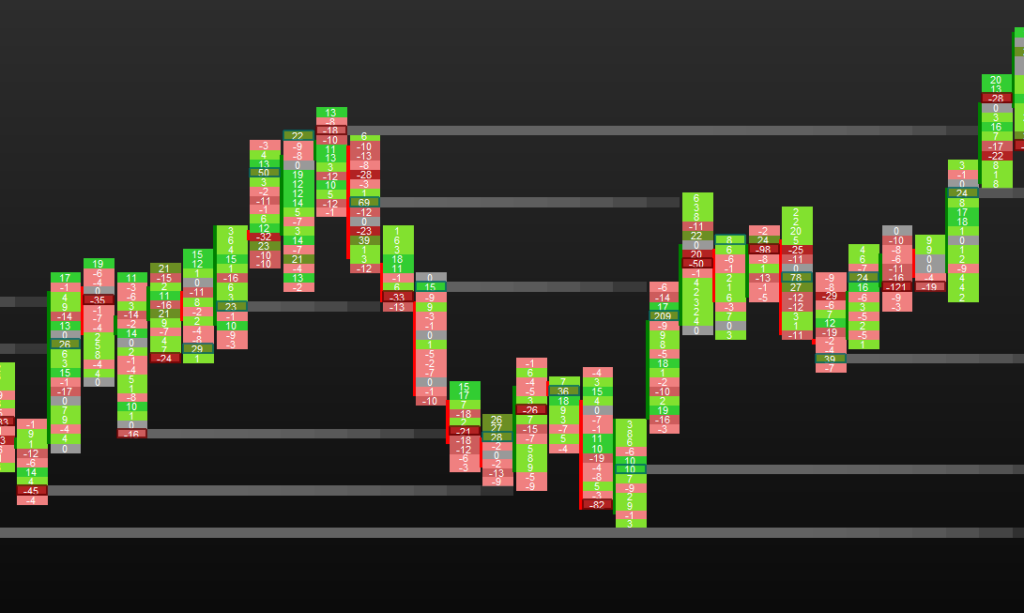
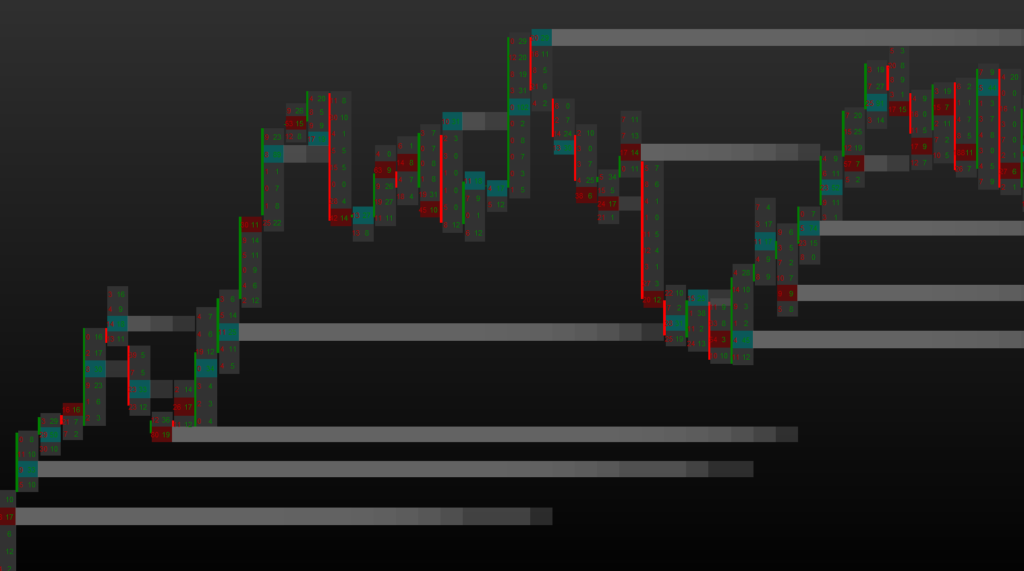
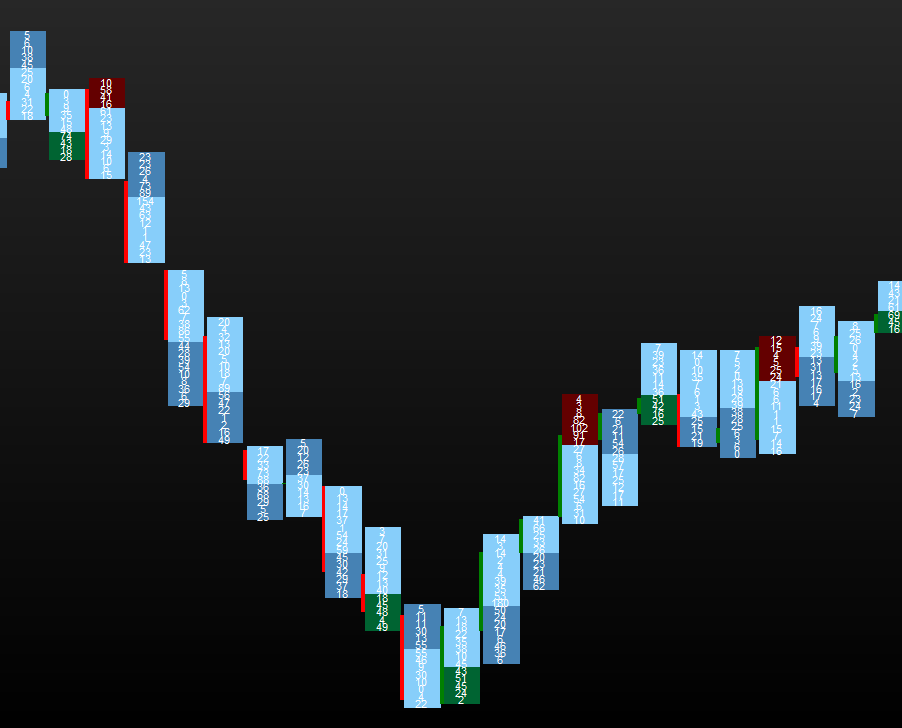
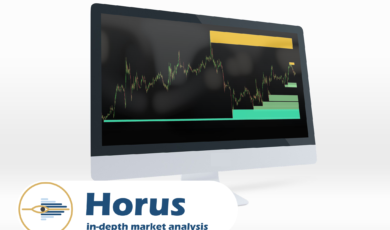
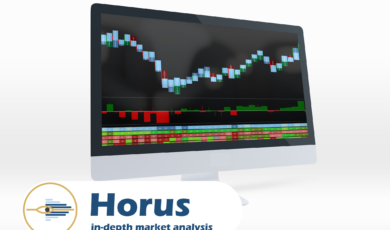
Footprint charts are a type of candlestick chart that provides trade volume information in addition to price. This gives an additional dimension that allows the investor a more in-depth analysis. The footprint chart is a major tool for many professional traders.
What are the features?
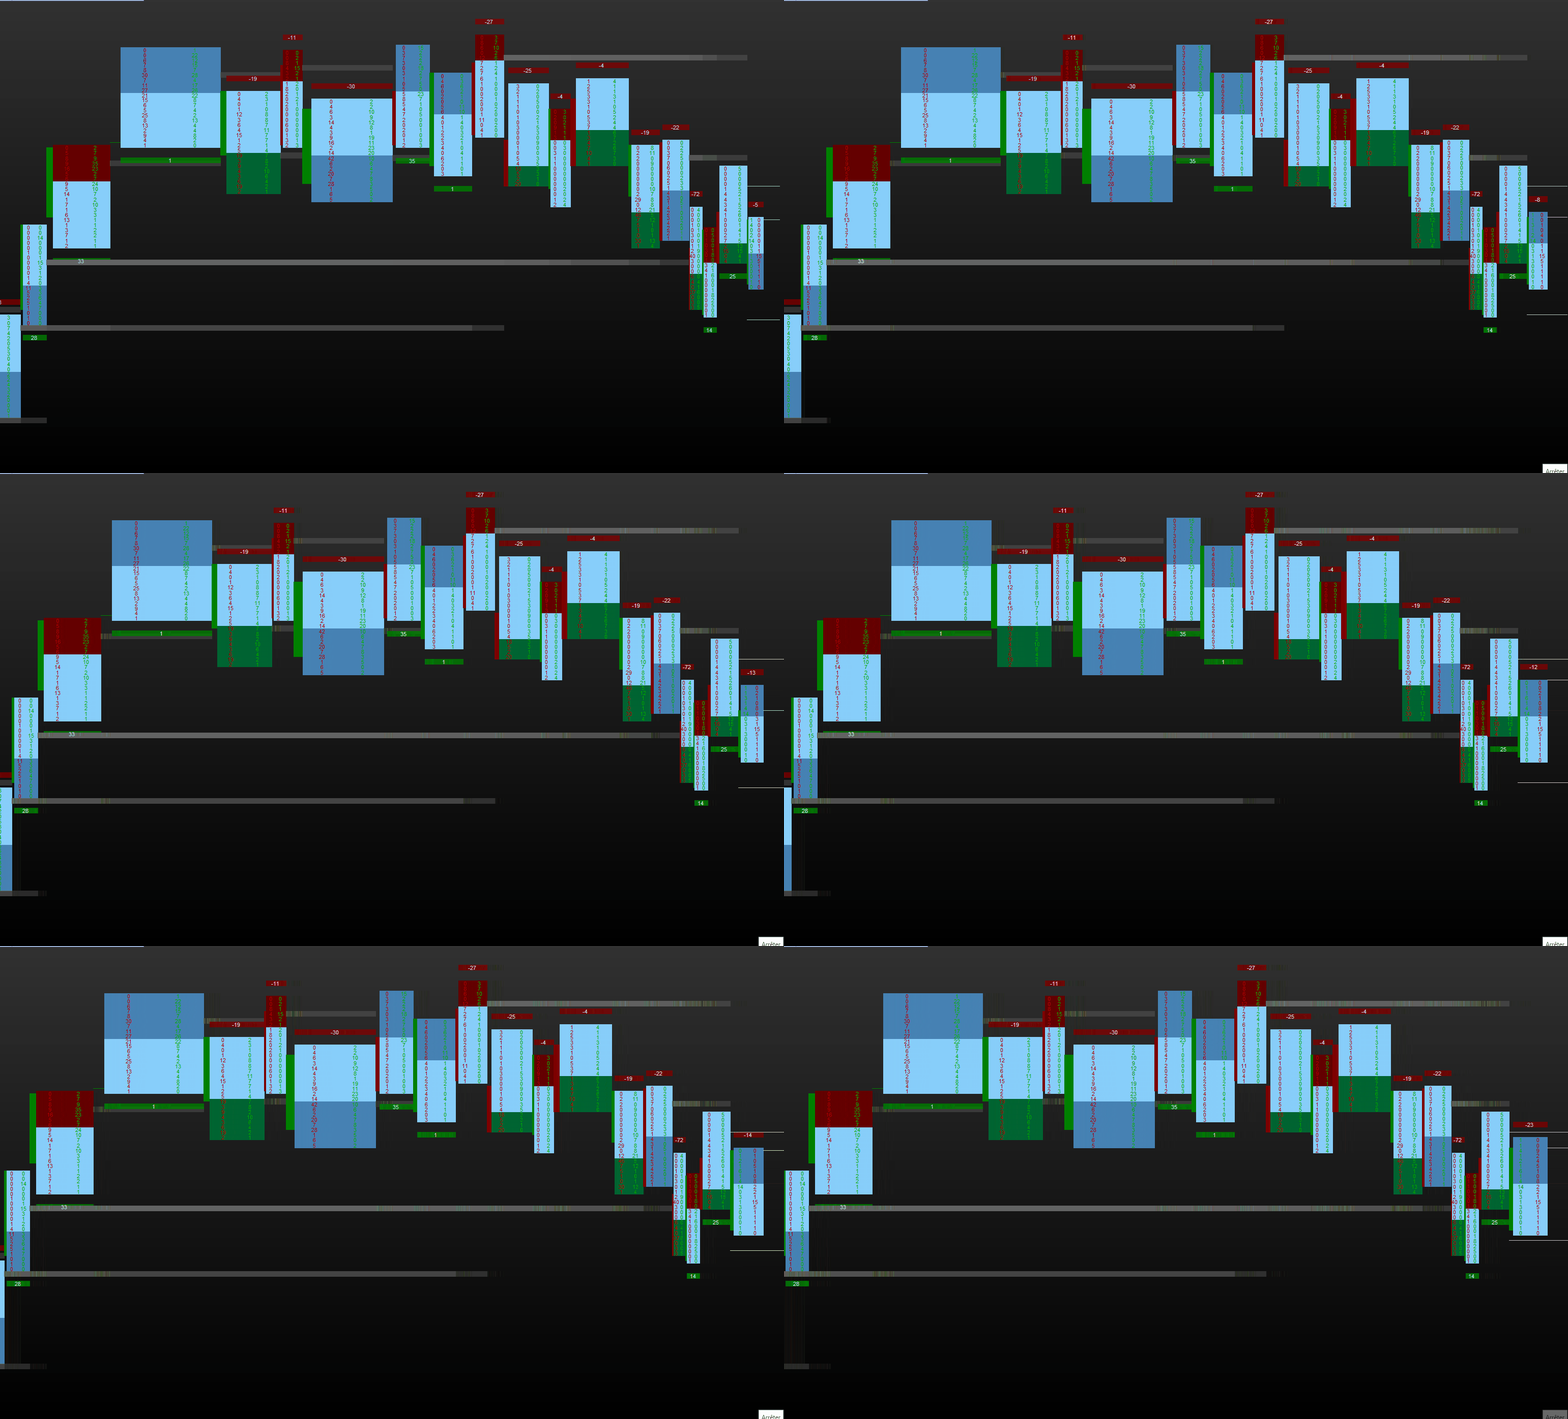
Horus – Footprint :
- Live current candle display
- Tick candle or range bar (New) of your choice
- Number of levels of your choice
- Volume filter
- 5 kinds of volume information that can be displayed :
- Bid/Ask – Sellers and buyers volume are separated
- Volume – Sellers and buyers volume are cumulative
- Only the Buyers volume
- Only the Sellers volume
- Delta between Buyers and Sellers
- 4 kinds of colourization :
- VPOC highlighted
- Median display
- Volume profile display
- Custom Display
- Naked VPOC – display untested vpocs
- Delta Volume the whole candle (New)
- Auction End Display (New)
!!New Update!!
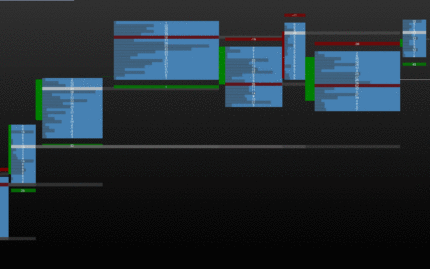
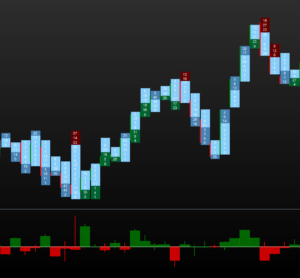
Here Footprint Range bar with Volume Delta and Auction end
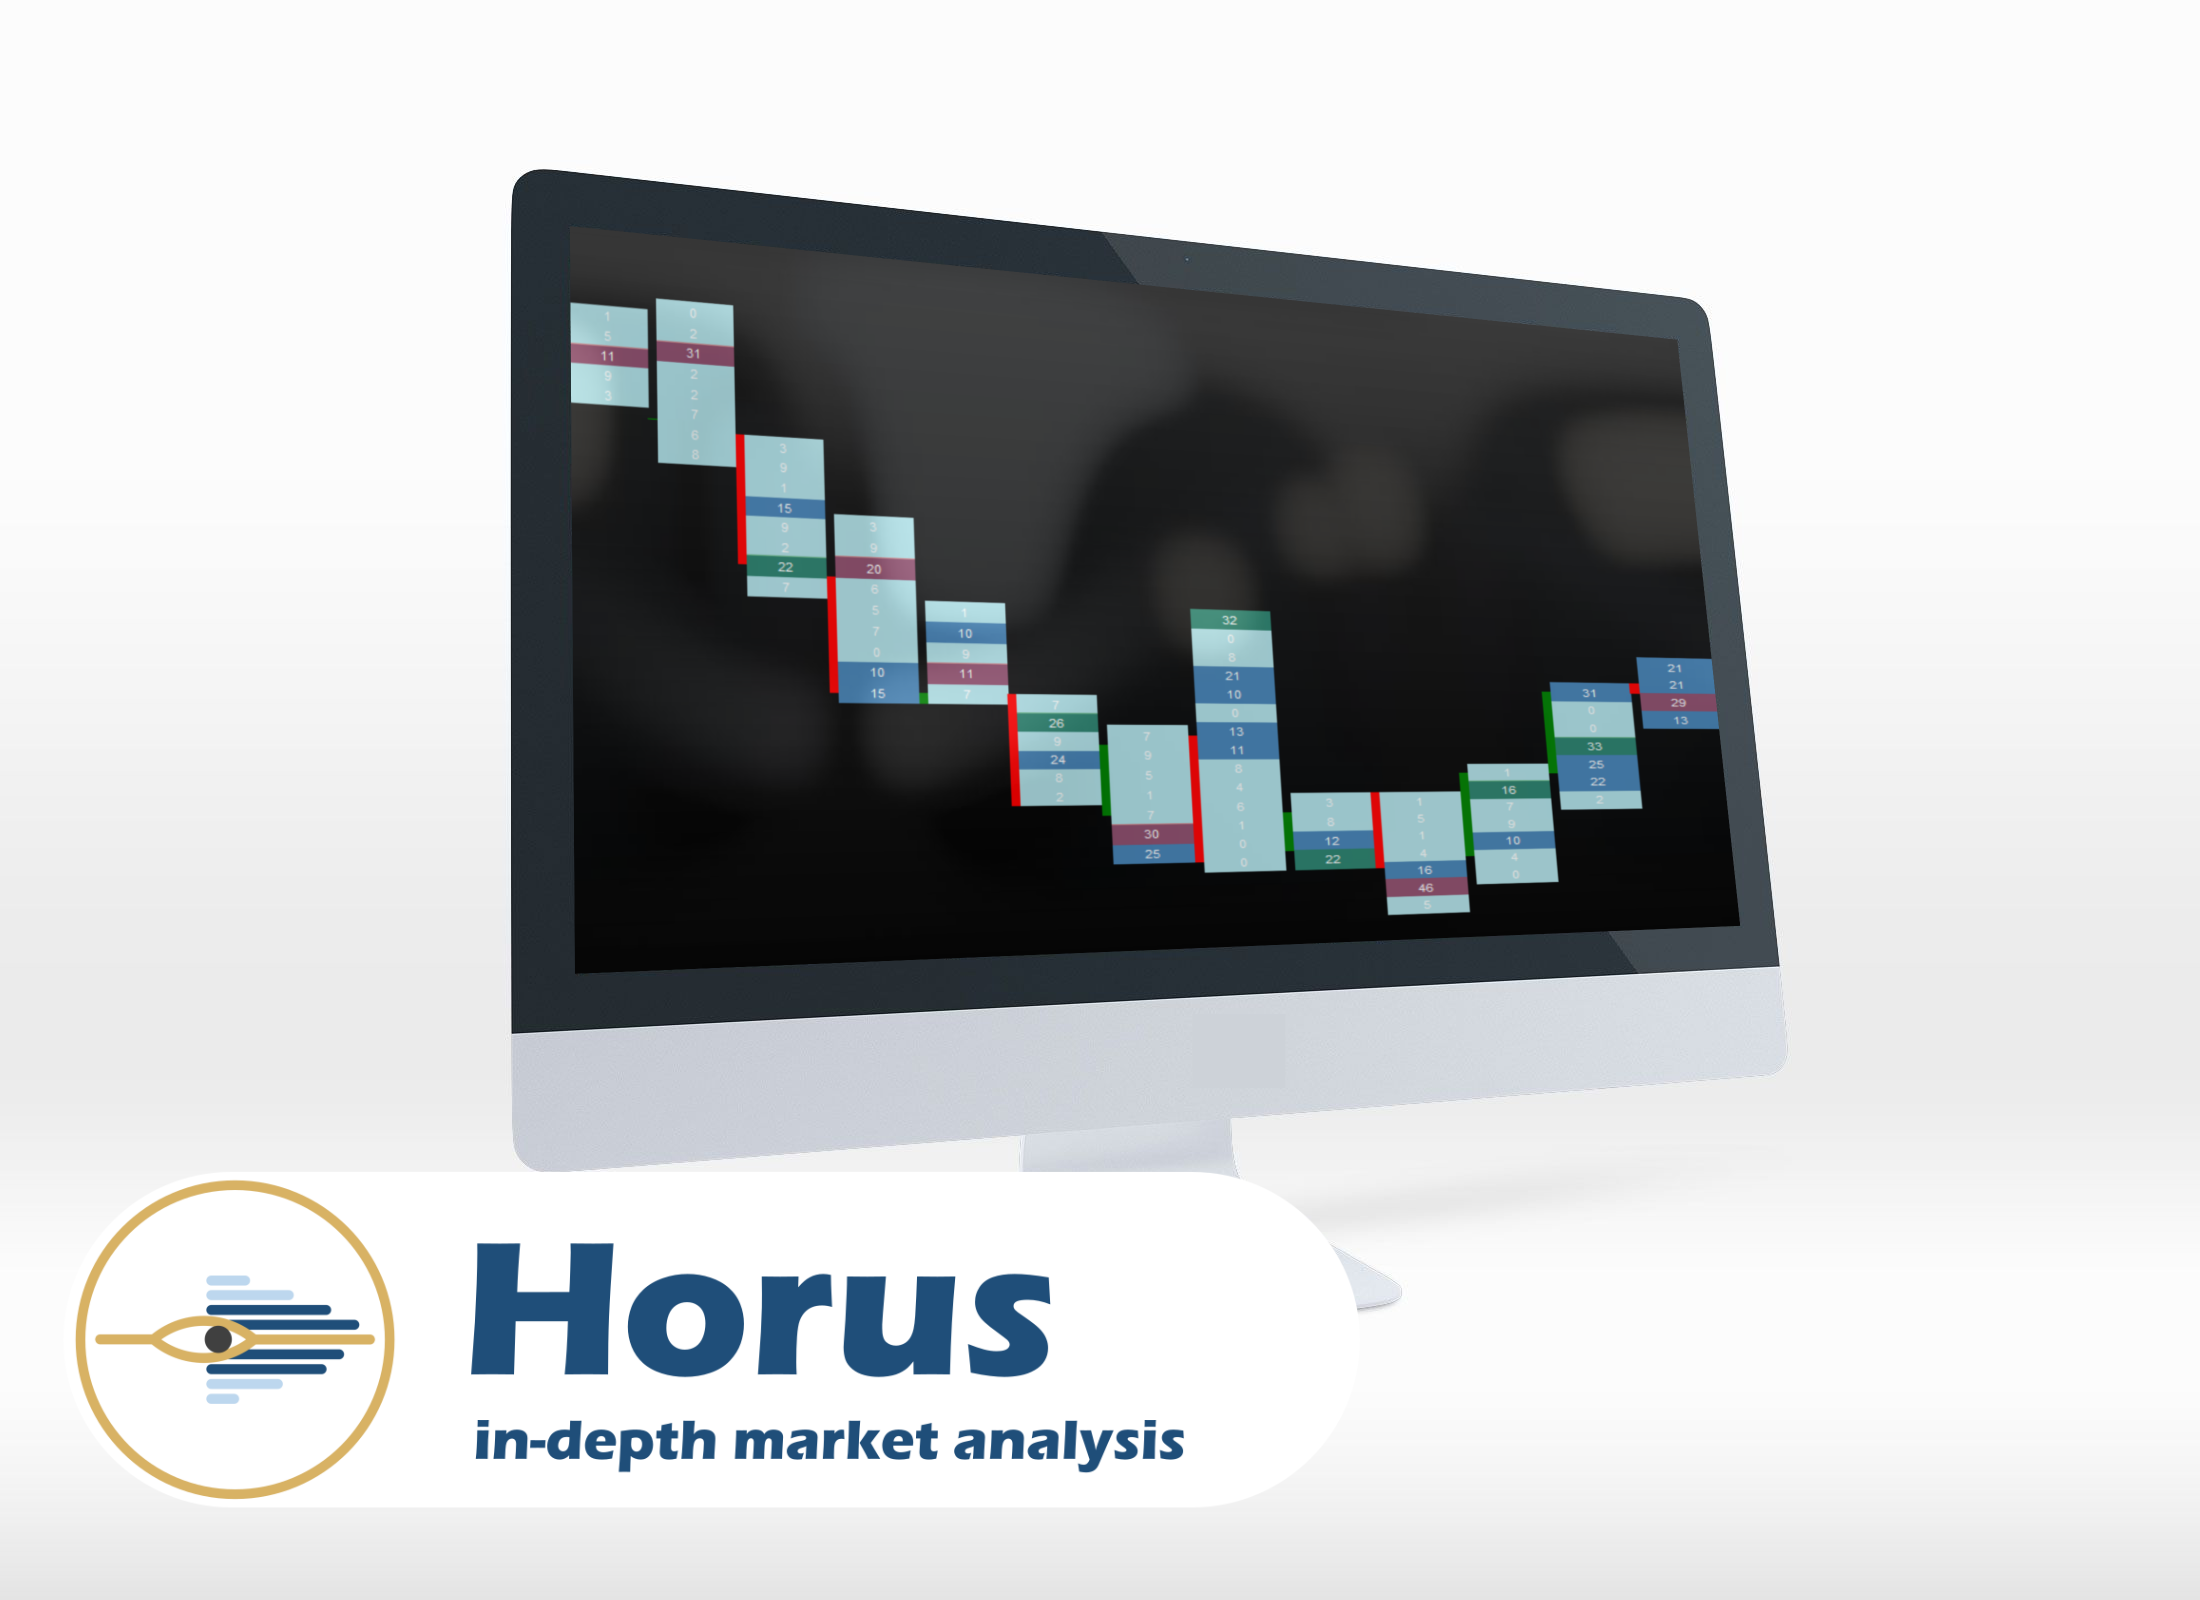
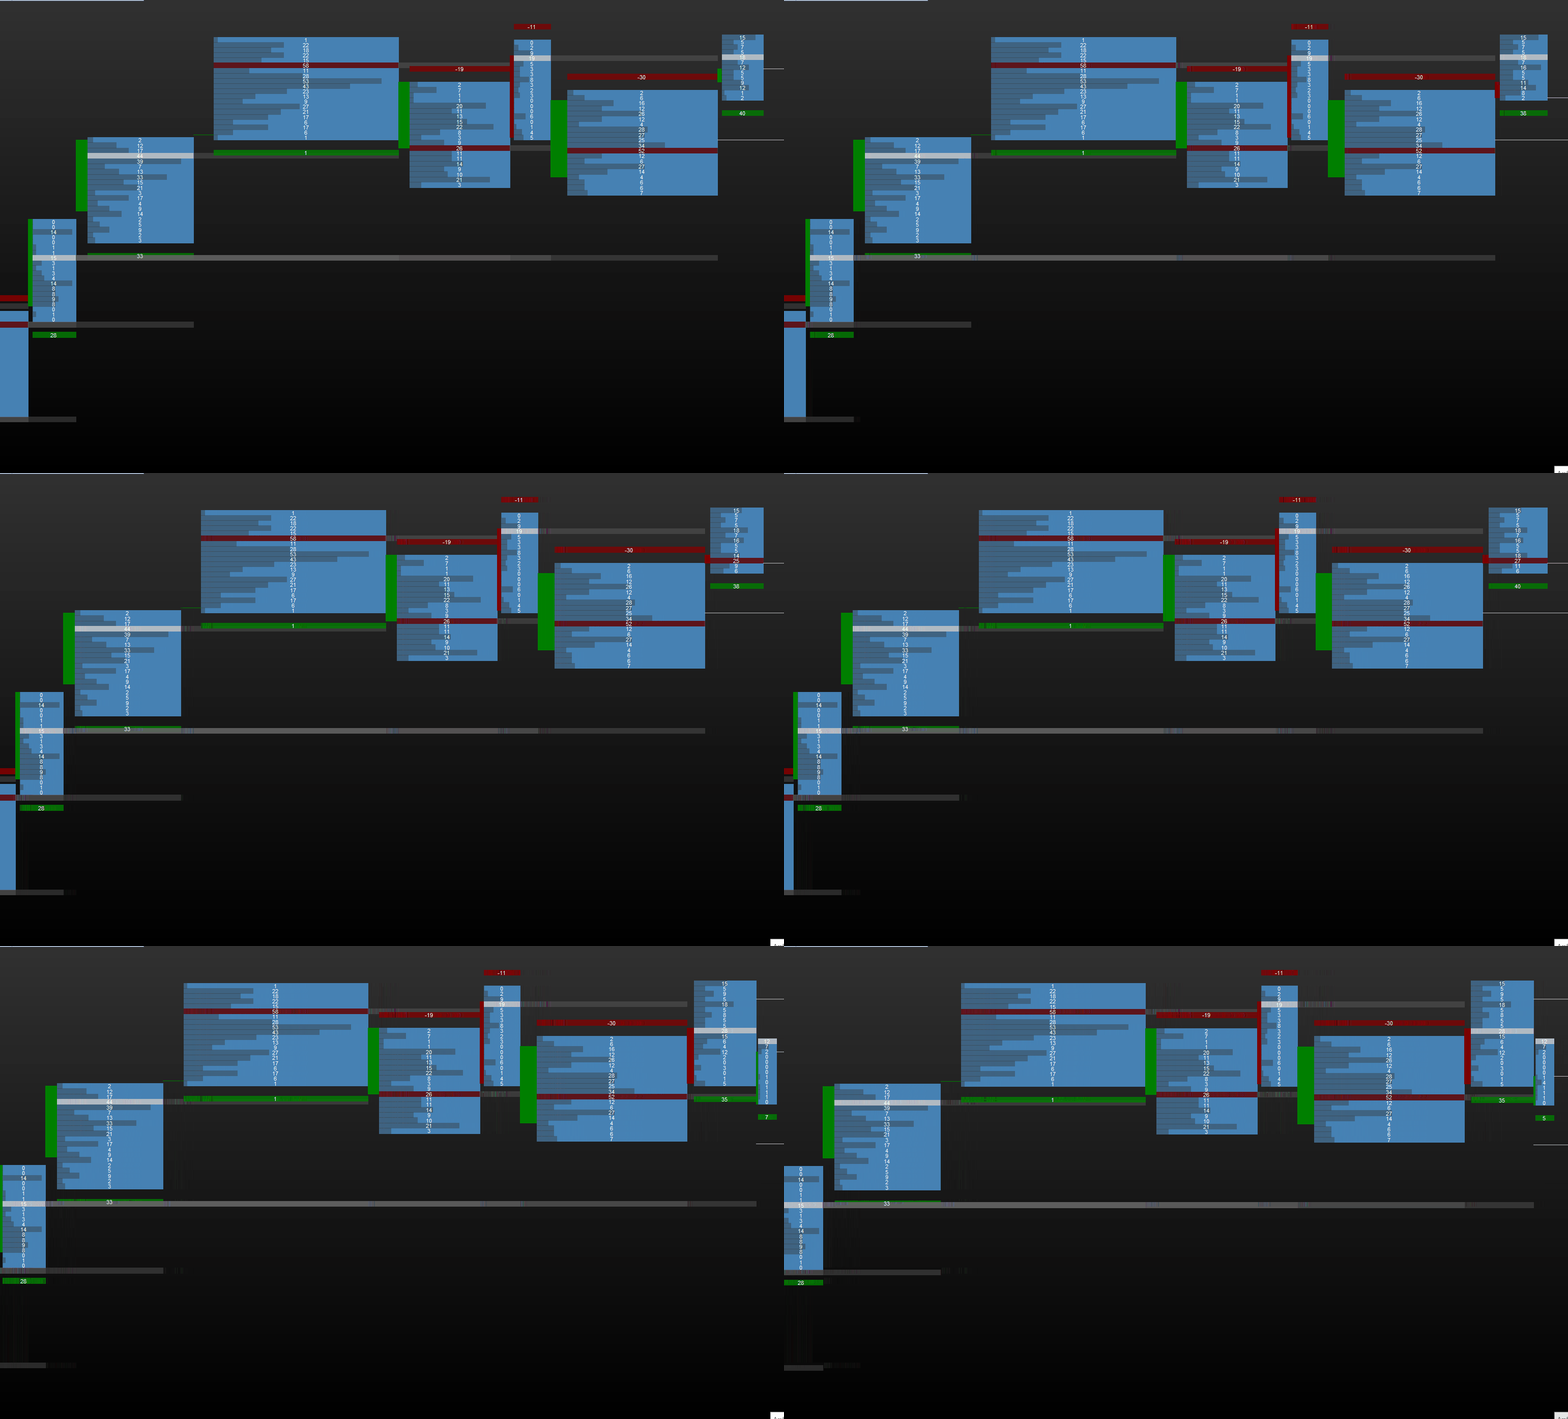
Horus – Statistic :
- Tick candle or range bar (New) of your choice
- Volume filter
- 6 kinds of statistics to display or not (1 to 6 statistics displayed) :
- Volume – Sellers and buyers volume are cumulative
- Only the Buyers volume
- Only the Sellers volume
- Delta between Buyers and Sellers
- Volume Delta with the previous candle
- Speed, the number of seconds the candle lasts
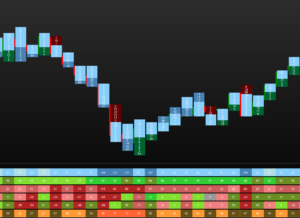
With 6 statistics
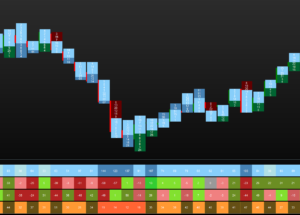
With 4 statistics
Horus – Volume Delta :
- Tick candle or range bar (New) of your choice
- Volume filter
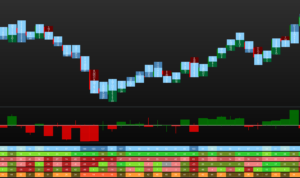
Full environment



bpater79 (propietario verificado) –
Funciona realmente bien. Muy contento con este plugin.
carl-wright (propietario verificado) –
habría sido más alto si la tabla de estadísticas tenía etiquetas. pero en general un buen producto con buena información y pantallas claras
arpenagos (propietario verificado) –
Excelente complemento para toma de decisiones, brinda información detallada que no es posible encontrar con otras herramientas.
chris_blu (propietario verificado) –
Hola, un gran programa con el que estoy muy contento. Hay un montón de diferentes configuraciones y filtros, algunos únicos para esto por lo que necesita para tomar su tiempo y estudio. Usted puede ir hacia atrás en el tiempo en plazos más altos para ver cómo reversals/breakouts/fake outs/trends etc mirada en los diversos ajustes disponibles. ¡Es una adición permanente a mis gráficos que da un nivel adicional de confirmación de las barras de precios no pueden ofrecer por sí mismos, así como ayudar a apretar las paradas detrás de las impresiones bajas!