
 INSTALLATION

What Are Footprint Charts?
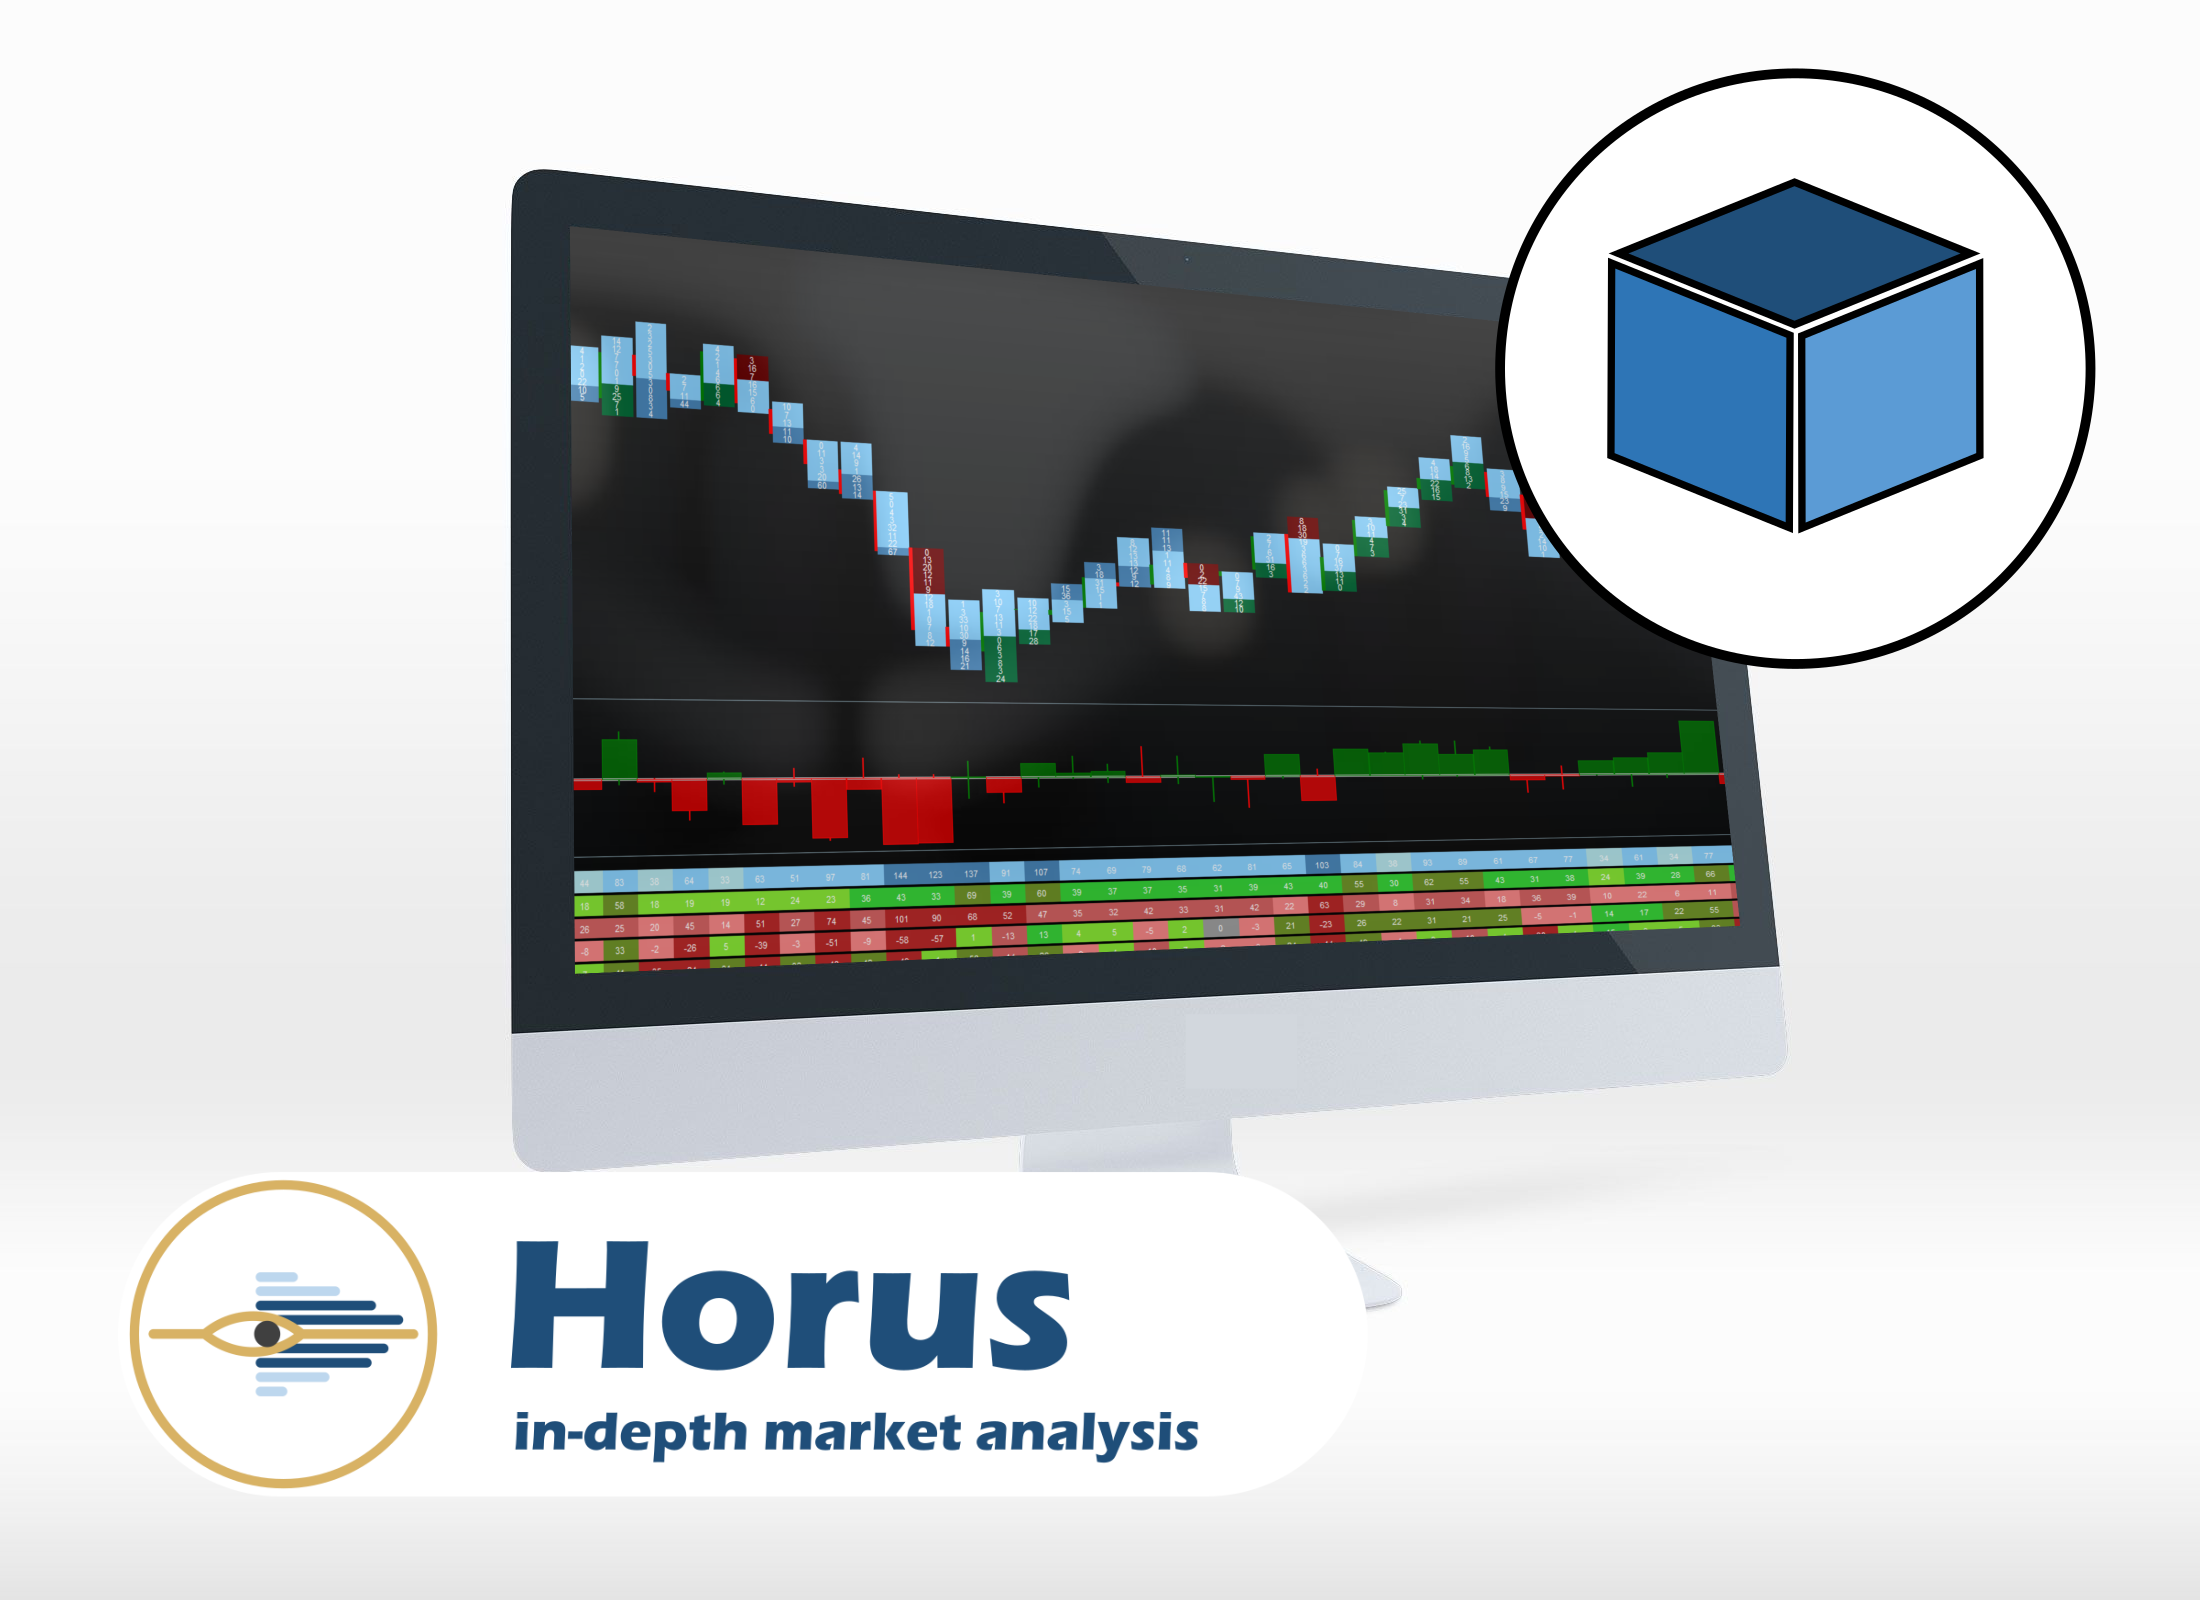
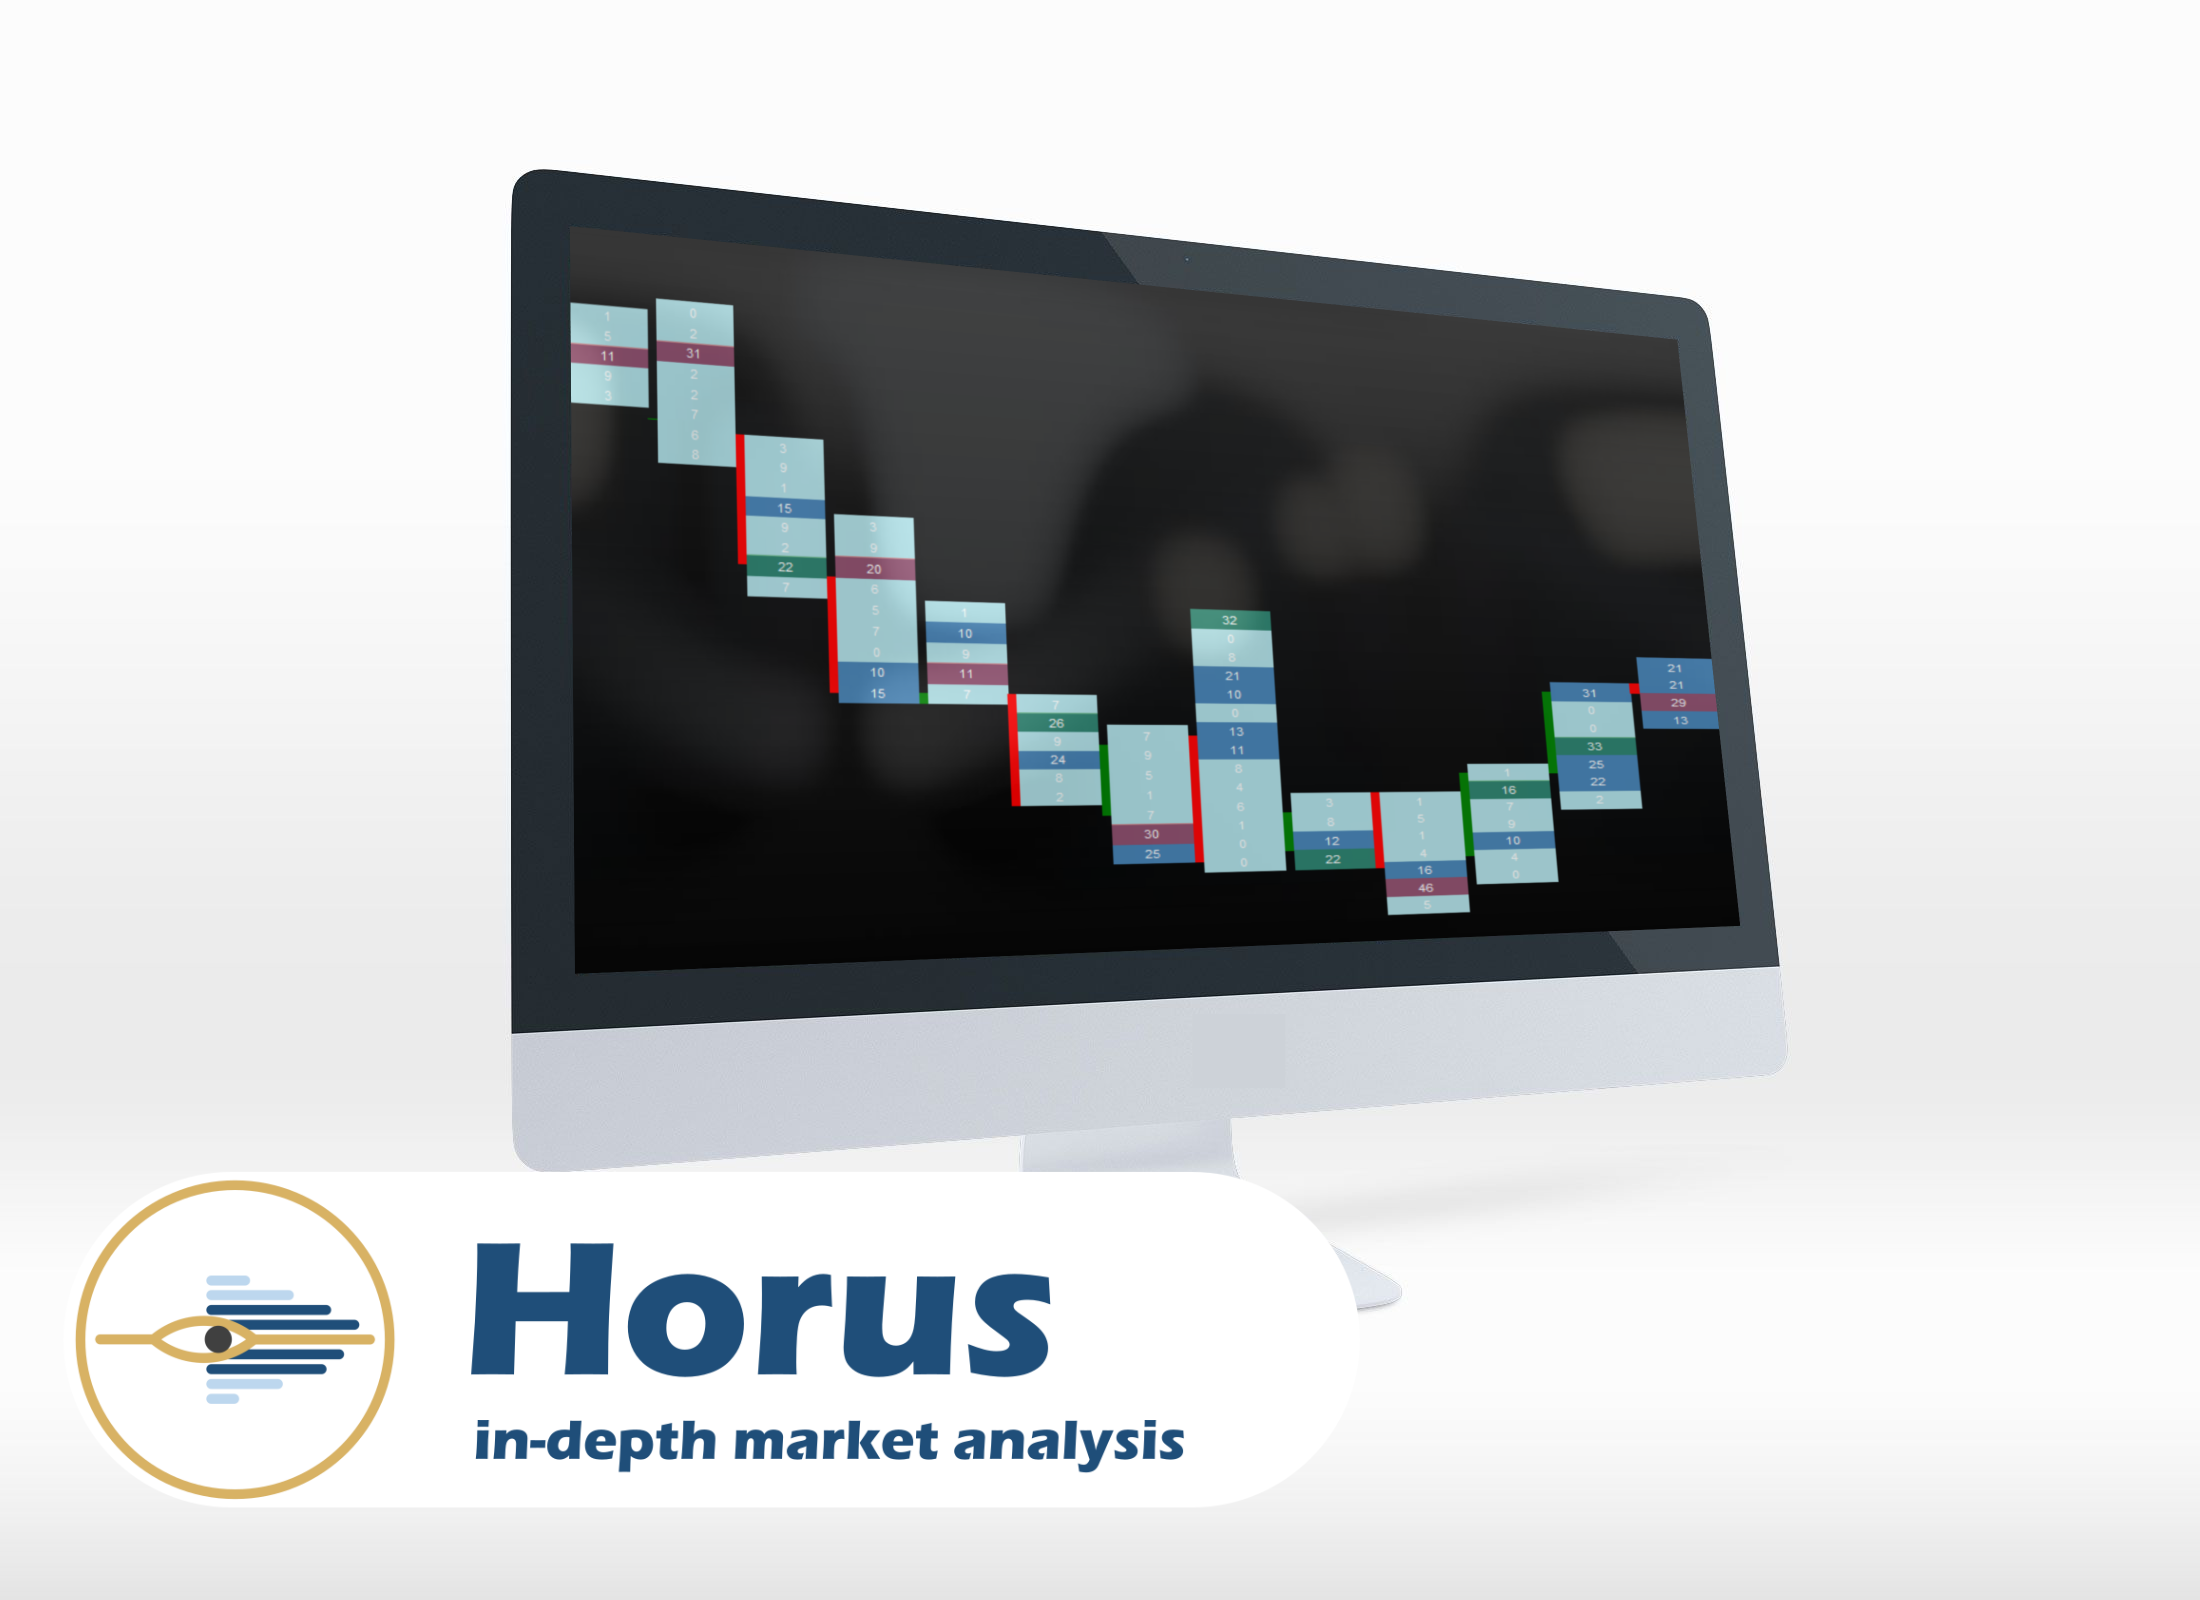
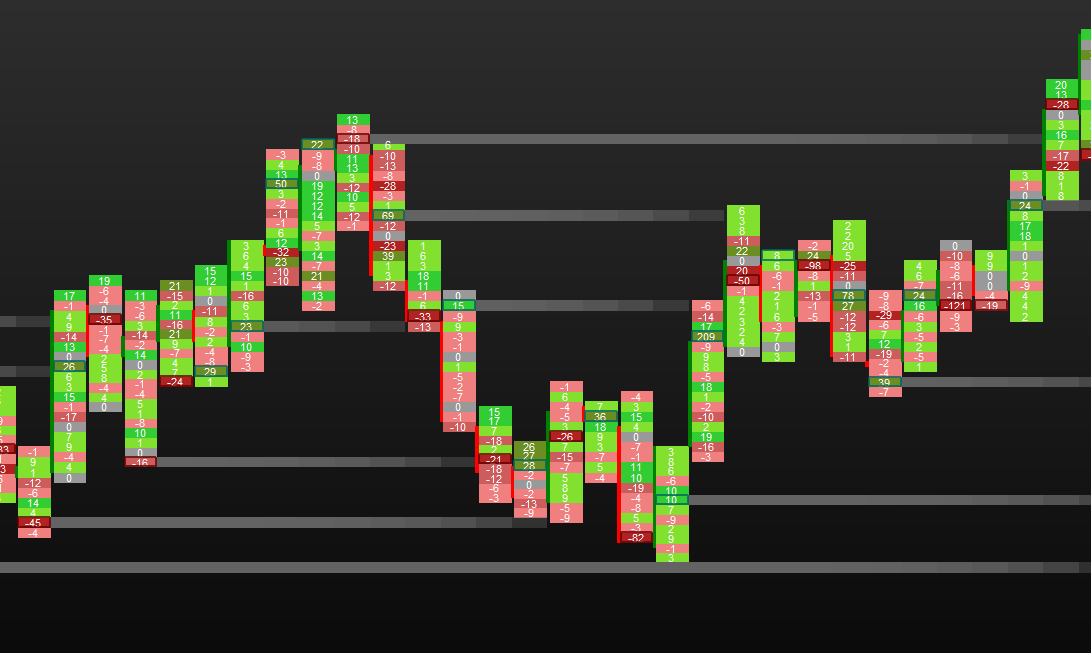
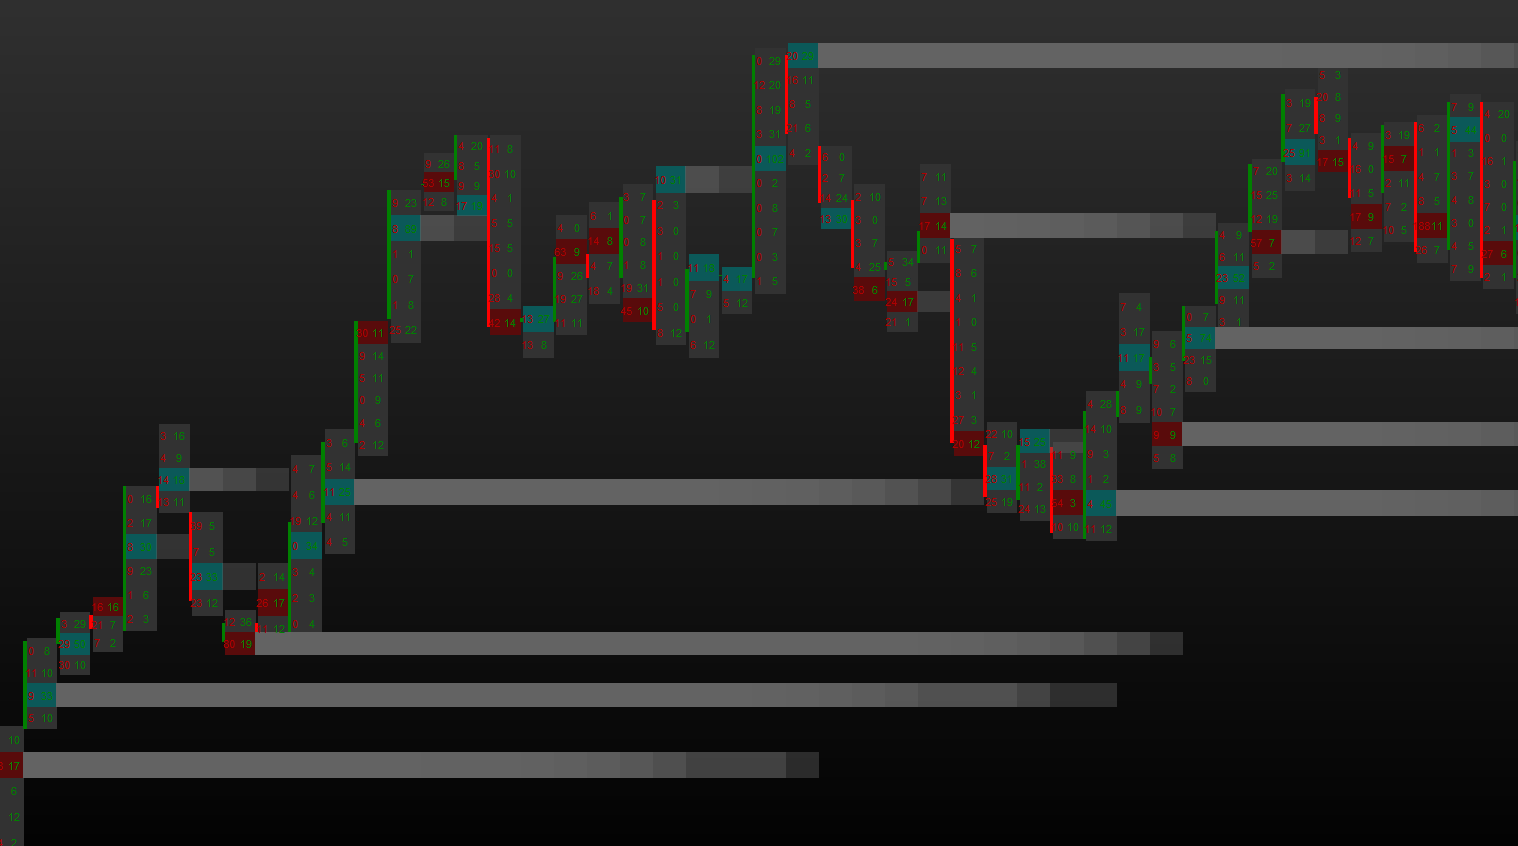
Footprint charts are a type of candlestick chart that provides trade volume information in addition to price. This gives an additional dimension that allows the investor a more in-depth analysis. The footprint chart is a major tool for many professional traders.
What are the features?
Horus – Footprint :
- Live current candle display
- Tick candle or range bar (New) of your choice
- Number of levels of your choice
- Volume filter
- 5 kinds of volume information that can be displayed :
- Bid/Ask – Sellers and buyers volume are separated
- Volume – Sellers and buyers volume are cumulative
- Only the Buyers volume
- Only the Sellers volume
- Delta between Buyers and Sellers
- 4 kinds of colourization :
- VPOC highlighted
- Median display
- Volume profile display
- Custom Display
- Naked VPOC – display untested vpocs
- Delta Volume the whole candle (New)
- Auction End Display (New)
!!New Update!!
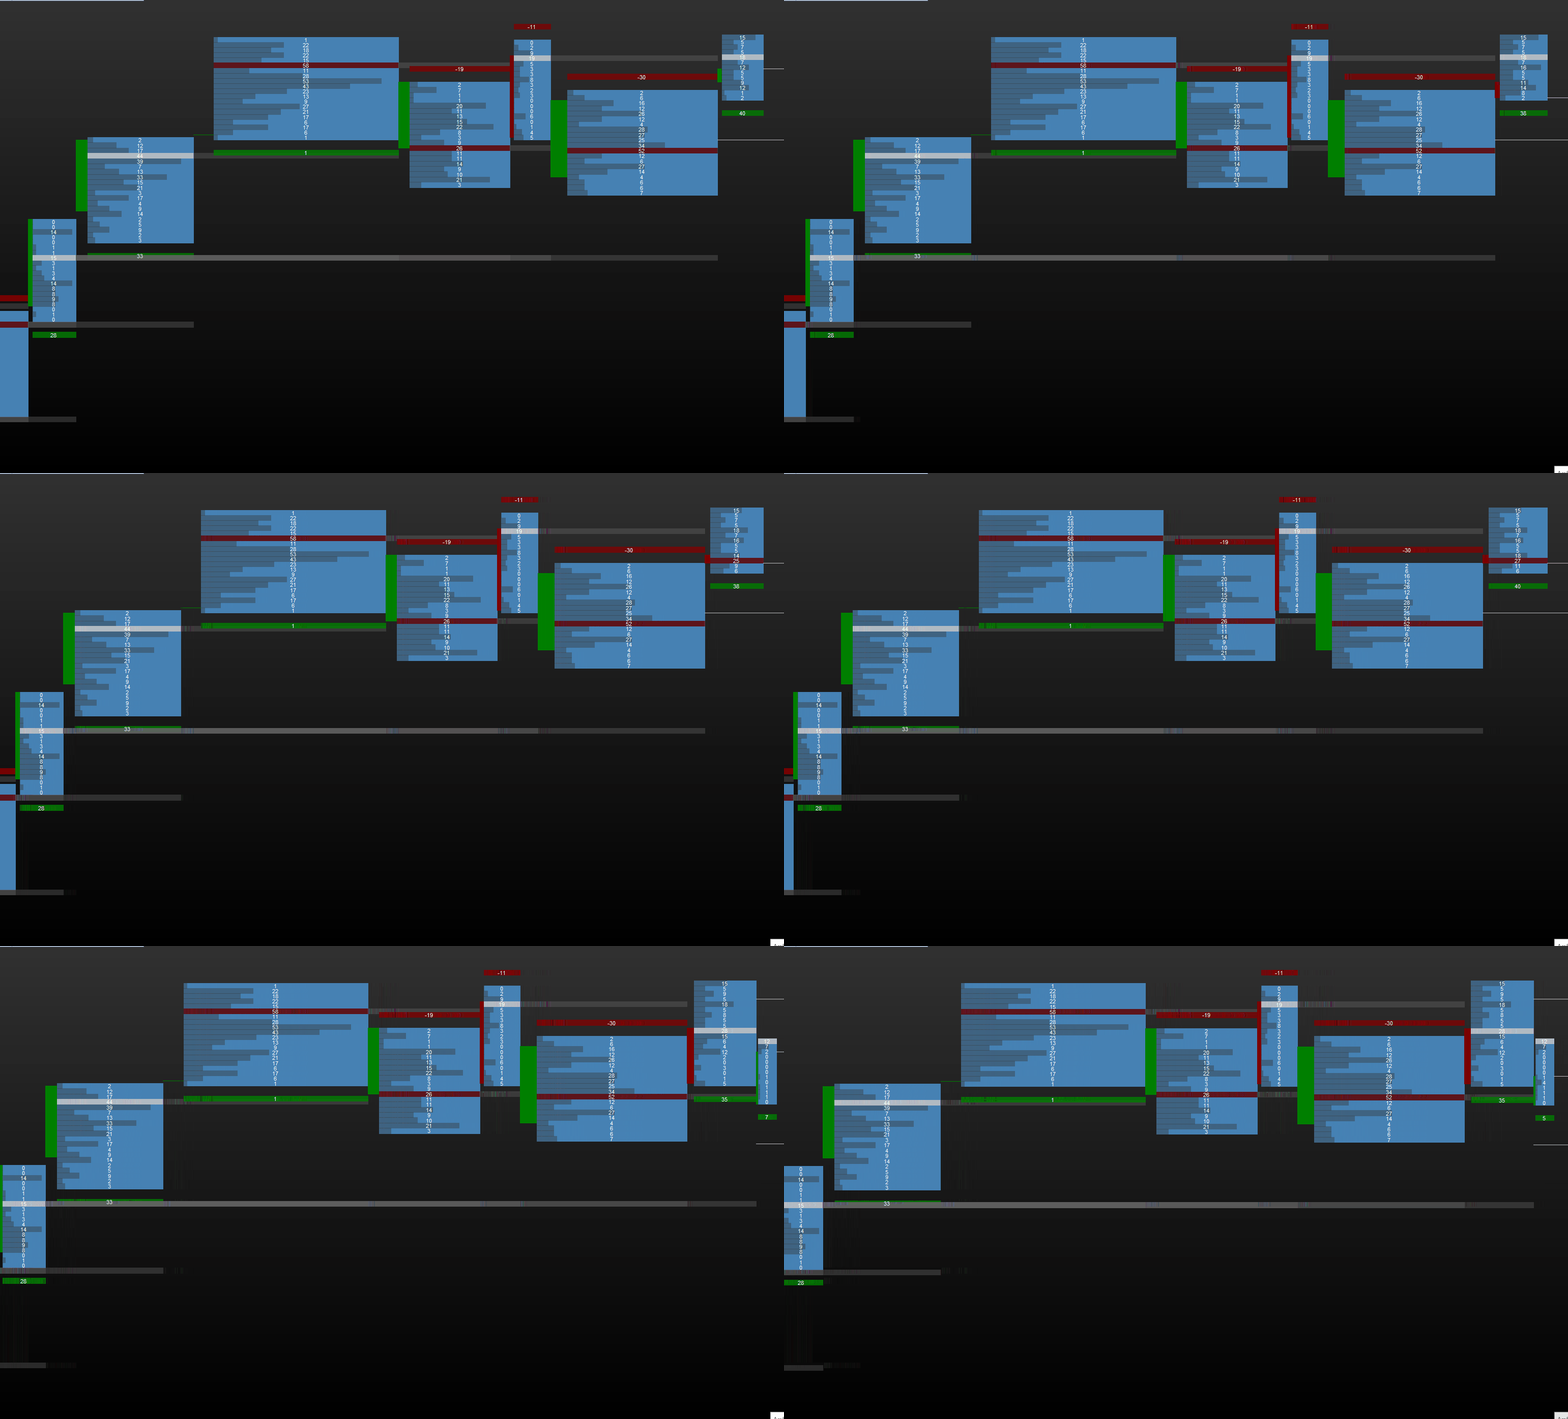
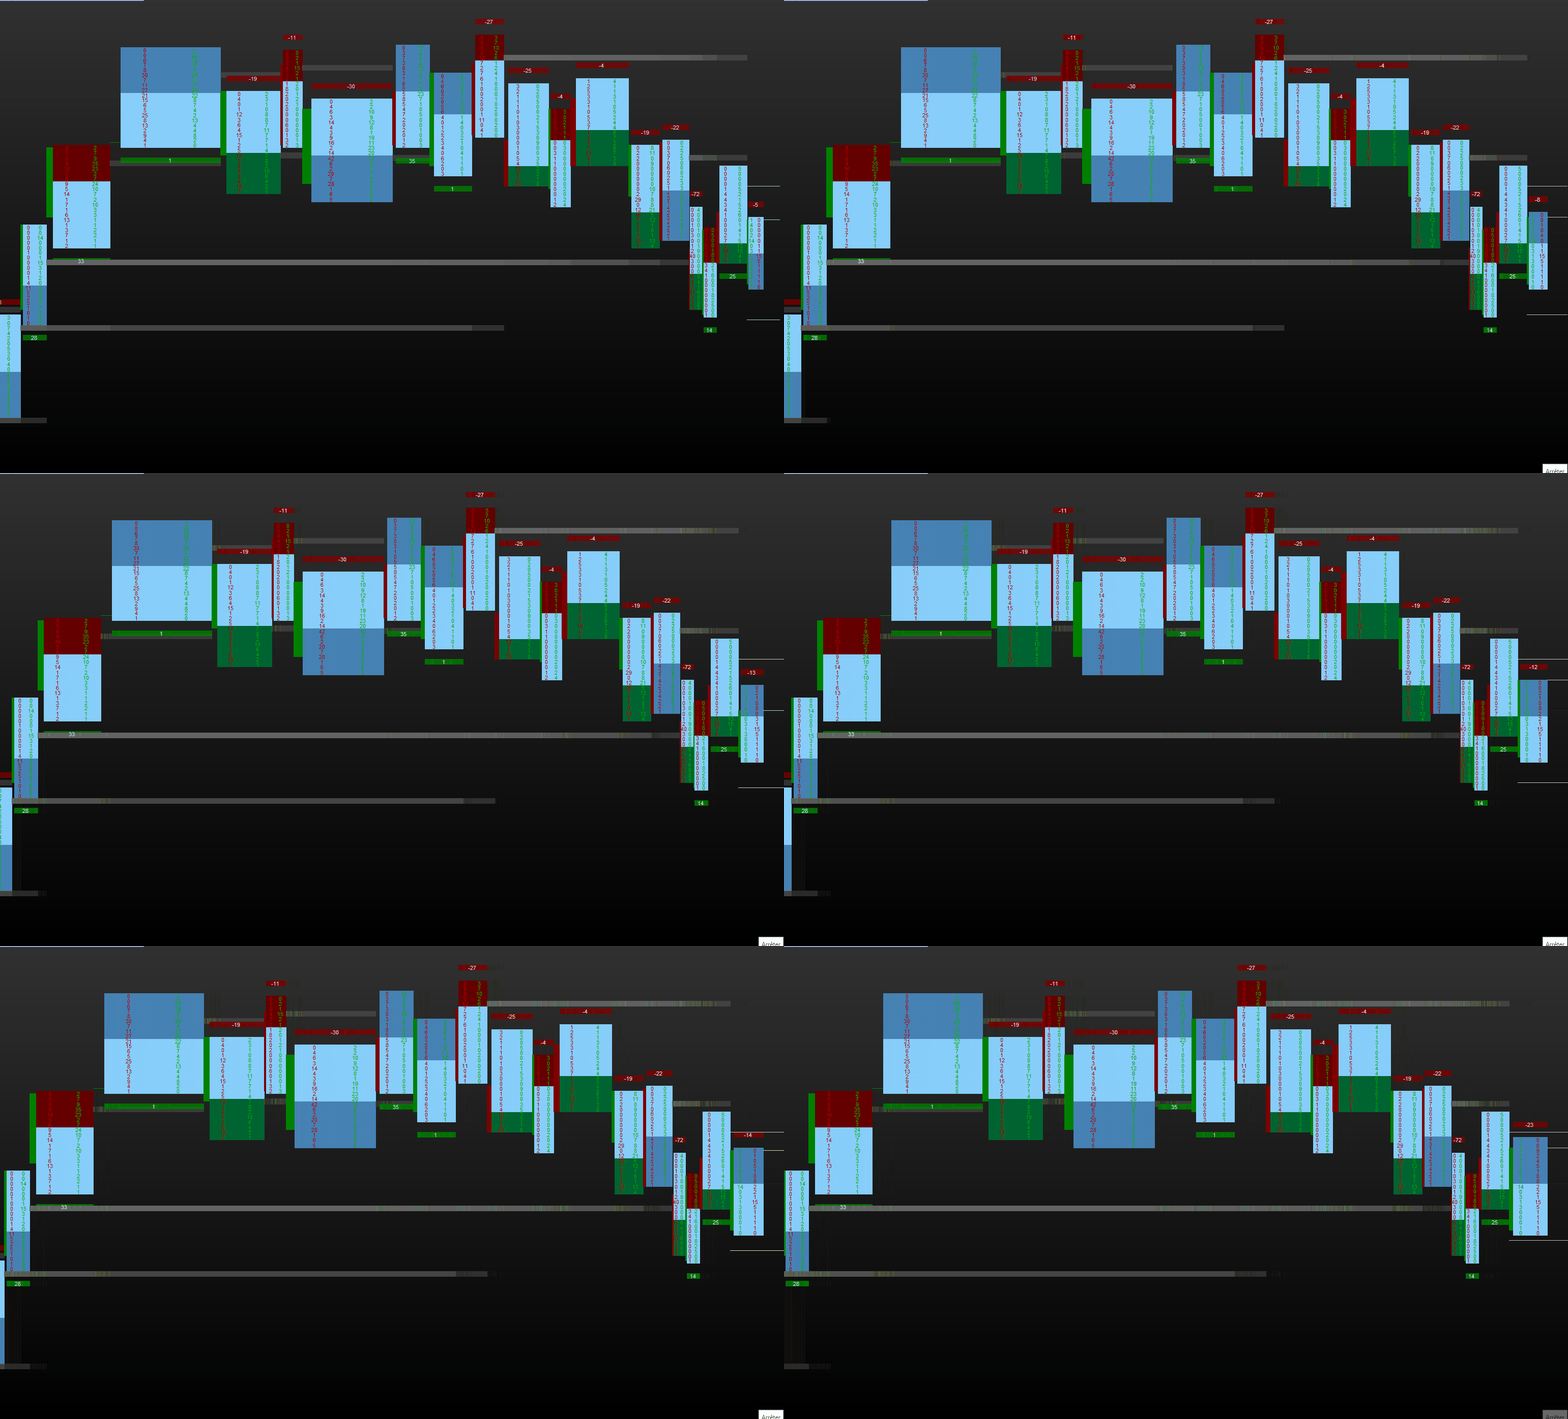
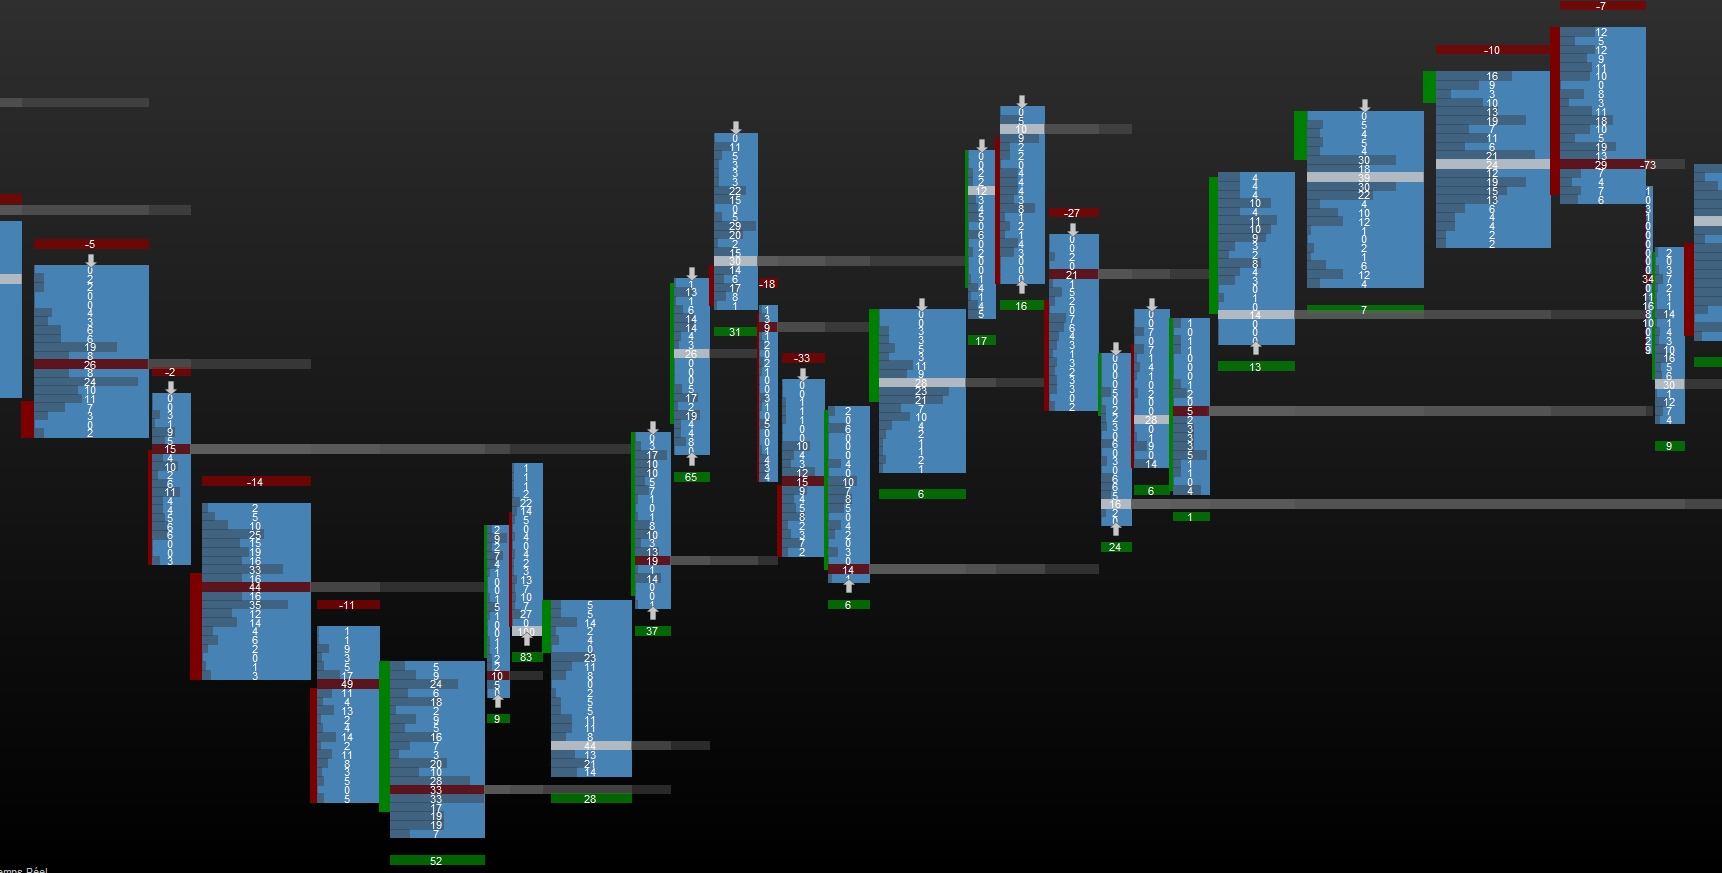
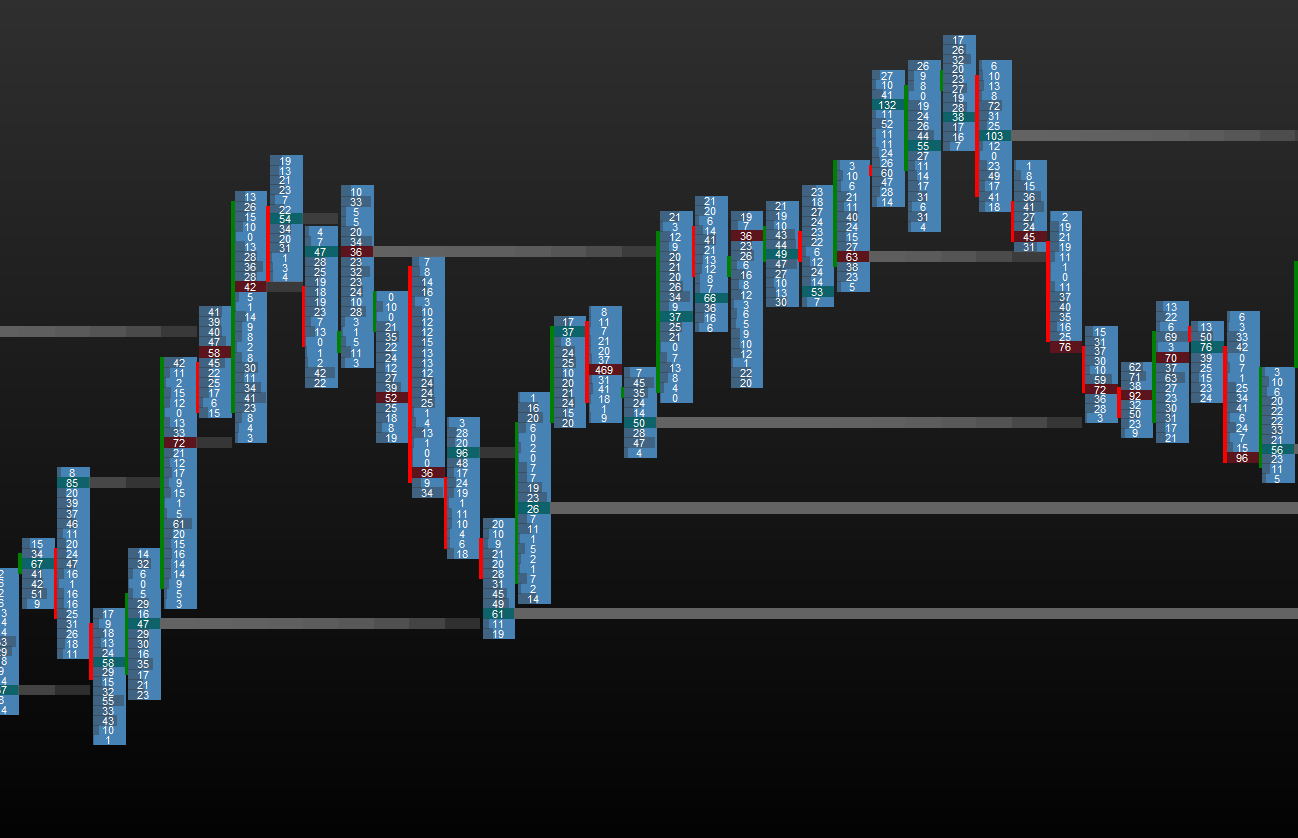
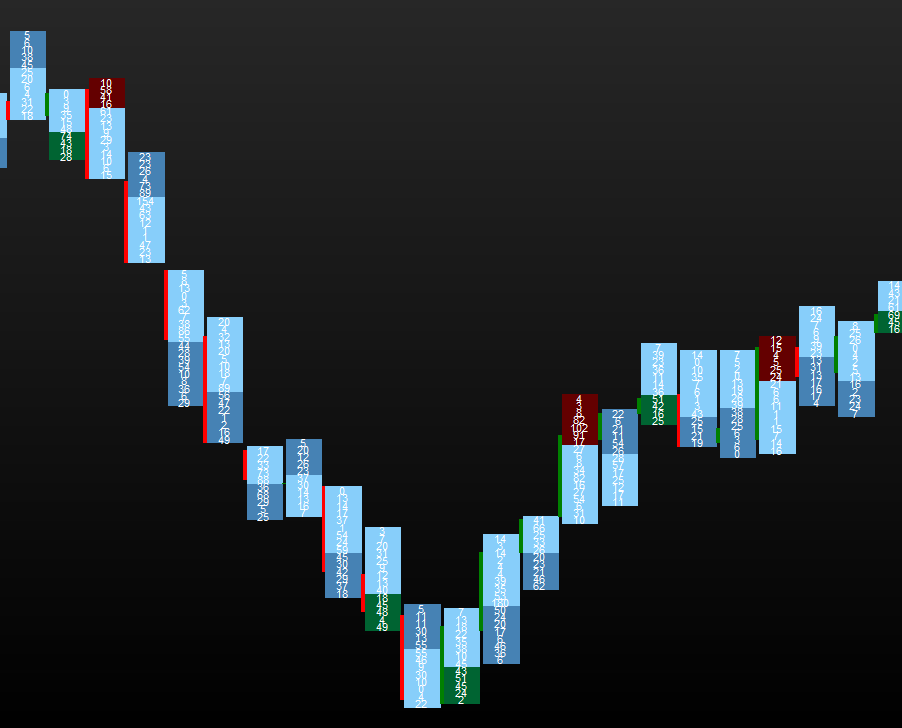
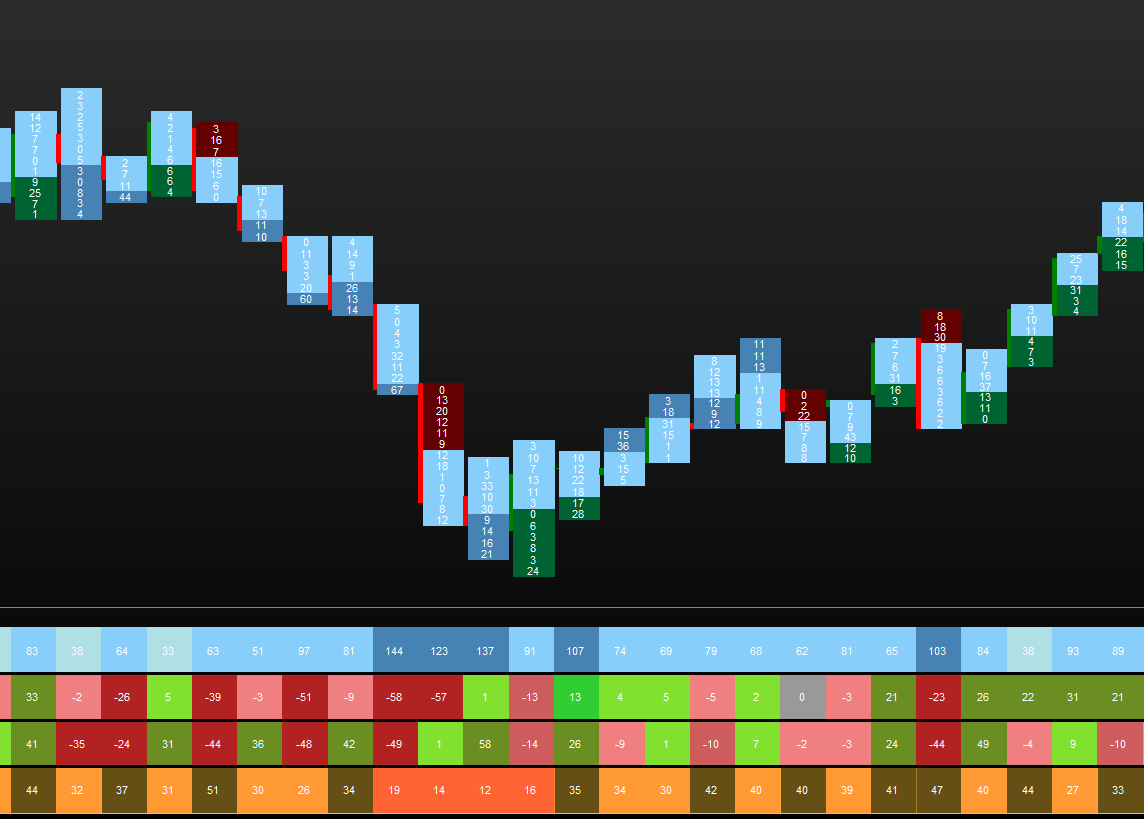
Here Footprint Range bar with Volume Delta and Auction end
Horus – Statistic :
- Tick candle or range bar (New) of your choice
- Volume filter
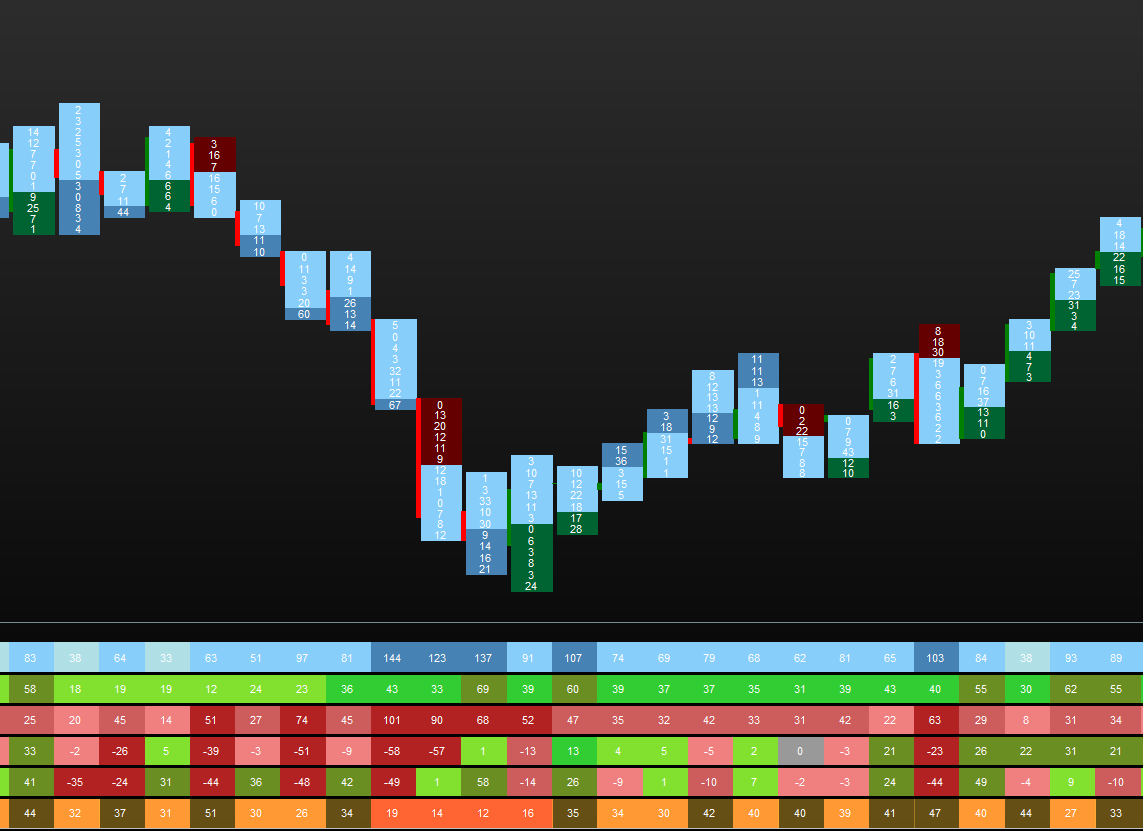
- 6 kinds of statistics to display or not (1 to 6 statistics displayed) :
- Volume – Sellers and buyers volume are cumulative
- Only the Buyers volume
- Only the Sellers volume
- Delta between Buyers and Sellers
- Volume Delta with the previous candle
- Speed, the number of seconds the candle lasts
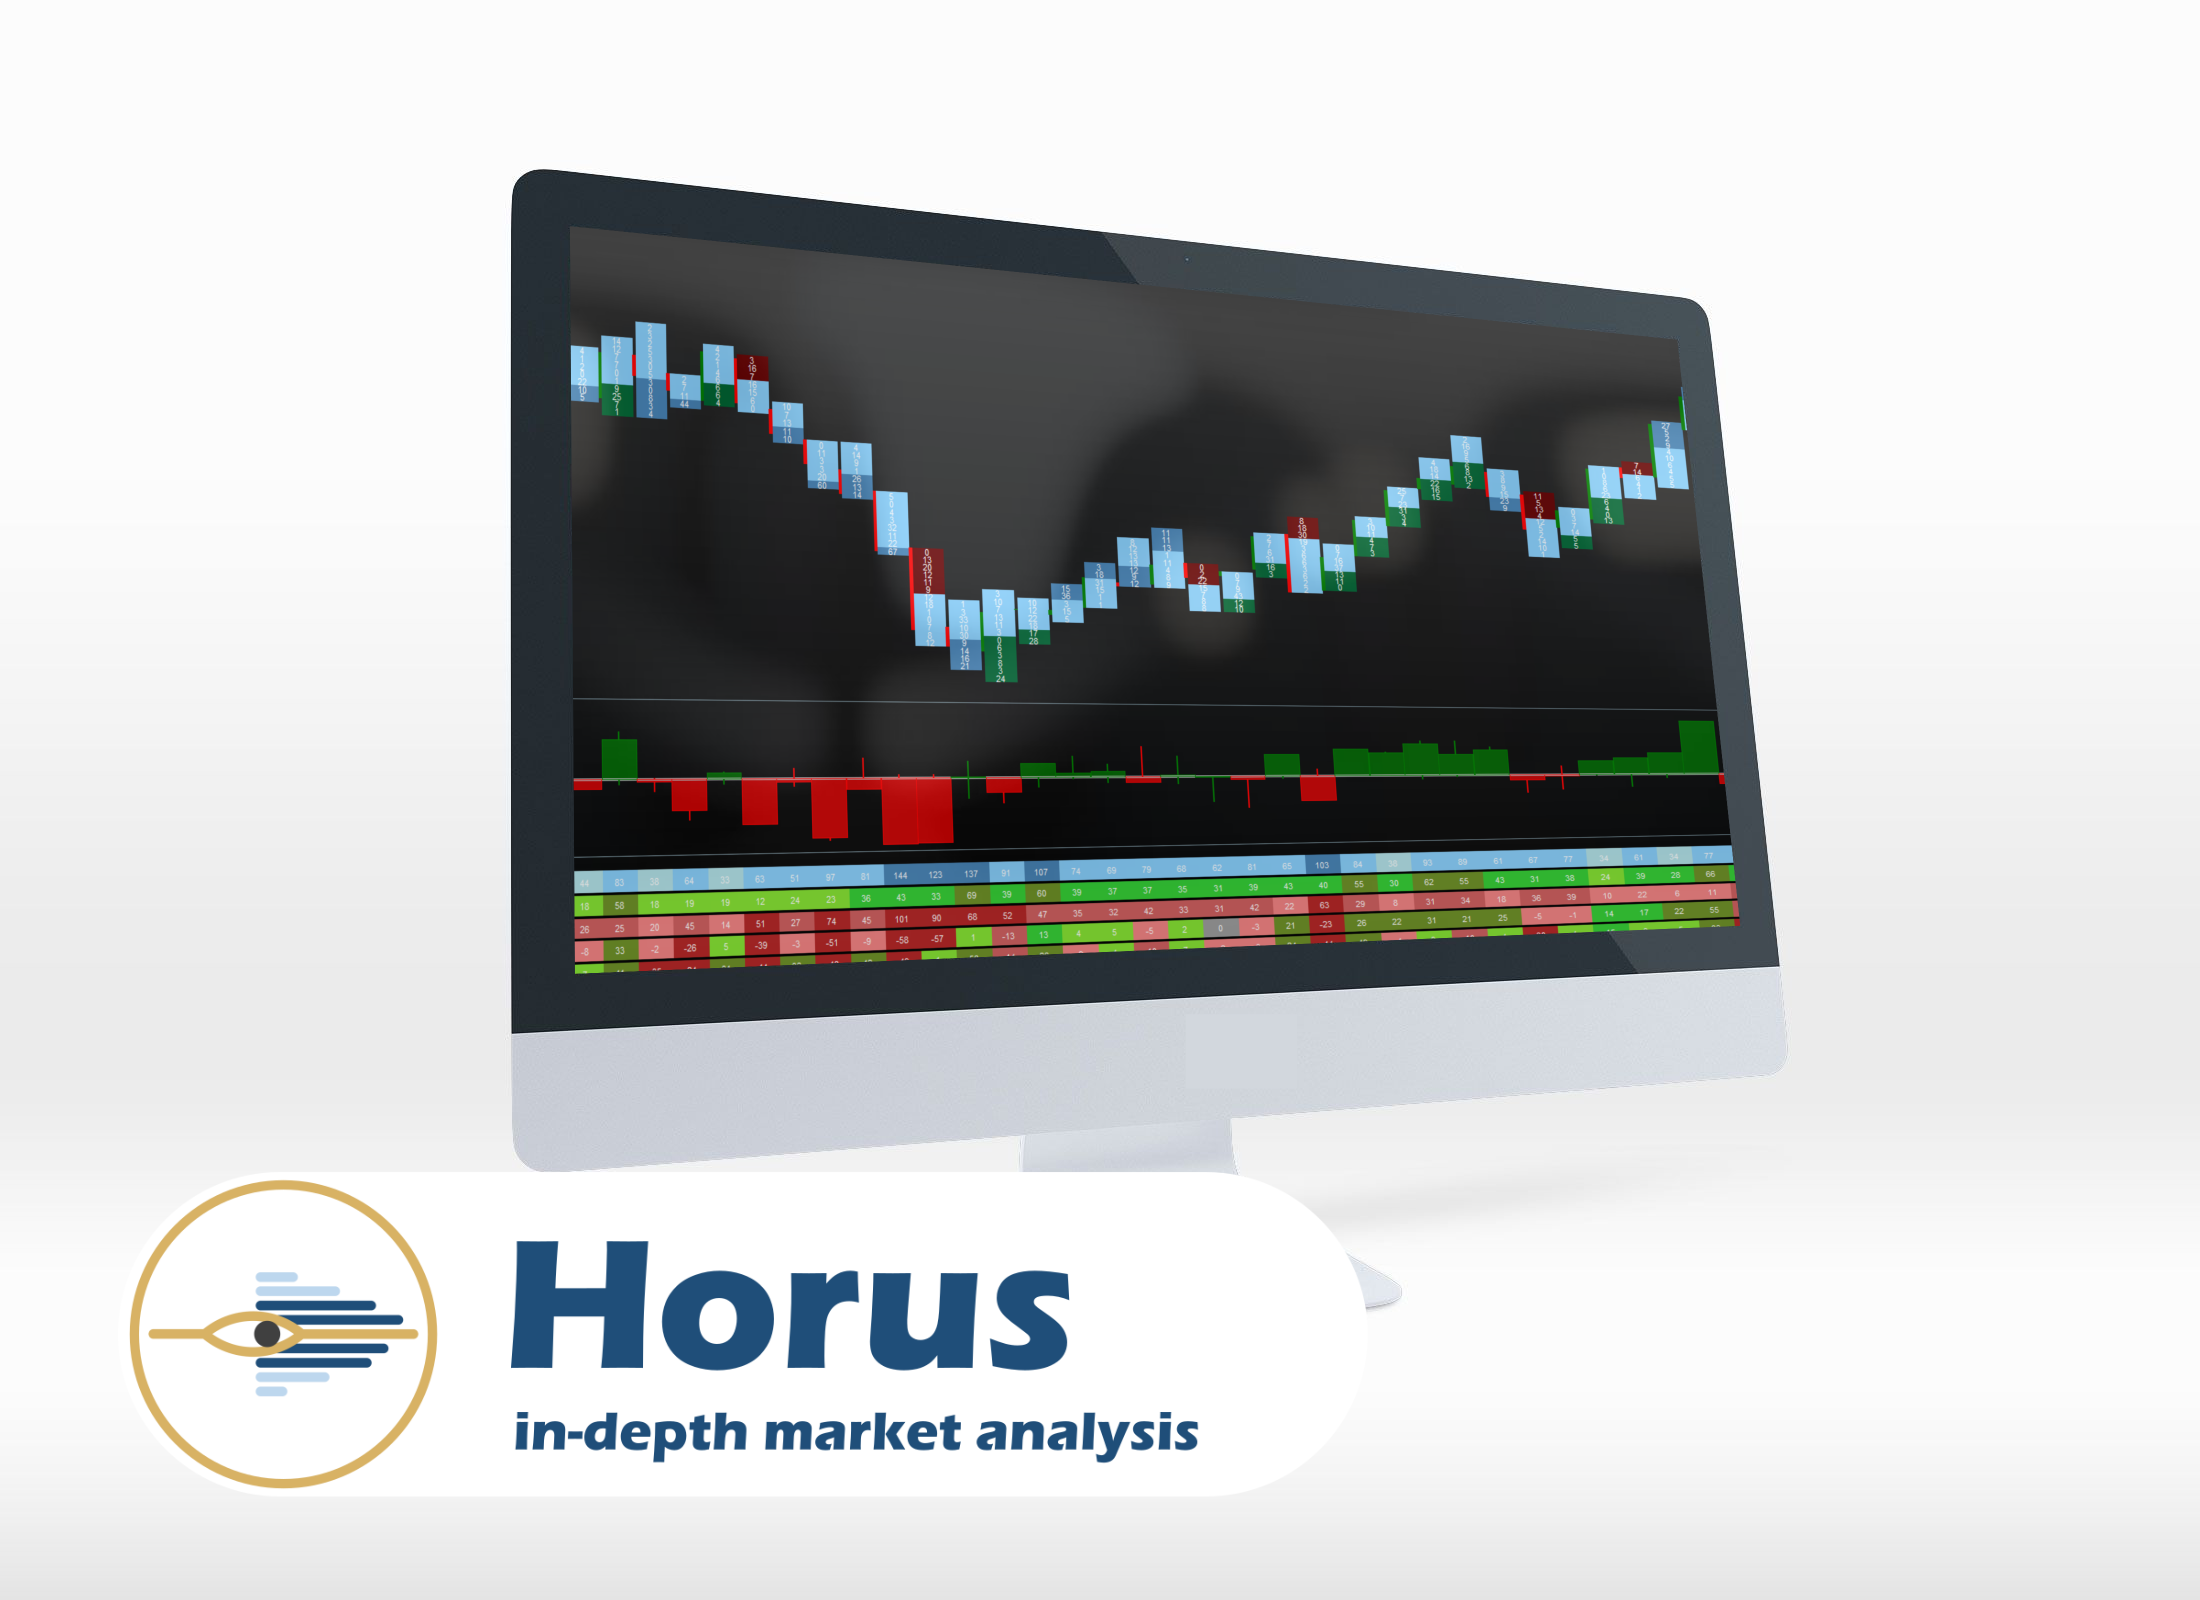
With 6 statistics
With 4 statistics
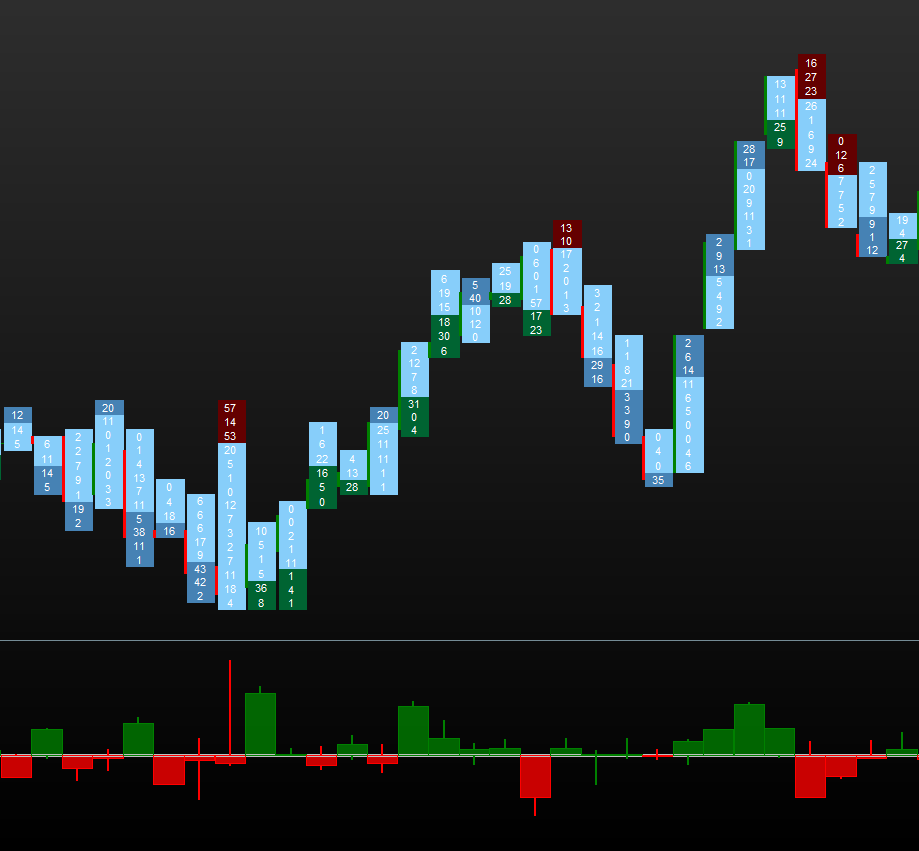
Horus – Volume Delta :
- Tick candle or range bar (New) of your choice
- Volume filter
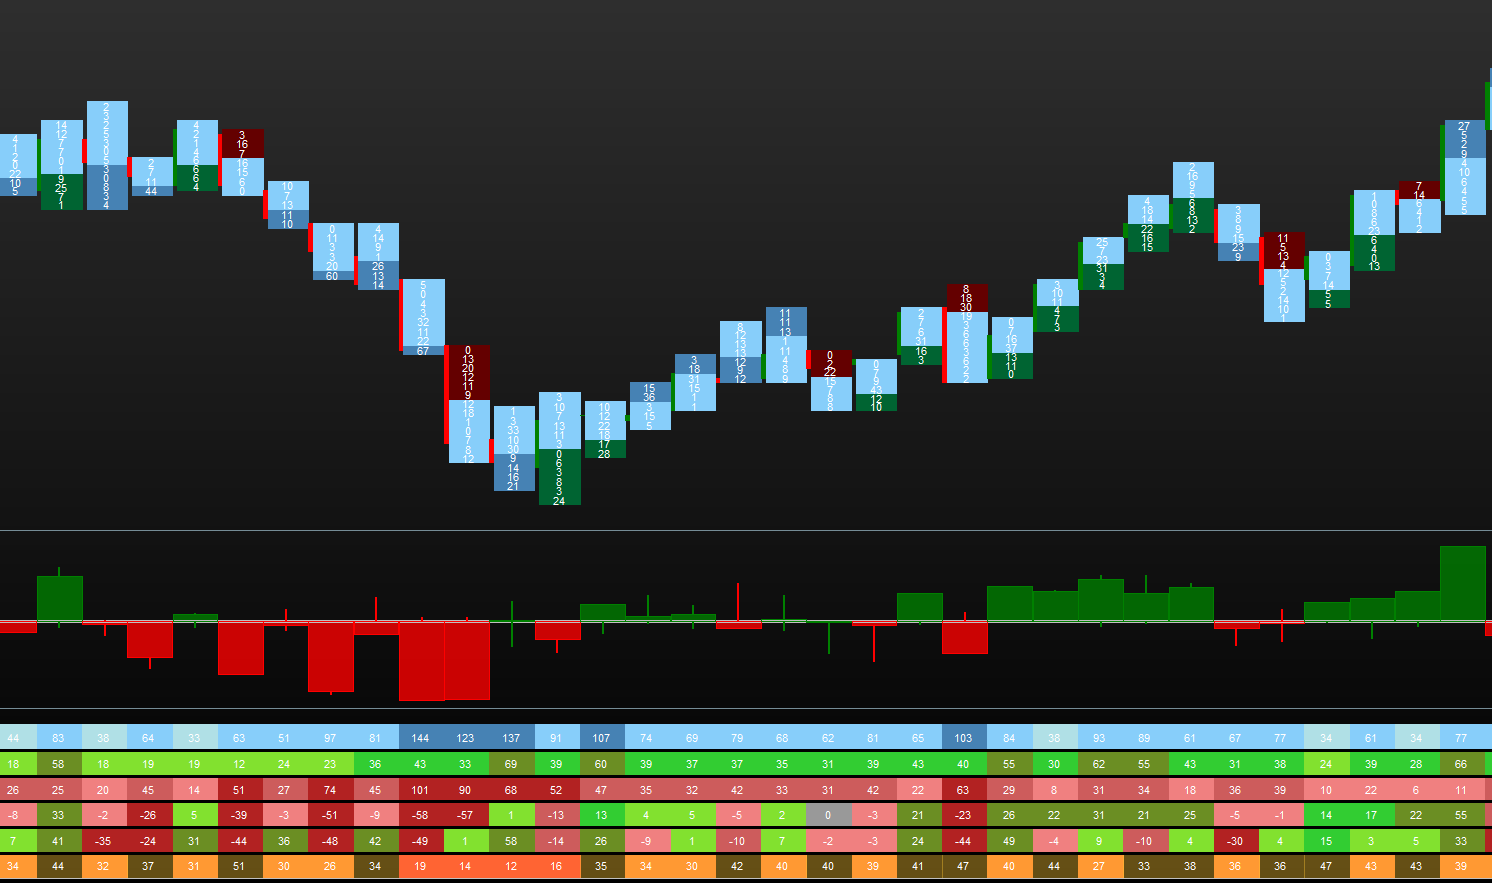
Full environment
bpater79 (client confirmé) –
Fonctionne très bien. Très satisfait de ce plugin.
Afficher l'original
Works really well.
Very happy with this plugin.
carl-wright (client confirmé) –
aurait été plus élevé si le tableau des statistiques avait des étiquettes. mais dans l’ensemble un bon produit avec de bonnes informations et des affichages clairs
Afficher l'original
would have been higher if the statistics table had labels. but overall a good product with good information and clear displays
arpenagos (client confirmé) –
Excellent complément pour la prise de décision, il fournit des informations détaillées qu’il n’est pas possible de trouver avec d’autres outils.
Afficher l'original
Excellent complement for decision making, it provides detailed information that is not possible to find with other tools.
chris_blu (client confirmé) –
Bonjour, c’est un excellent logiciel dont je suis très satisfait. Il y a beaucoup de paramètres et de filtres différents, dont certains sont uniques, il faut donc prendre son temps et étudier. Vous pouvez remonter dans le temps sur des échelles de temps plus élevées pour voir comment les renversements, les ruptures, les faux départs, les tendances, etc. se présentent avec les différents paramètres disponibles. C’est un ajout permanent à mes graphiques qui donne un niveau supplémentaire de confirmation que les barres de prix ne peuvent pas offrir par elles-mêmes, ainsi que d’aider à resserrer les stops derrière les impressions basses !
Afficher l'original
Hi, great bit of software that I am very happy with. There are lots of different settings and filters, some unique to this so you need to take your time and study. You can go back in time on higher timeframes to see how reversals/breakouts/fake outs/trends etc look in the different settings available. Its a permanent addition to my charts that gives an extra level of confirmation price bars cannot offer on their own, as well as helping tighten stops behind low prints!!