What Are Footprint Charts?
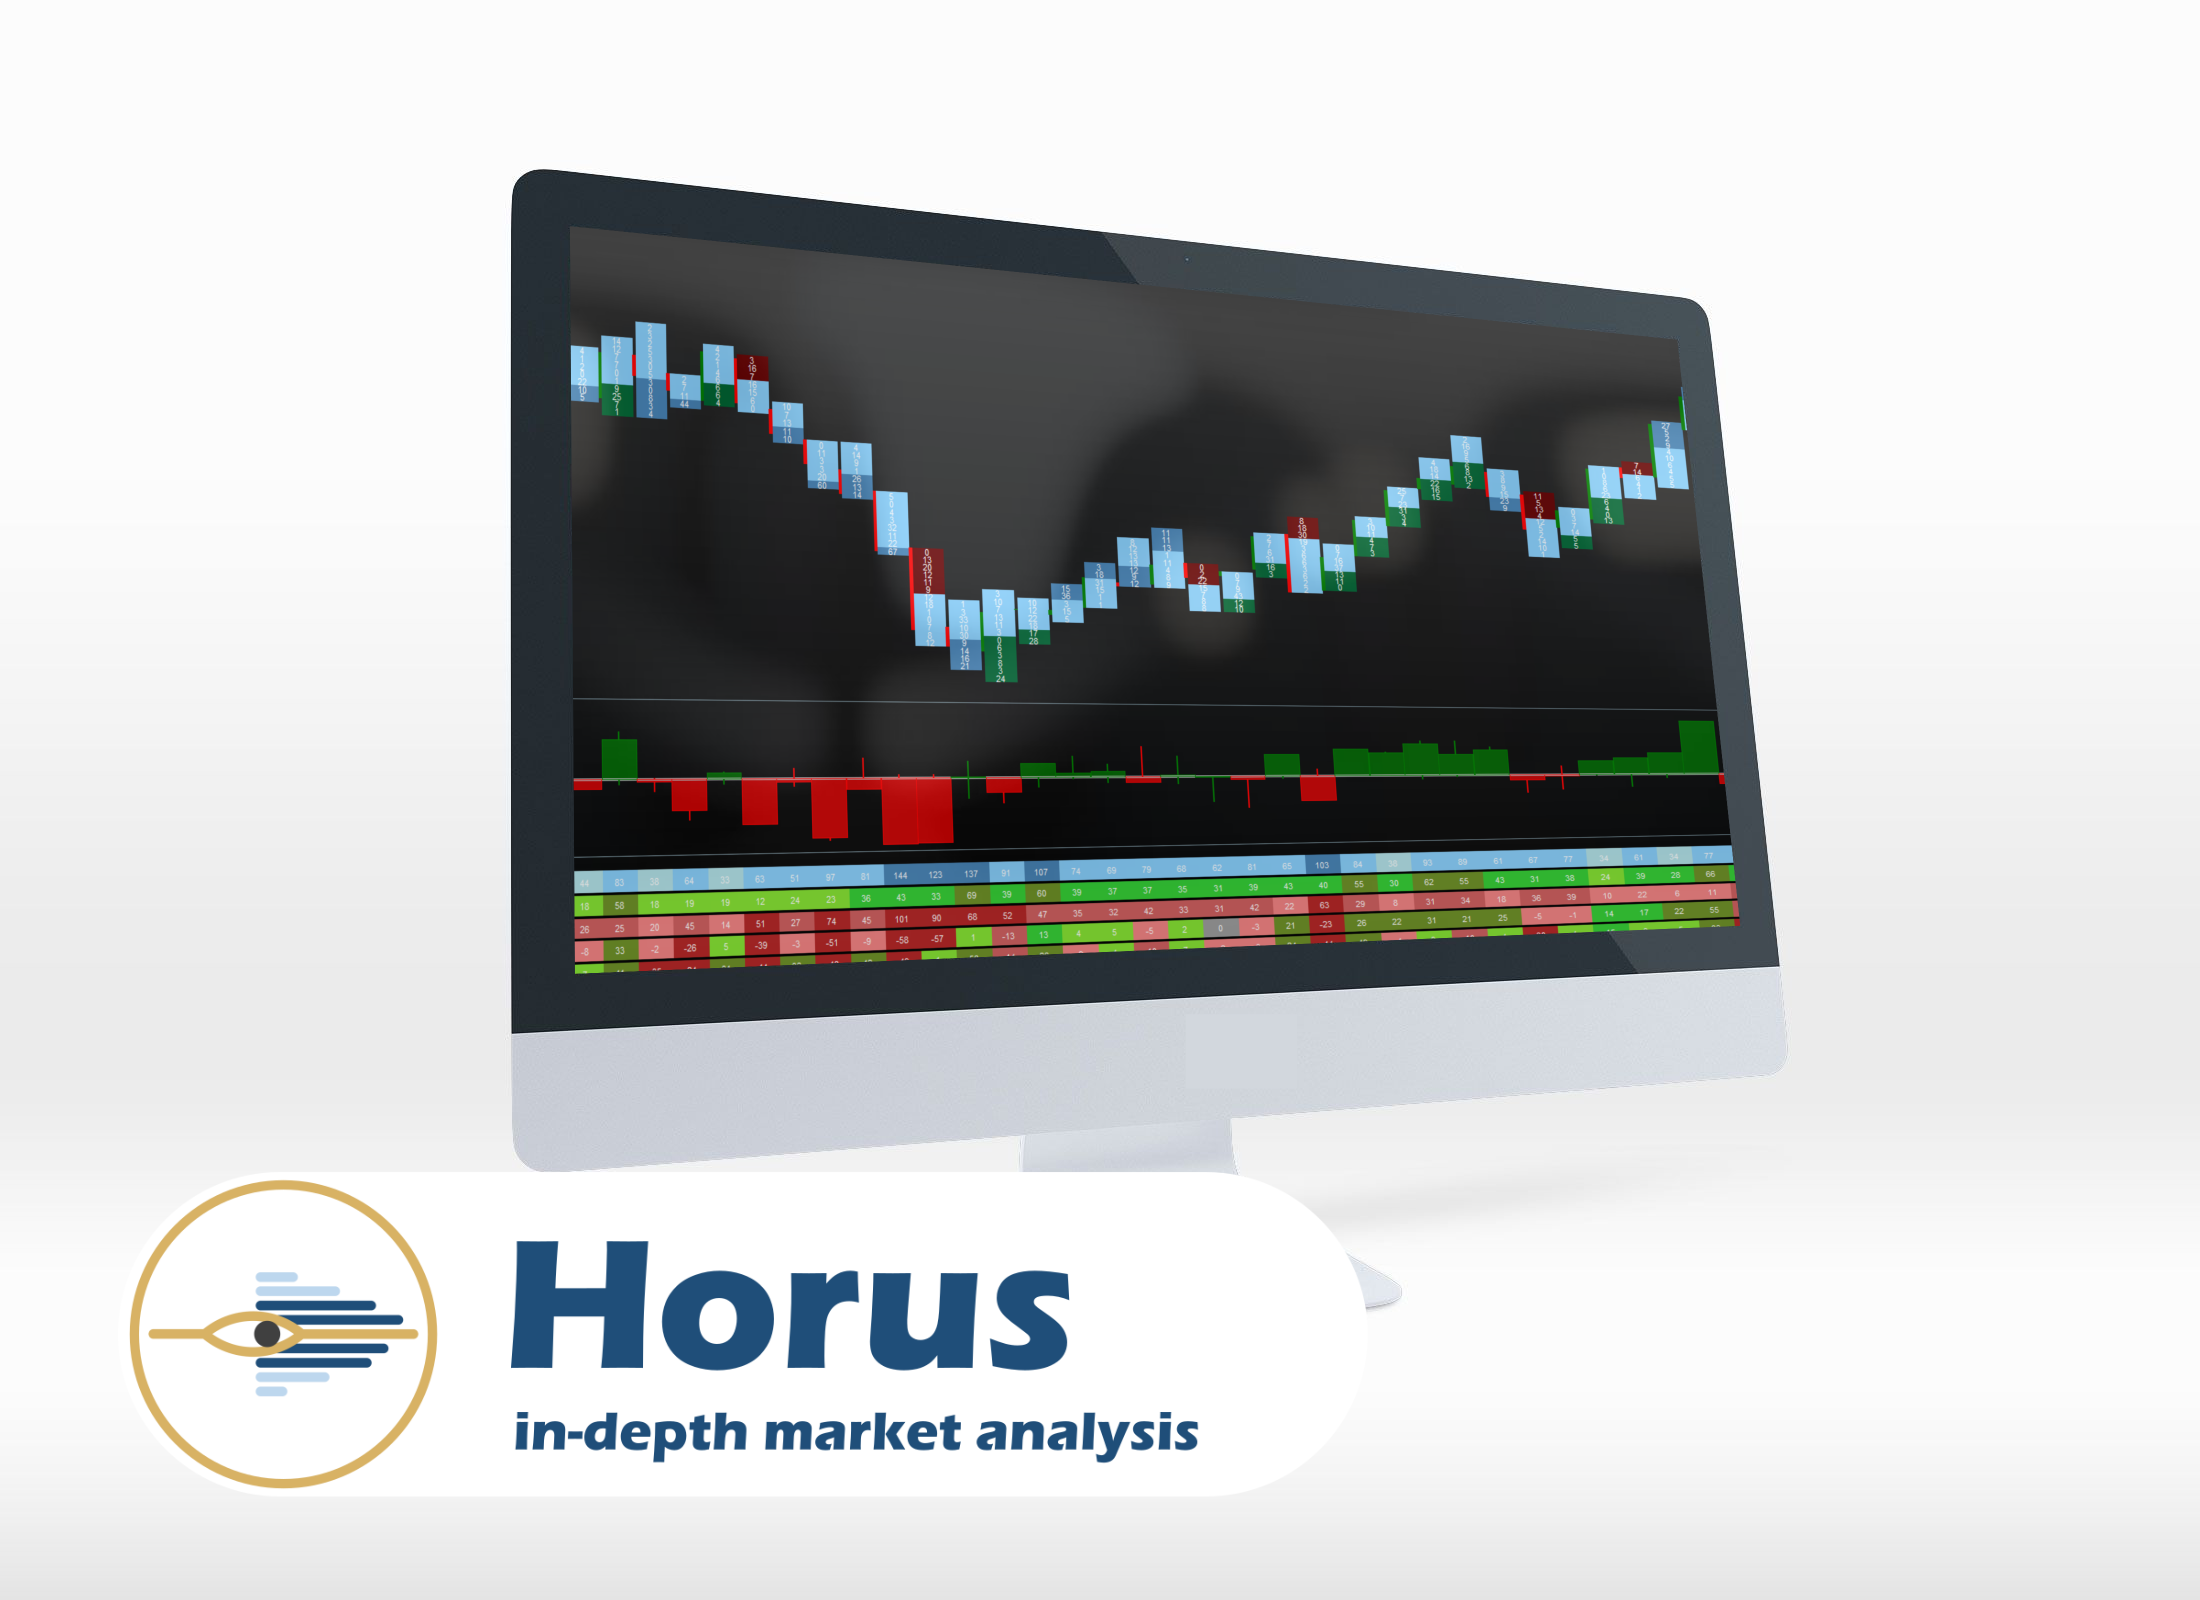
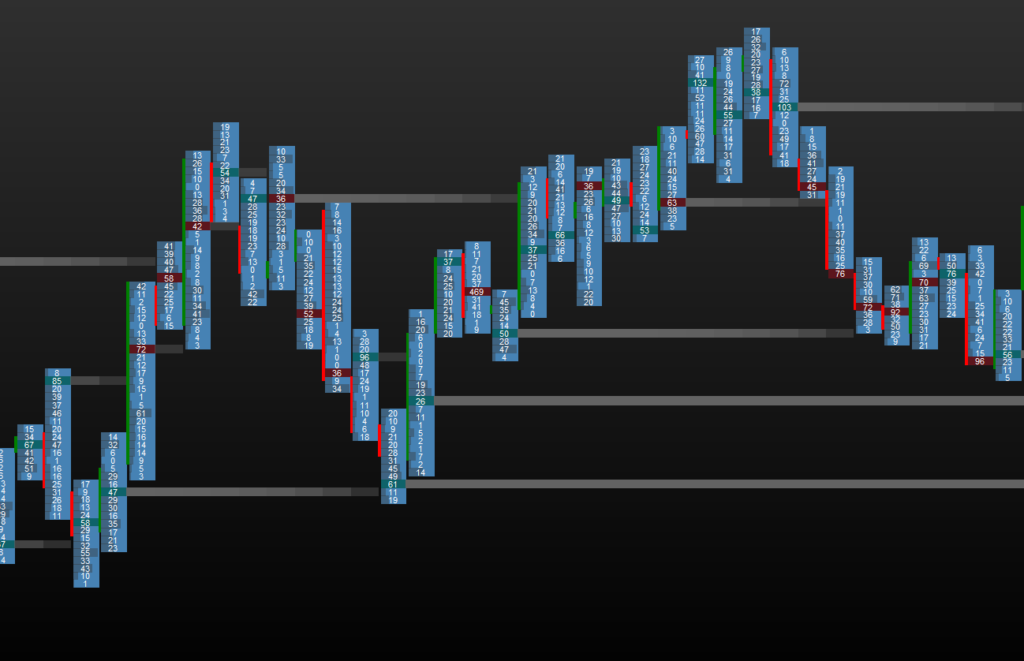
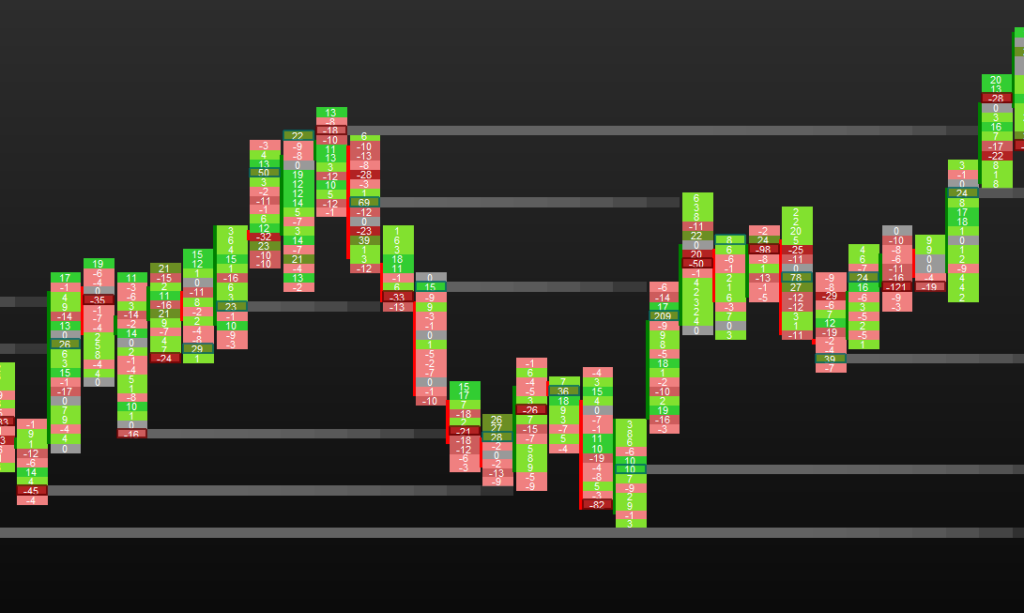
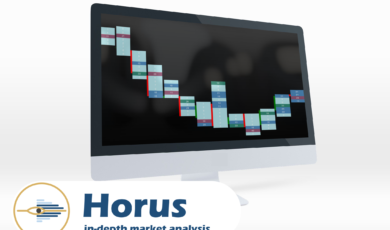
Footprint charts are a type of candlestick chart that provides trade volume information in addition to price. This gives an additional dimension that allows the investor a more in-depth analysis. The footprint chart is a major tool for many professional traders.
What are the features?
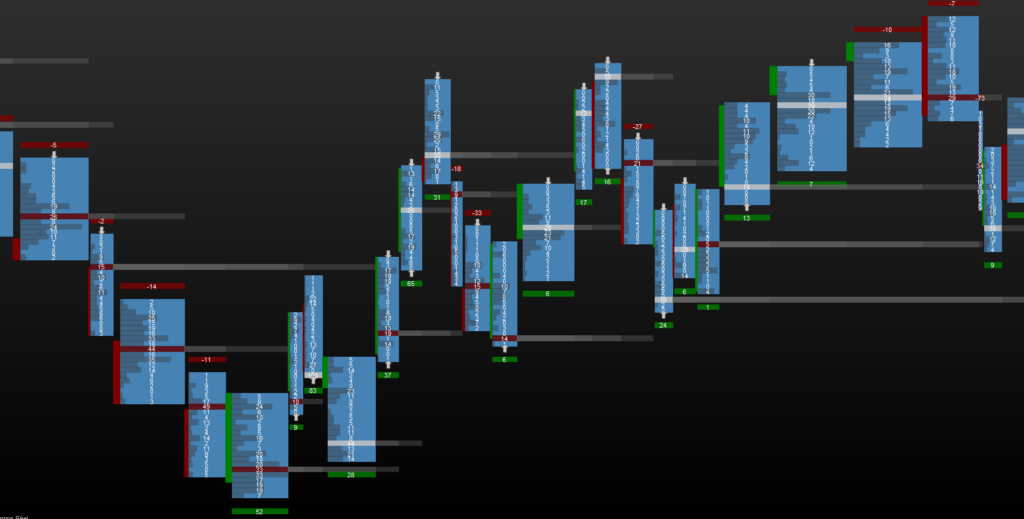
Horus – Footprint :
- Live current candle display
- Tick candle or range bar (New) of your choice
- Number of levels of your choice
- Volume filter
- 5 kinds of volume information that can be displayed :
- Bid/Ask – Sellers and buyers volume are separated
- Volume – Sellers and buyers volume are cumulative
- Only the Buyers volume
- Only the Sellers volume
- Delta between Buyers and Sellers
- 4 kinds of colourization :
- VPOC highlighted
- Median display
- Volume profile display
- Custom Display
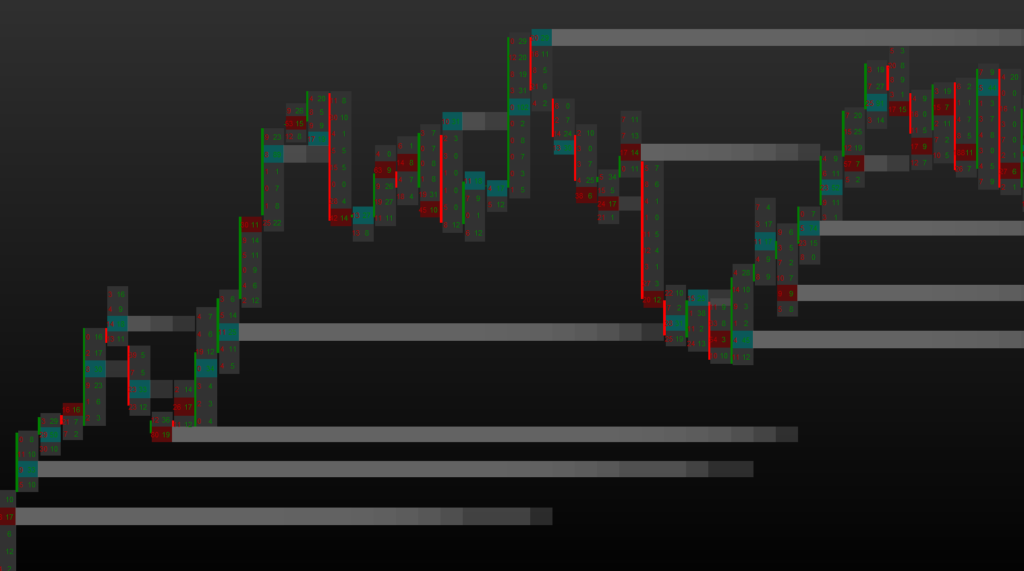
- Naked VPOC – display untested vpocs
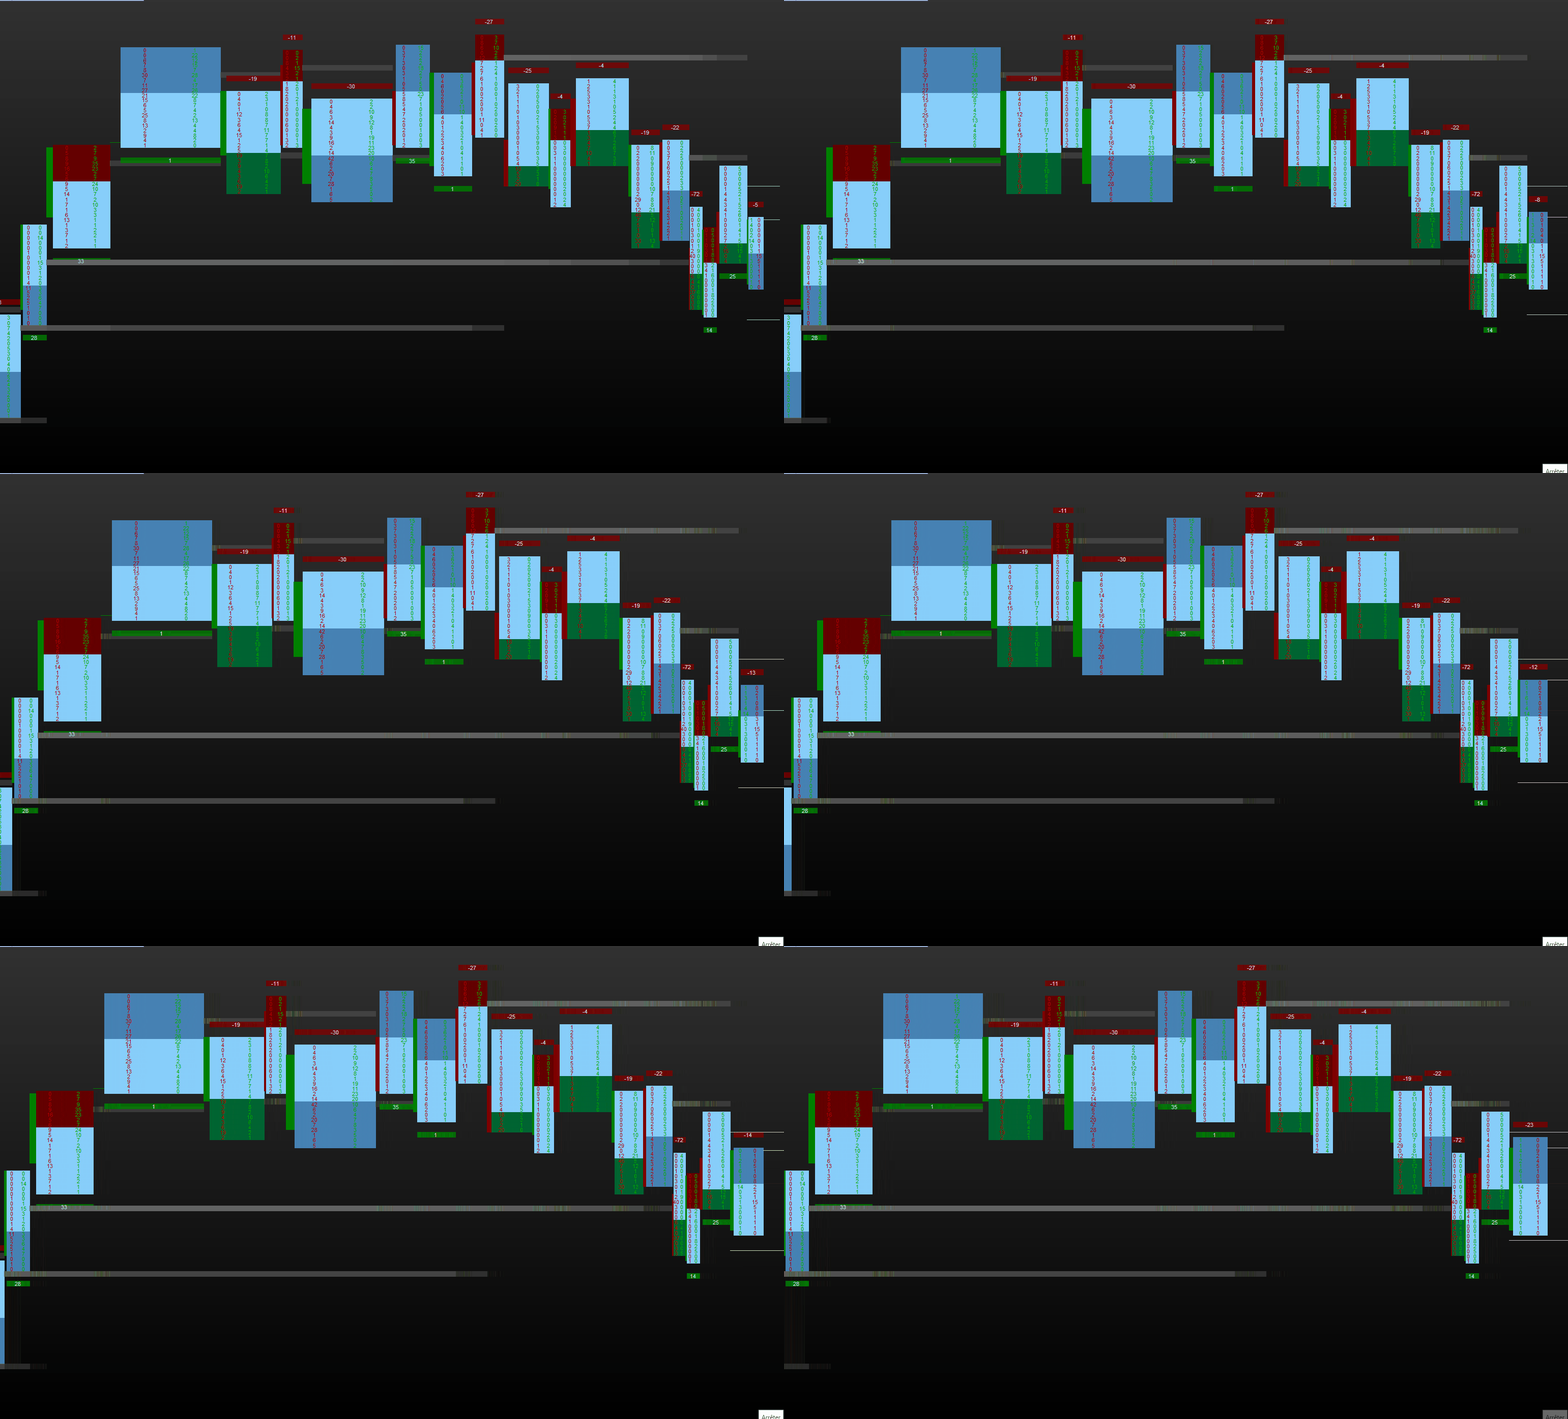
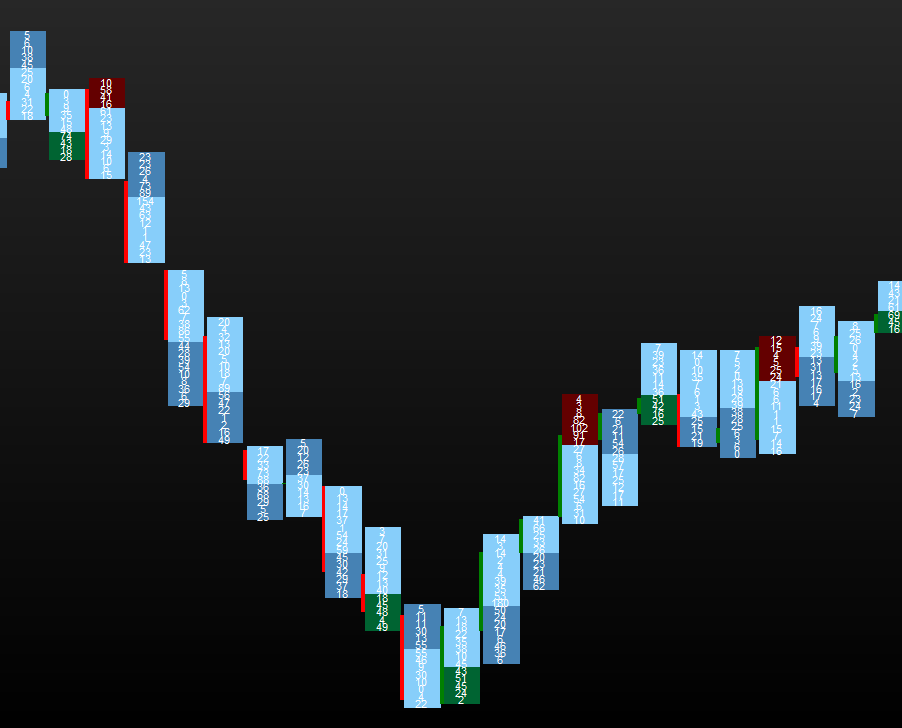
- Delta Volume the whole candle (New)
- Auction End Display (New)
!!New Update!!
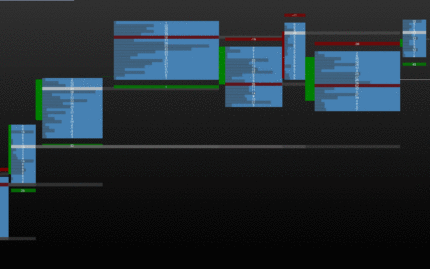
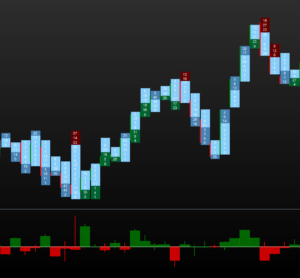
Here Footprint Range bar with Volume Delta and Auction end
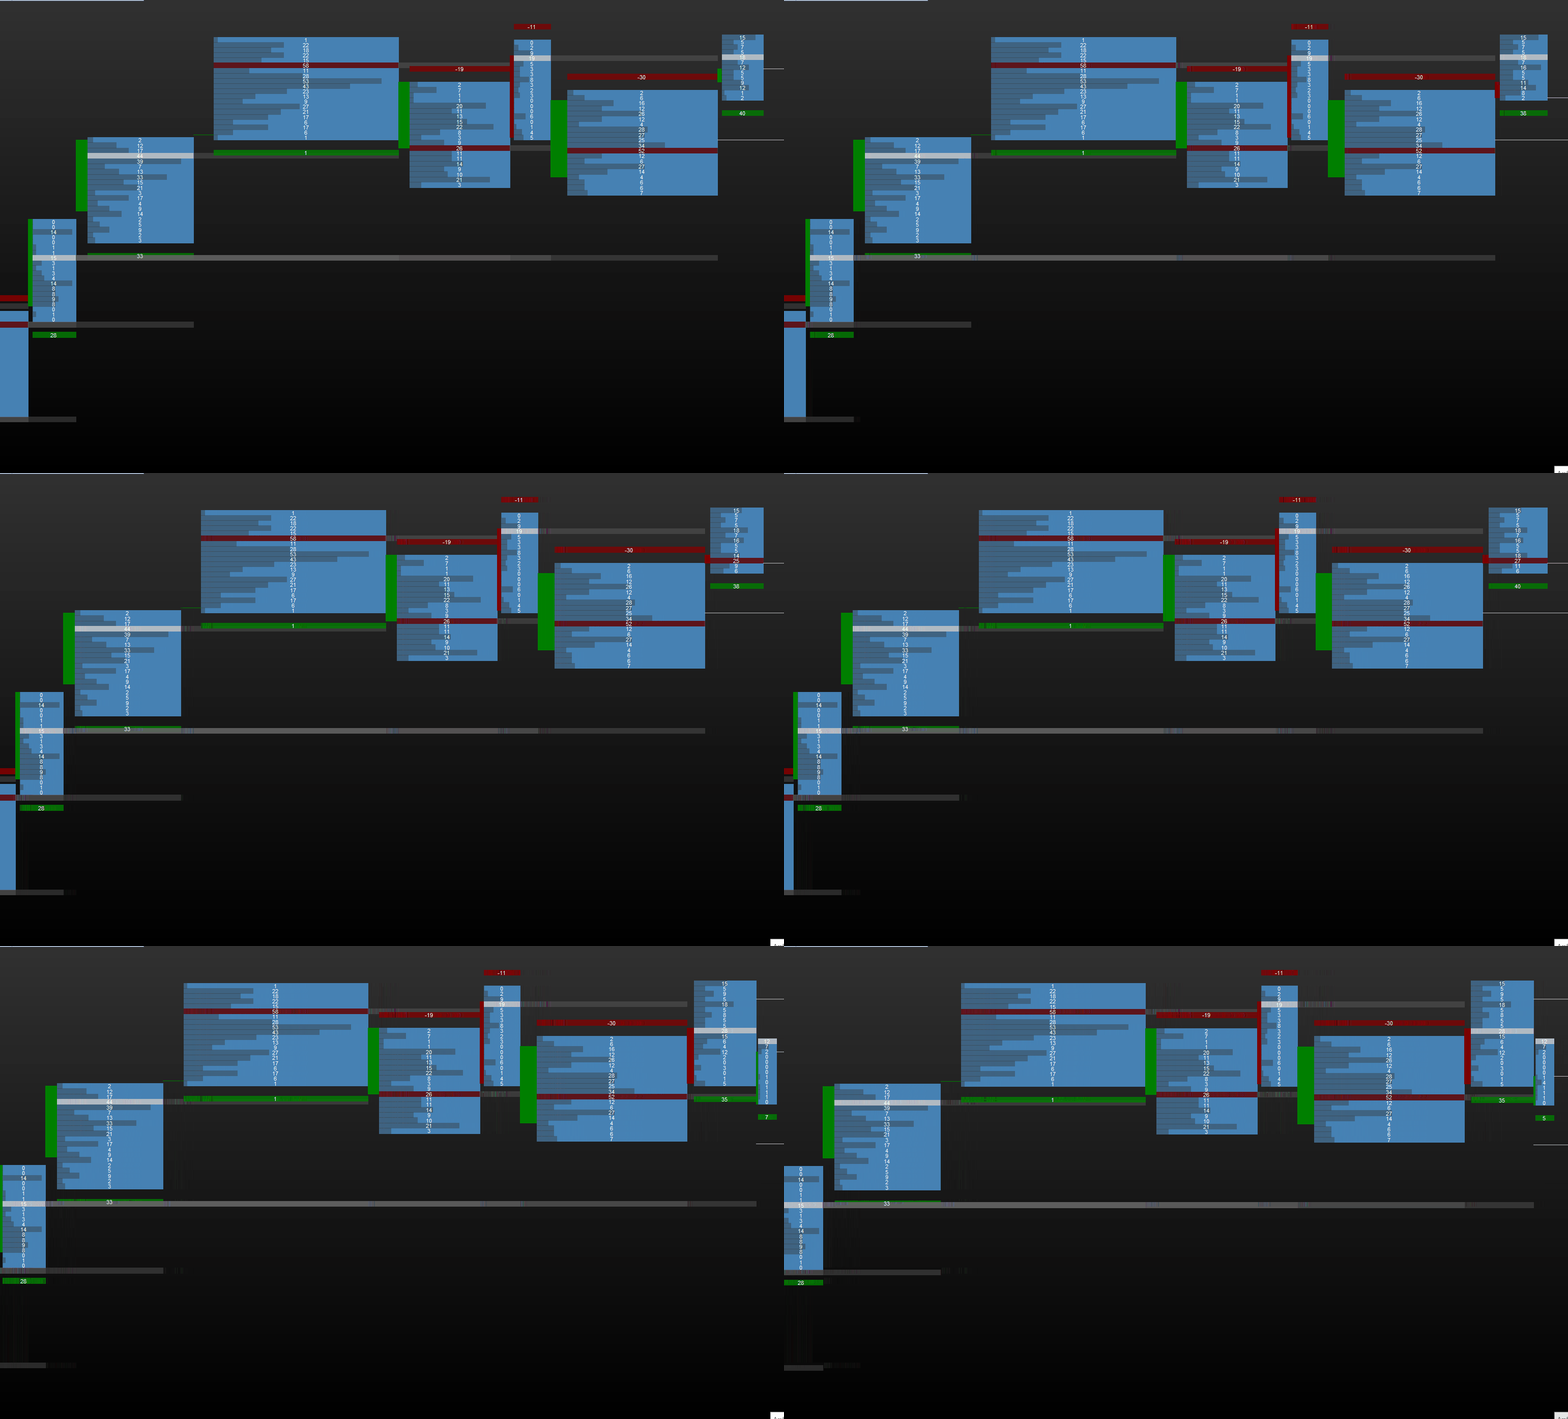
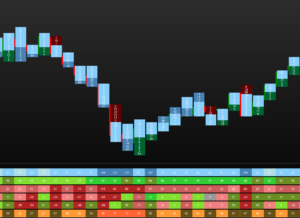
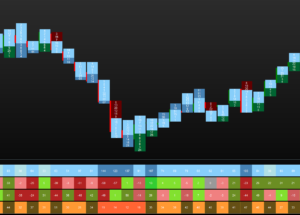
Horus – Statistic :
- Tick candle or range bar (New) of your choice
- Volume filter
- 6 kinds of statistics to display or not (1 to 6 statistics displayed) :
- Volume – Sellers and buyers volume are cumulative
- Only the Buyers volume
- Only the Sellers volume
- Delta between Buyers and Sellers
- Volume Delta with the previous candle
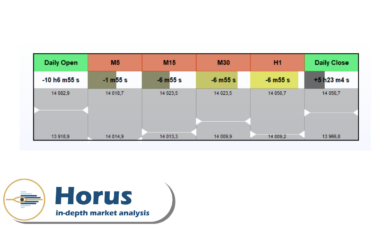
- Speed, the number of seconds the candle lasts
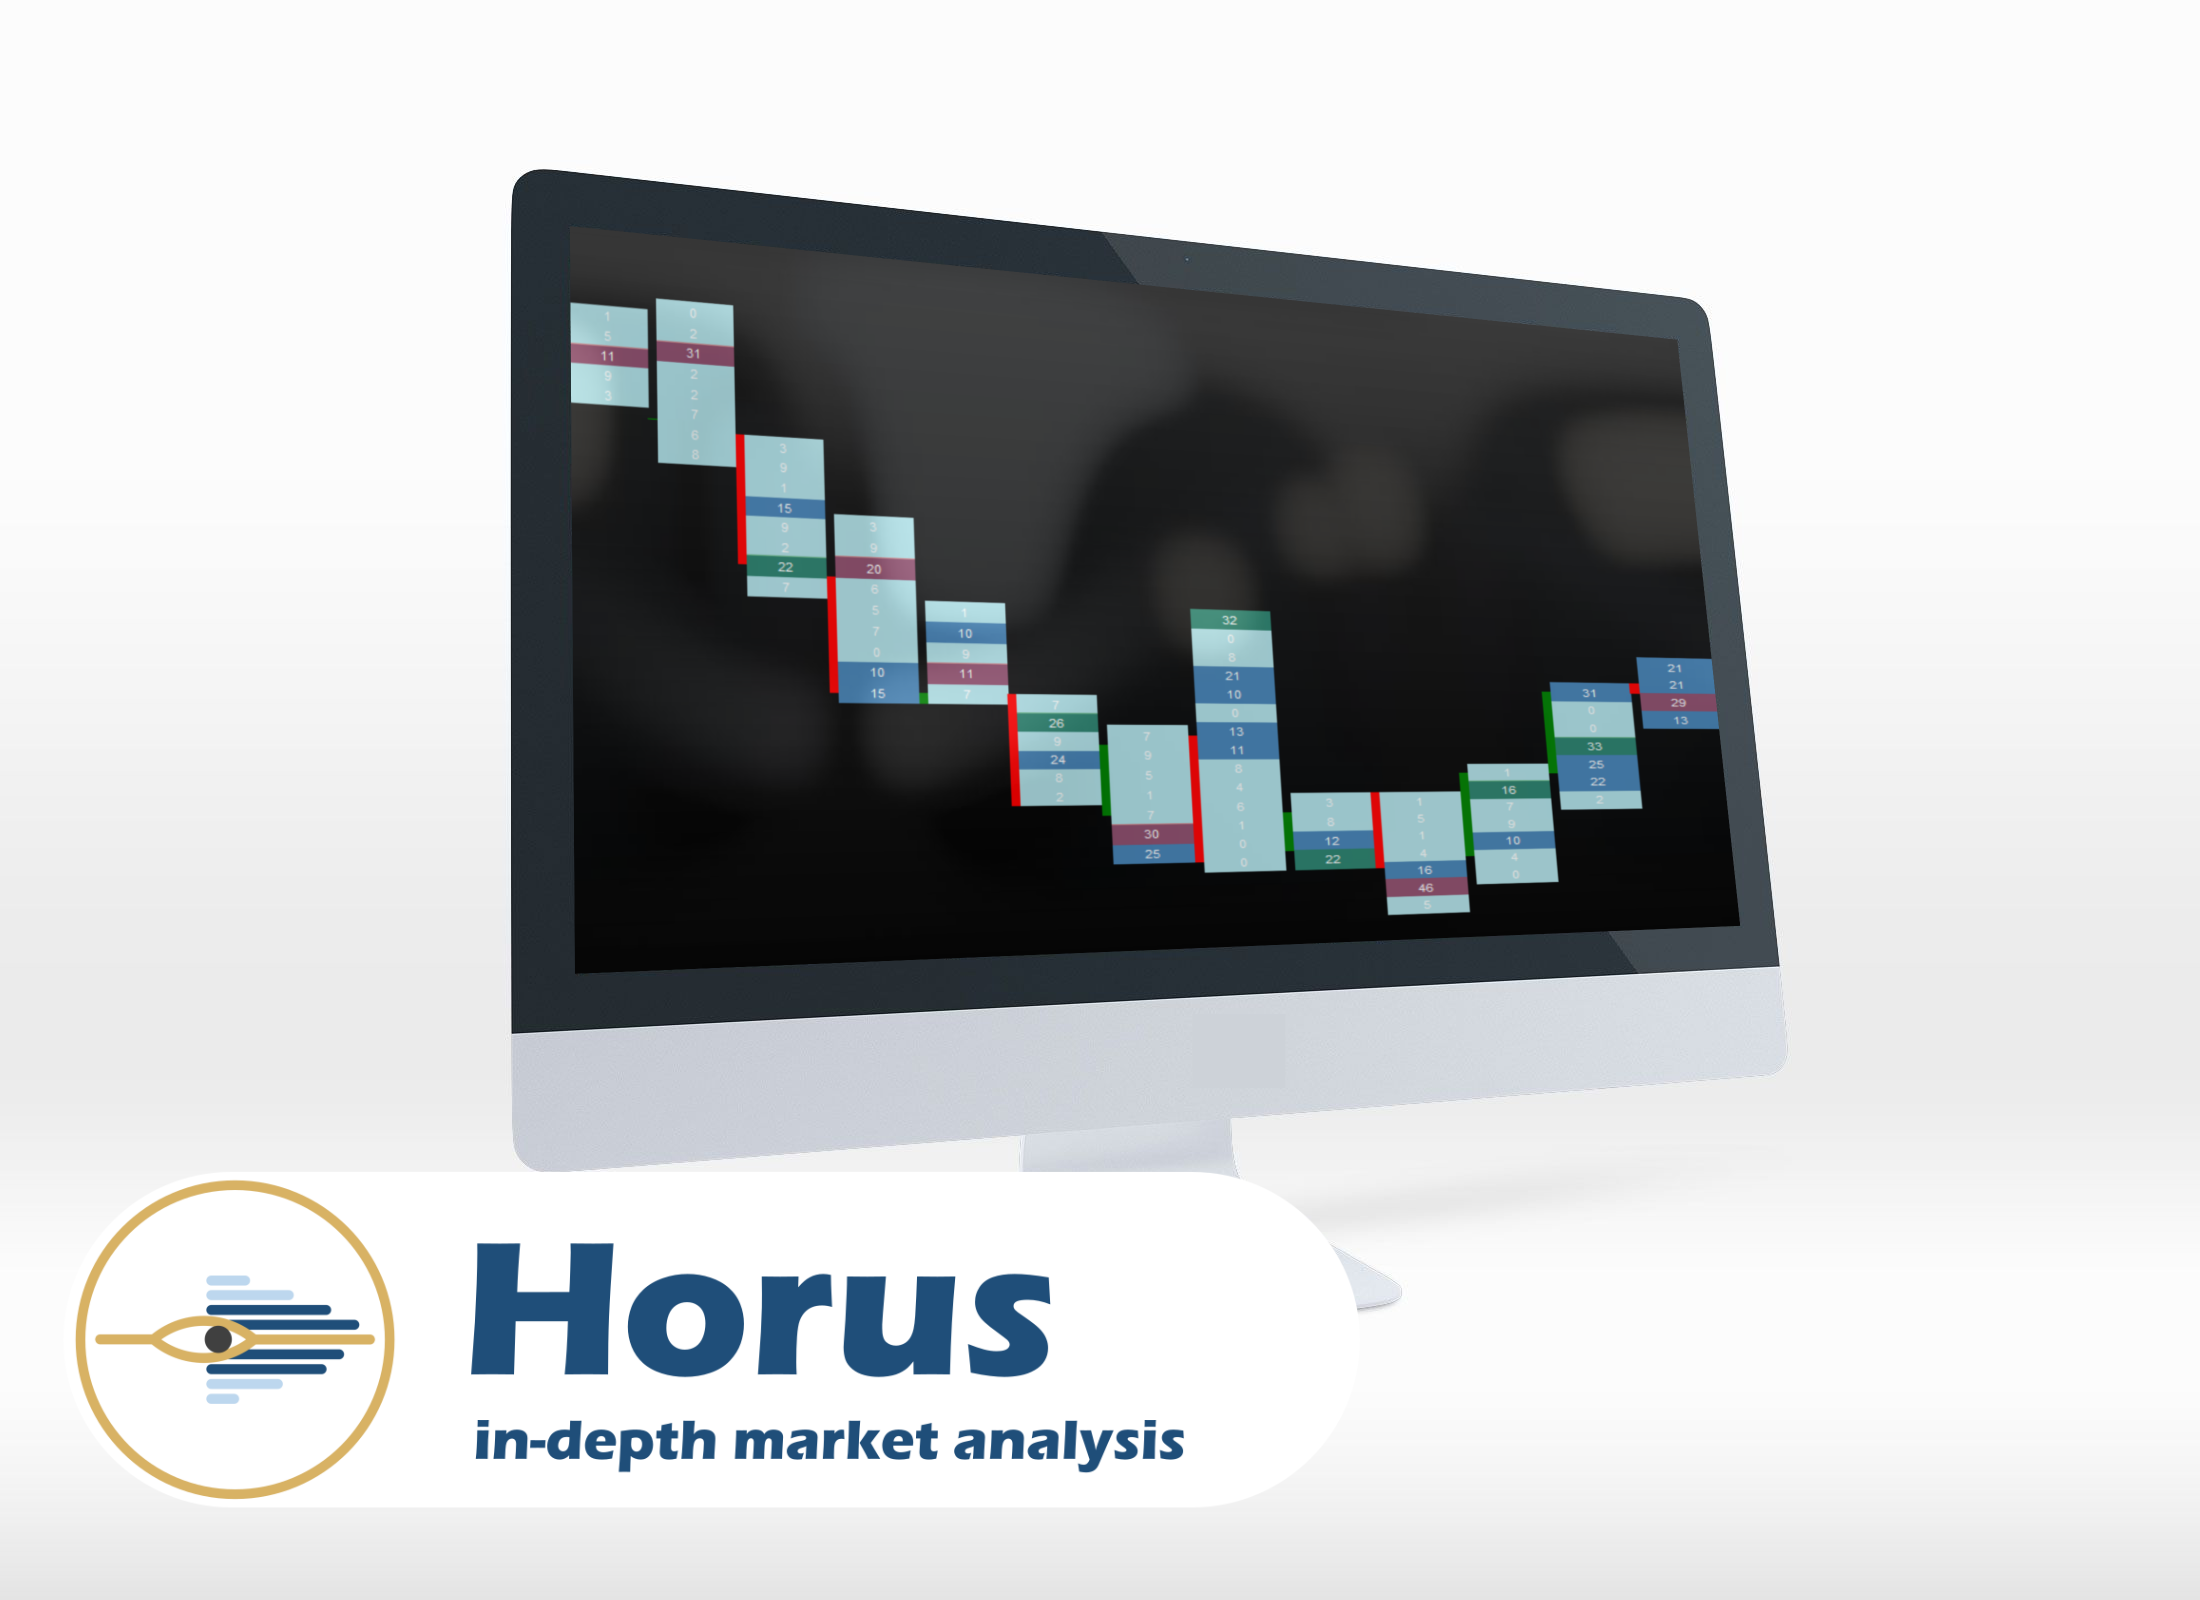
With 6 statistics
With 4 statistics
Horus – Volume Delta :
- Tick candle or range bar (New) of your choice
- Volume filter
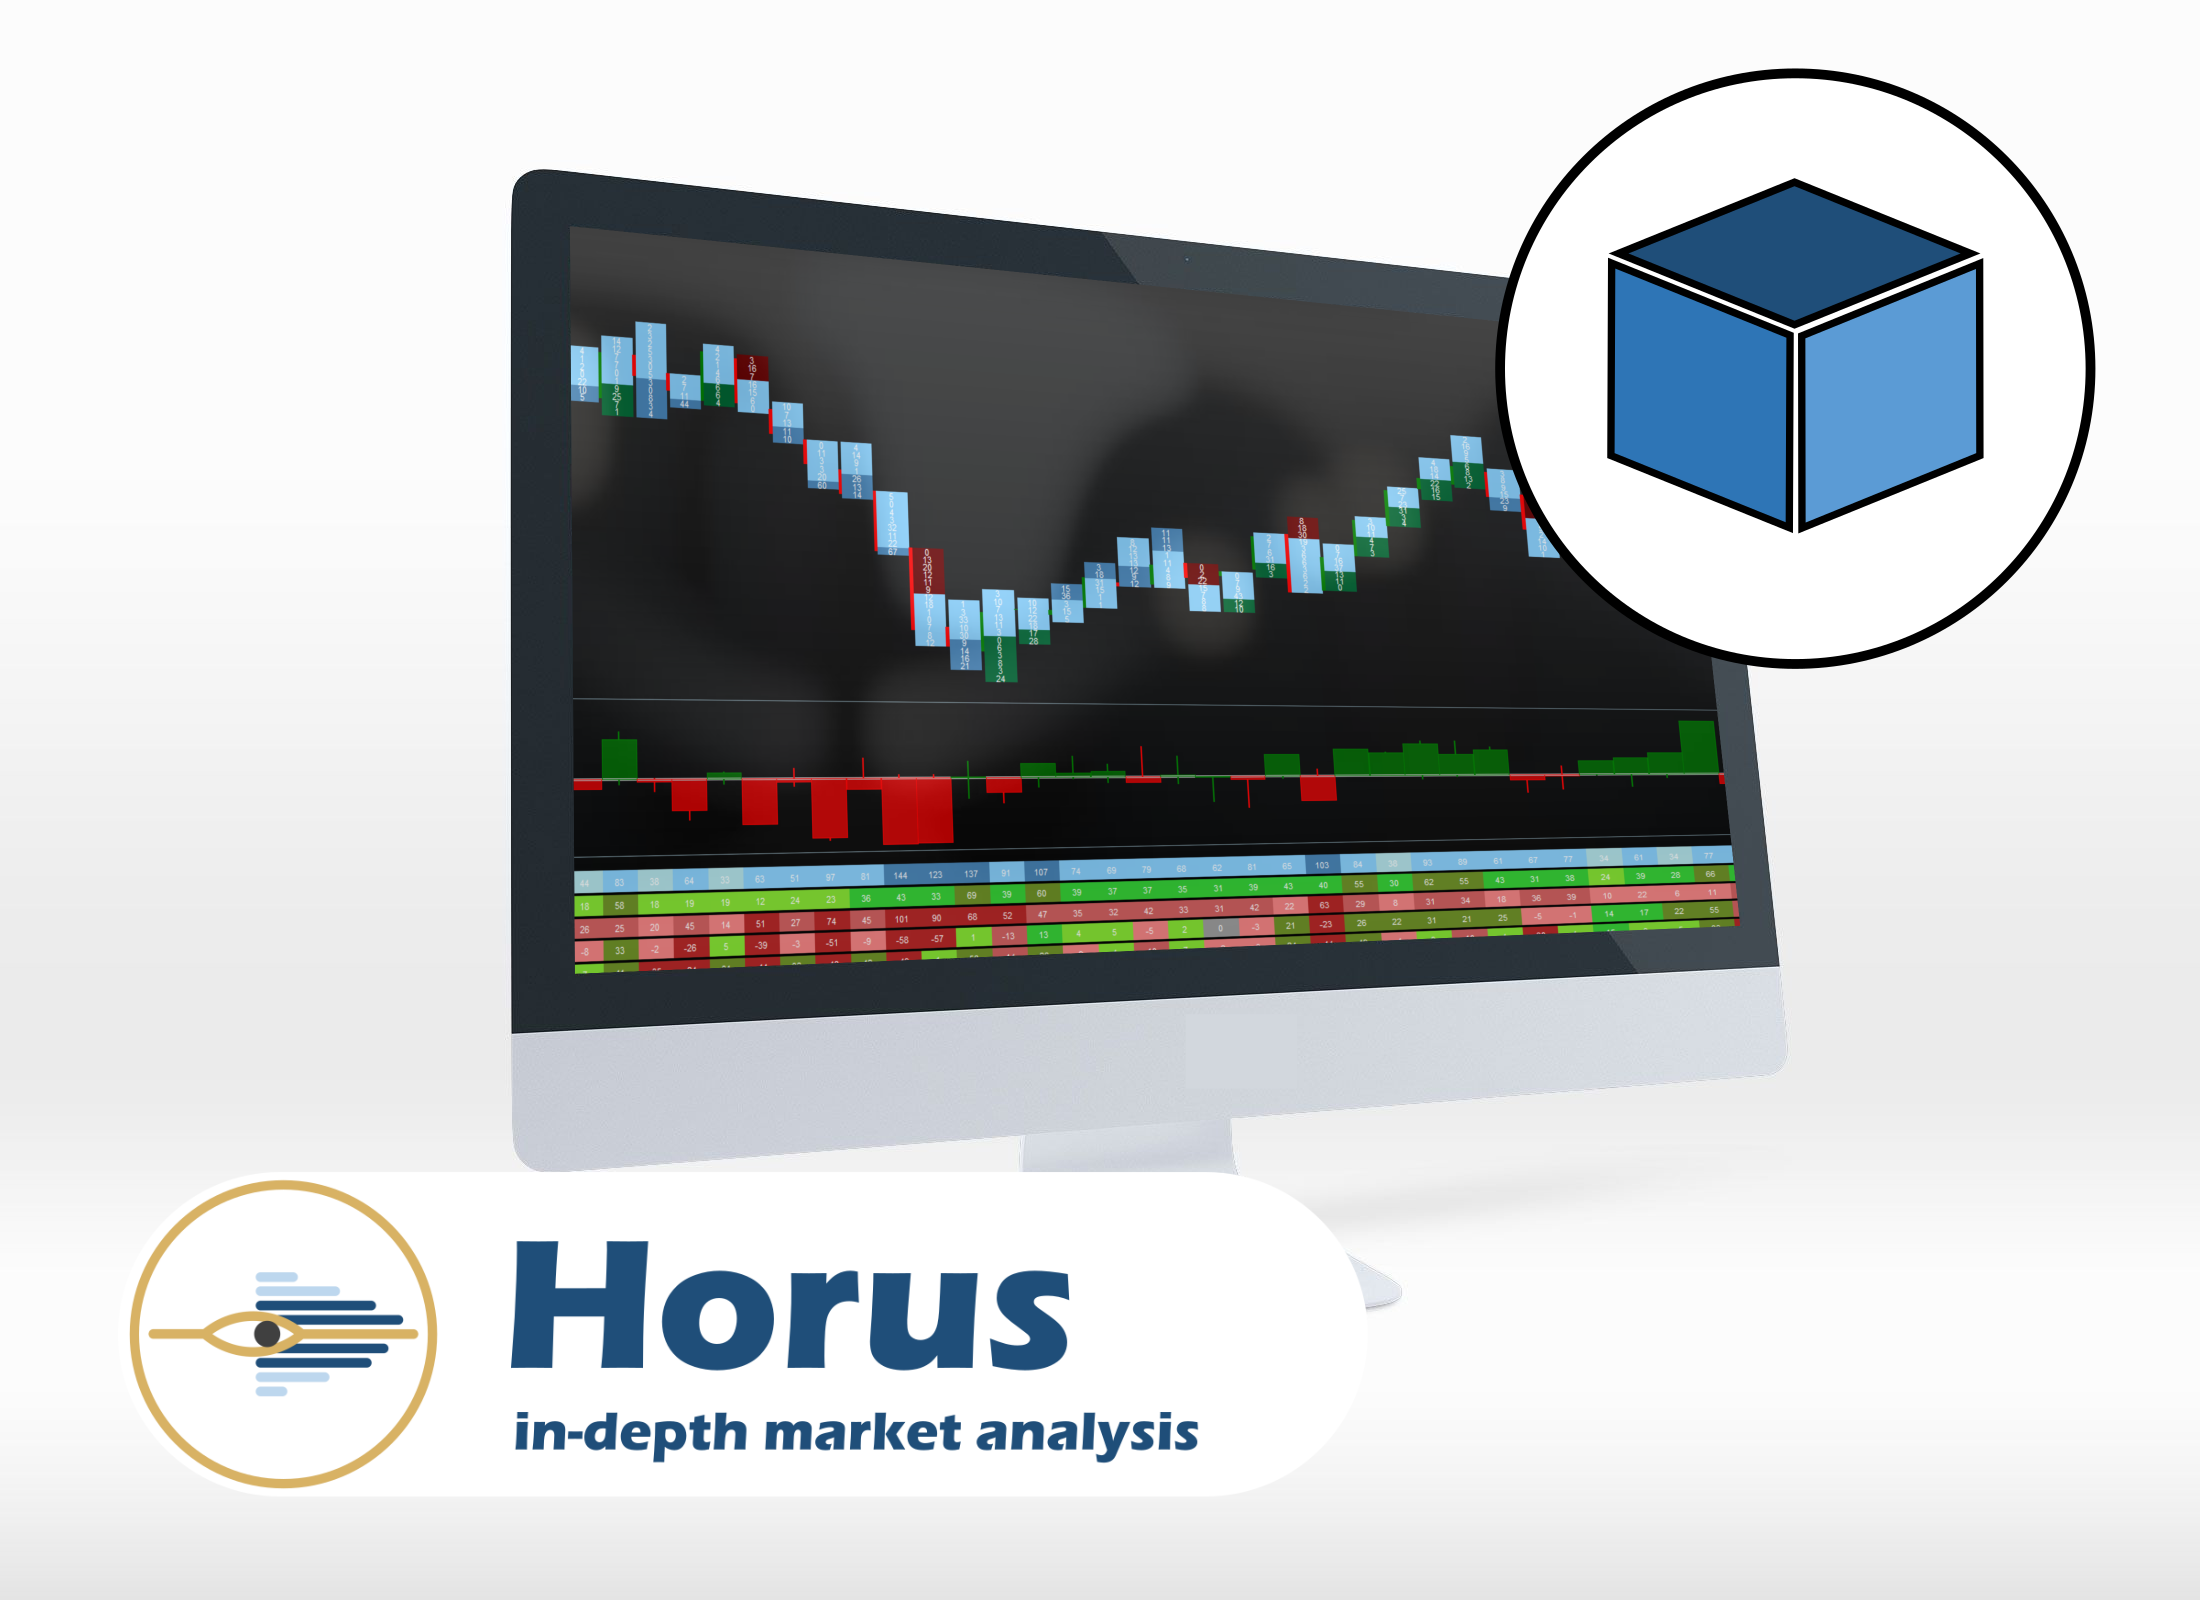
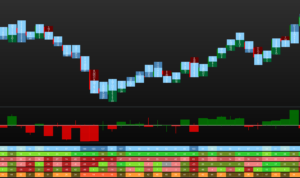
Full environment


bpater79 (Verifizierter Besitzer) –
Funktioniert wirklich gut. Sehr zufrieden mit diesem Plugin.
carl-wright (Verifizierter Besitzer) –
würde höher gewesen sein, wenn die Statistik-Tabelle hatte Etiketten. aber insgesamt ein gutes Produkt mit guten Informationen und klare Anzeigen
arpenagos (Verifizierter Besitzer) –
Es ist eine hervorragende Ergänzung für die Entscheidungsfindung und liefert detaillierte Informationen, die mit anderen Instrumenten nicht zu finden sind.
chris_blu (Verifizierter Besitzer) –
Hallo, ein tolles Stück Software, mit dem ich sehr zufrieden bin. Es gibt viele verschiedene Einstellungen und Filter, einige einzigartig, so dass Sie Ihre Zeit nehmen und studieren müssen. Sie können in der Zeit auf höheren Zeitrahmen zurückgehen, um zu sehen, wie Umkehrungen/Ausbrüche/Fake Outs/Trends usw. in den verschiedenen verfügbaren Einstellungen aussehen. Es ist ein ständiger Zusatz zu meinen Charts, der eine zusätzliche Bestätigung bietet, die die Preisbalken allein nicht bieten können, und außerdem dabei hilft, die Stopps hinter den Tiefstständen festzulegen!!!