What Are Footprint Charts?
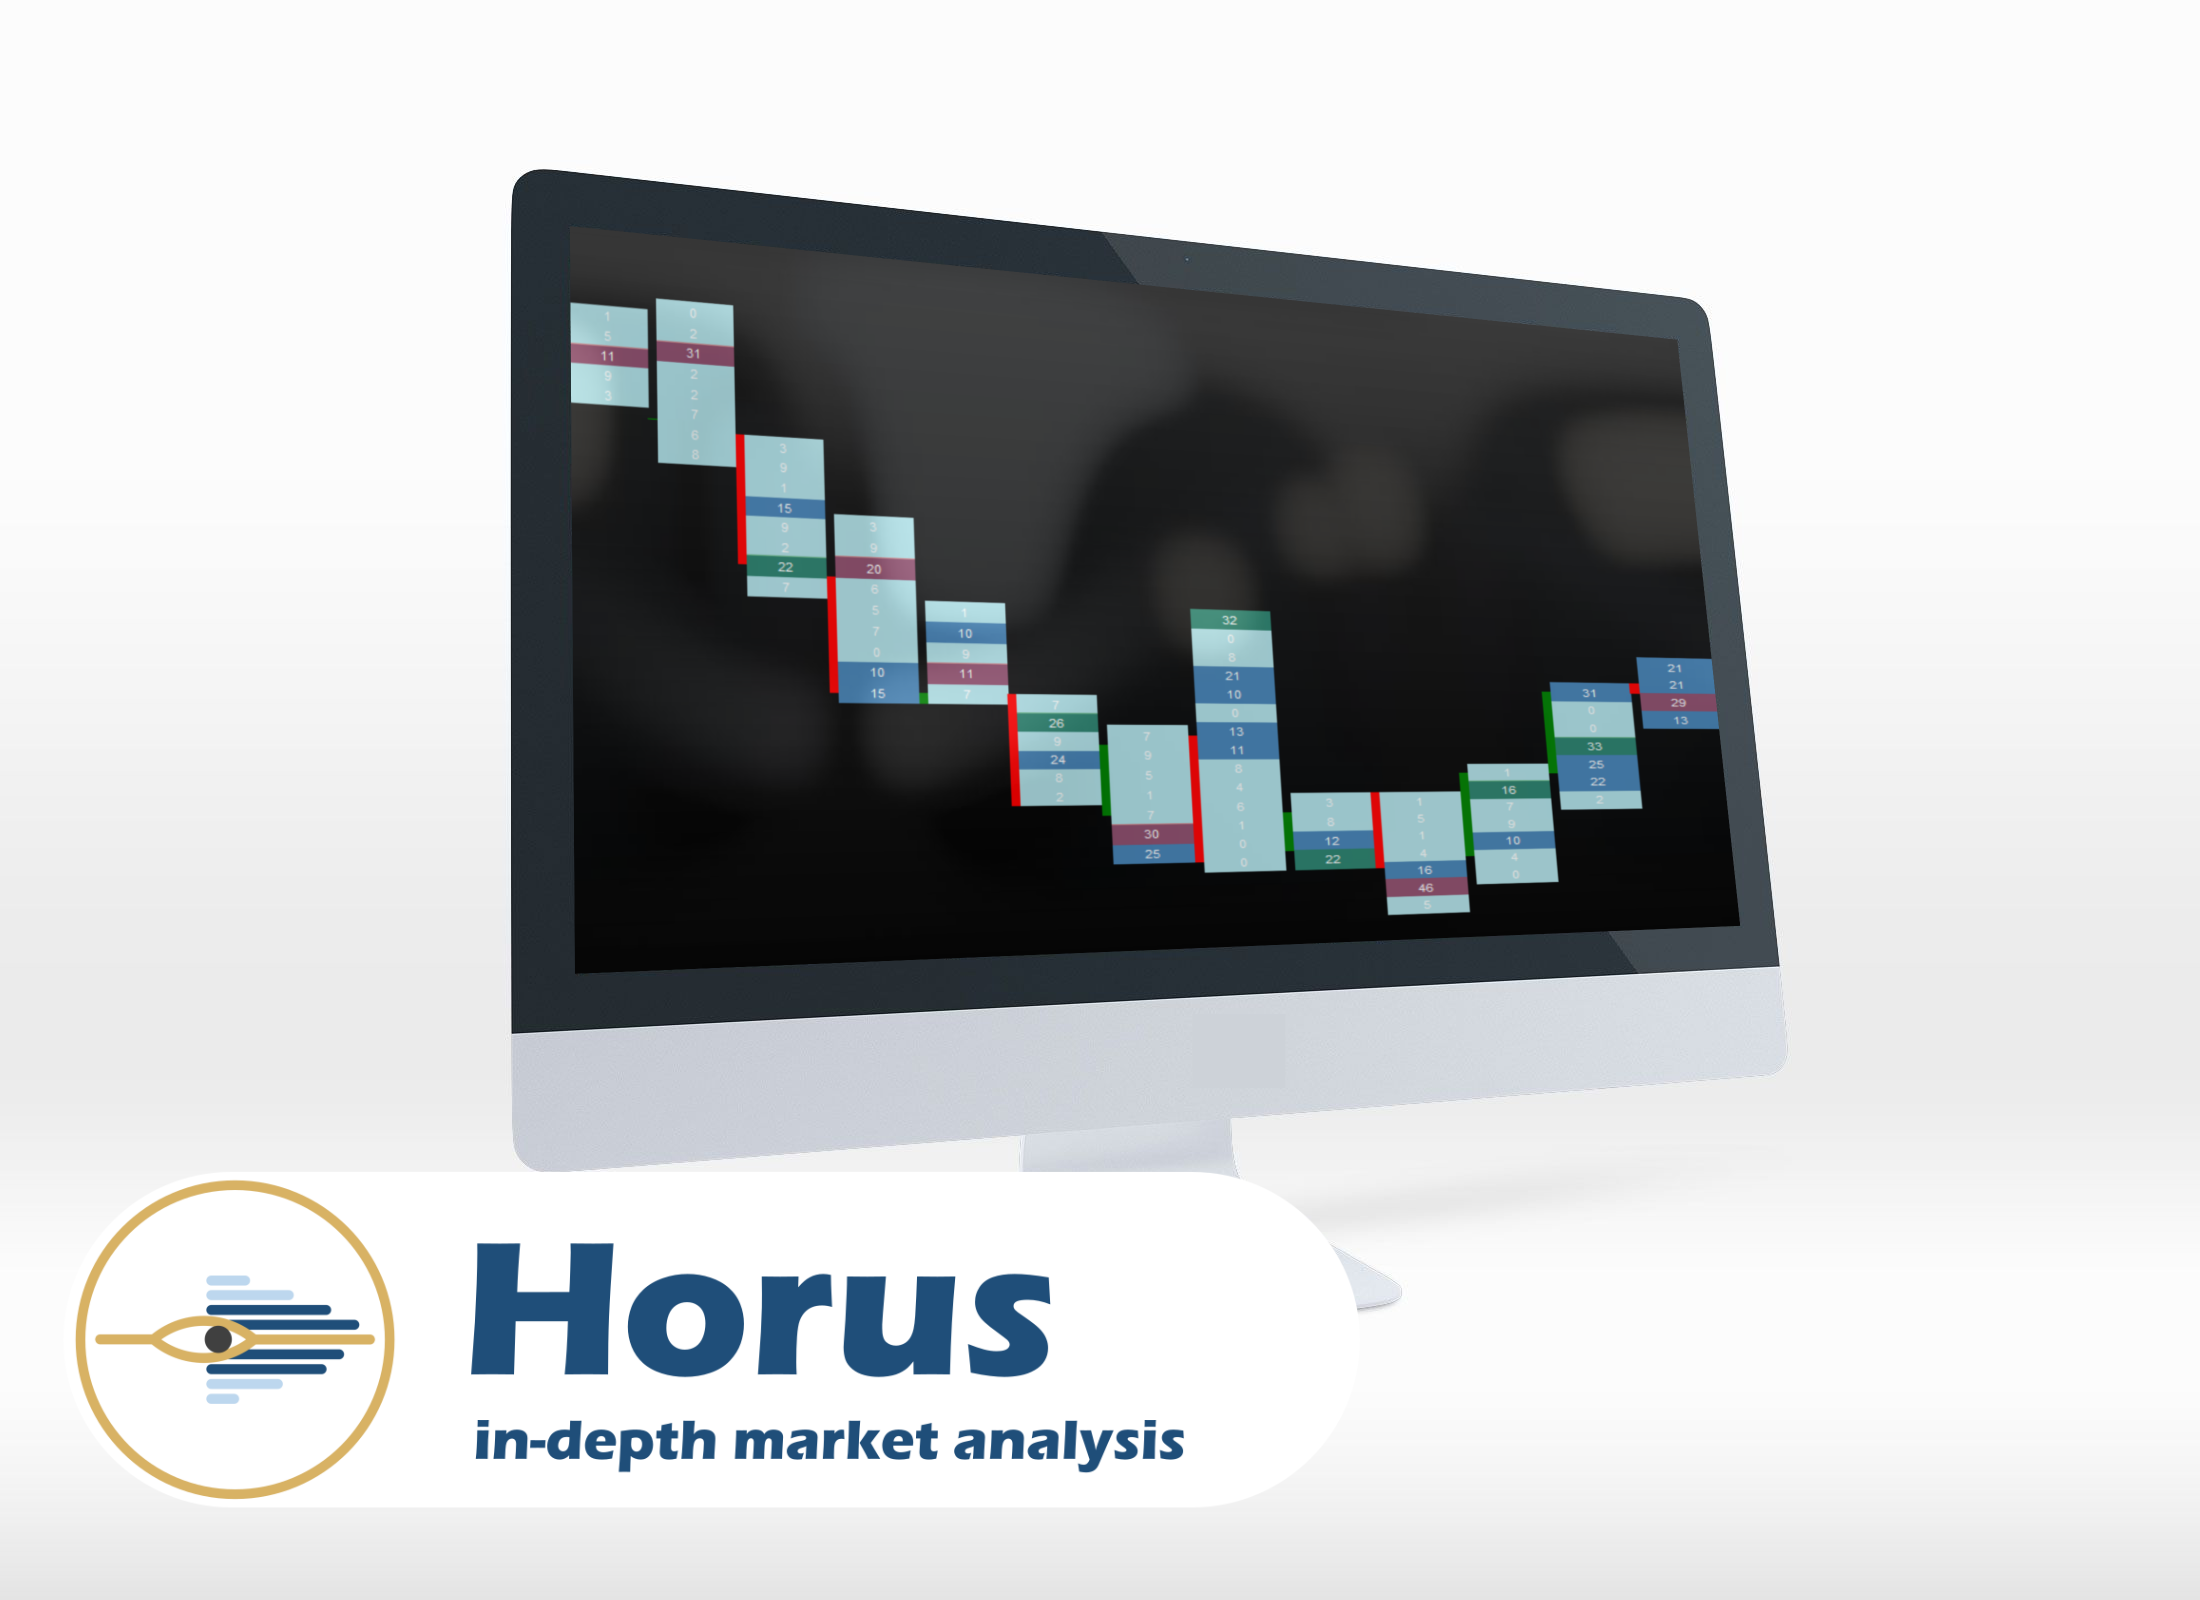
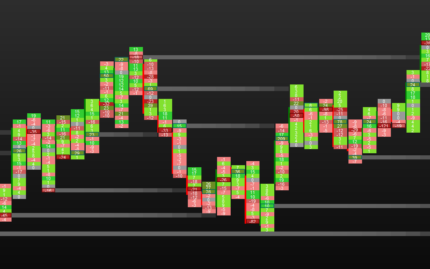
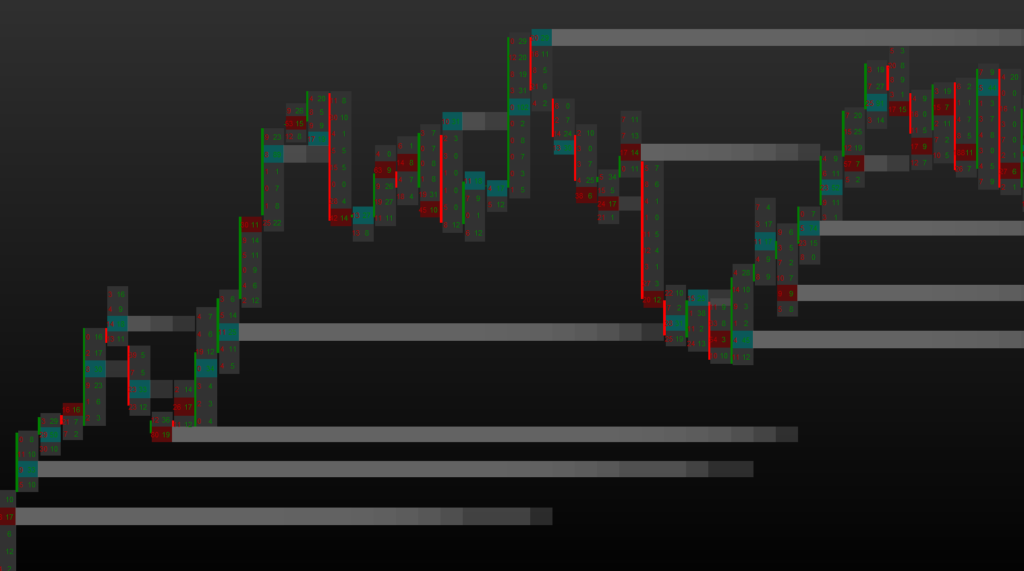
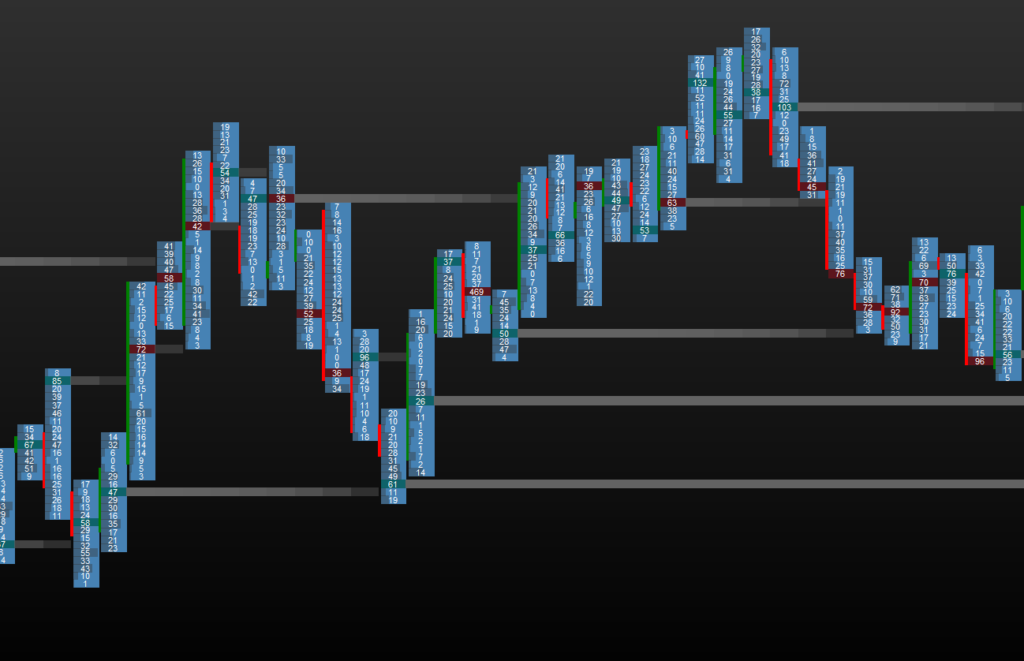
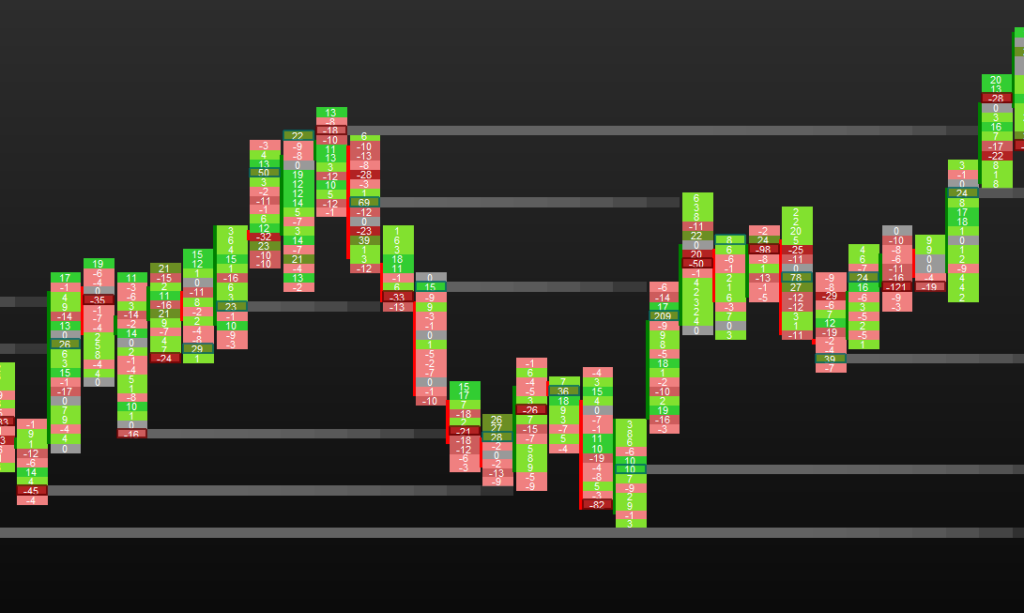
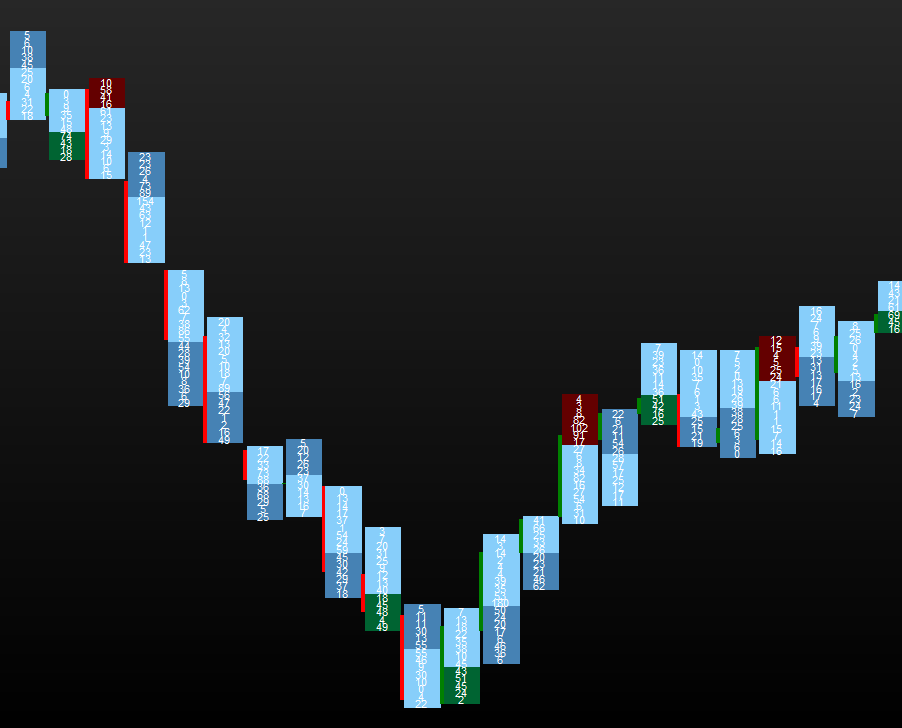
Footprint charts are a type of candlestick chart that provides trade volume information in addition to price. This gives an additional dimension that allows the investor a more in-depth analysis. The footprint chart is a major tool for many professional traders.
What are the features?
- Live current candle display
- Tick candle or range bar (New) of your choice
- Number of levels of your choice
- Volume filter
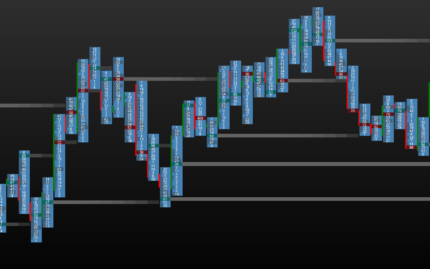
- 5 kinds of volume information that can be displayed :
- Bid/Ask – Sellers and buyers volume are separated
- Volume – Sellers and buyers volume are cumulative
- Only the Buyers volume
- Only the Sellers volume
- Delta between Buyers and Sellers
- 4 kinds of colourization :
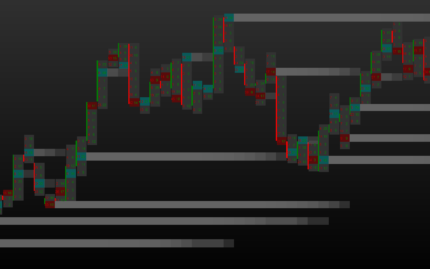
- VPOC highlighted
- Median display
- Volume profile display
- Custom Display
- Naked VPOC – display untested vpocs
- Delta Volume the whole candle (New)
- Auction End Display (New)


Valoraciones
No hay valoraciones aún.