

This indicator is the result of my daily trading experience as a professional carbon emission trader. In the commodity market, volumes are very important, and the price ranges that are formed, perfectly reflect the situation between supply and demand. This indicator has now become indispensable for my daily trading.
We all know that price levels are critical for trading, but those levels tell us nothing more.
I decided to create this indicator to have a graphic support that is not limited to the detection of price levels, but that gives multidimensional information of price levels, such as the history of the price and the history of volumes. It is pretty much a Volume by Price indicator, but extended to the higher level.
Using this indicator, it is very simple to predict the strength of a resistance or a support, and especially where prices can accelerate or decelerate without indicating changes in the trend.
HOW THE INDICATOR WORKS:
Market levels detection:
This indicator allows to detect resistance supports, based on the last swing points.
When detecting levels manually, each of us can follow different rules, yielding different results. This indicator uses the following rules:
- The most recent points are more precise than the past points.
- To filter for levels that are close, the indicator uses a deviation value, which defines its “definition”. The definition can be set from the interface. The higher the definition, the lower the filtering of the levels, and consequently the greater the number of levels plotted.
- By selecting the variable “MarketLevels = 1”:
- Detects supports and resistances and plot on the graph the corresponding segments with a fixed thickness.
- By selecting the variable “MarketLevels = 2”:
- It detects supports, resistances and volumes by price shape, and plots on the graph the corresponding segments with increasing thicknesses, for increasing volumes by price. (A greater thickness indicates greater resistance or a greater support)
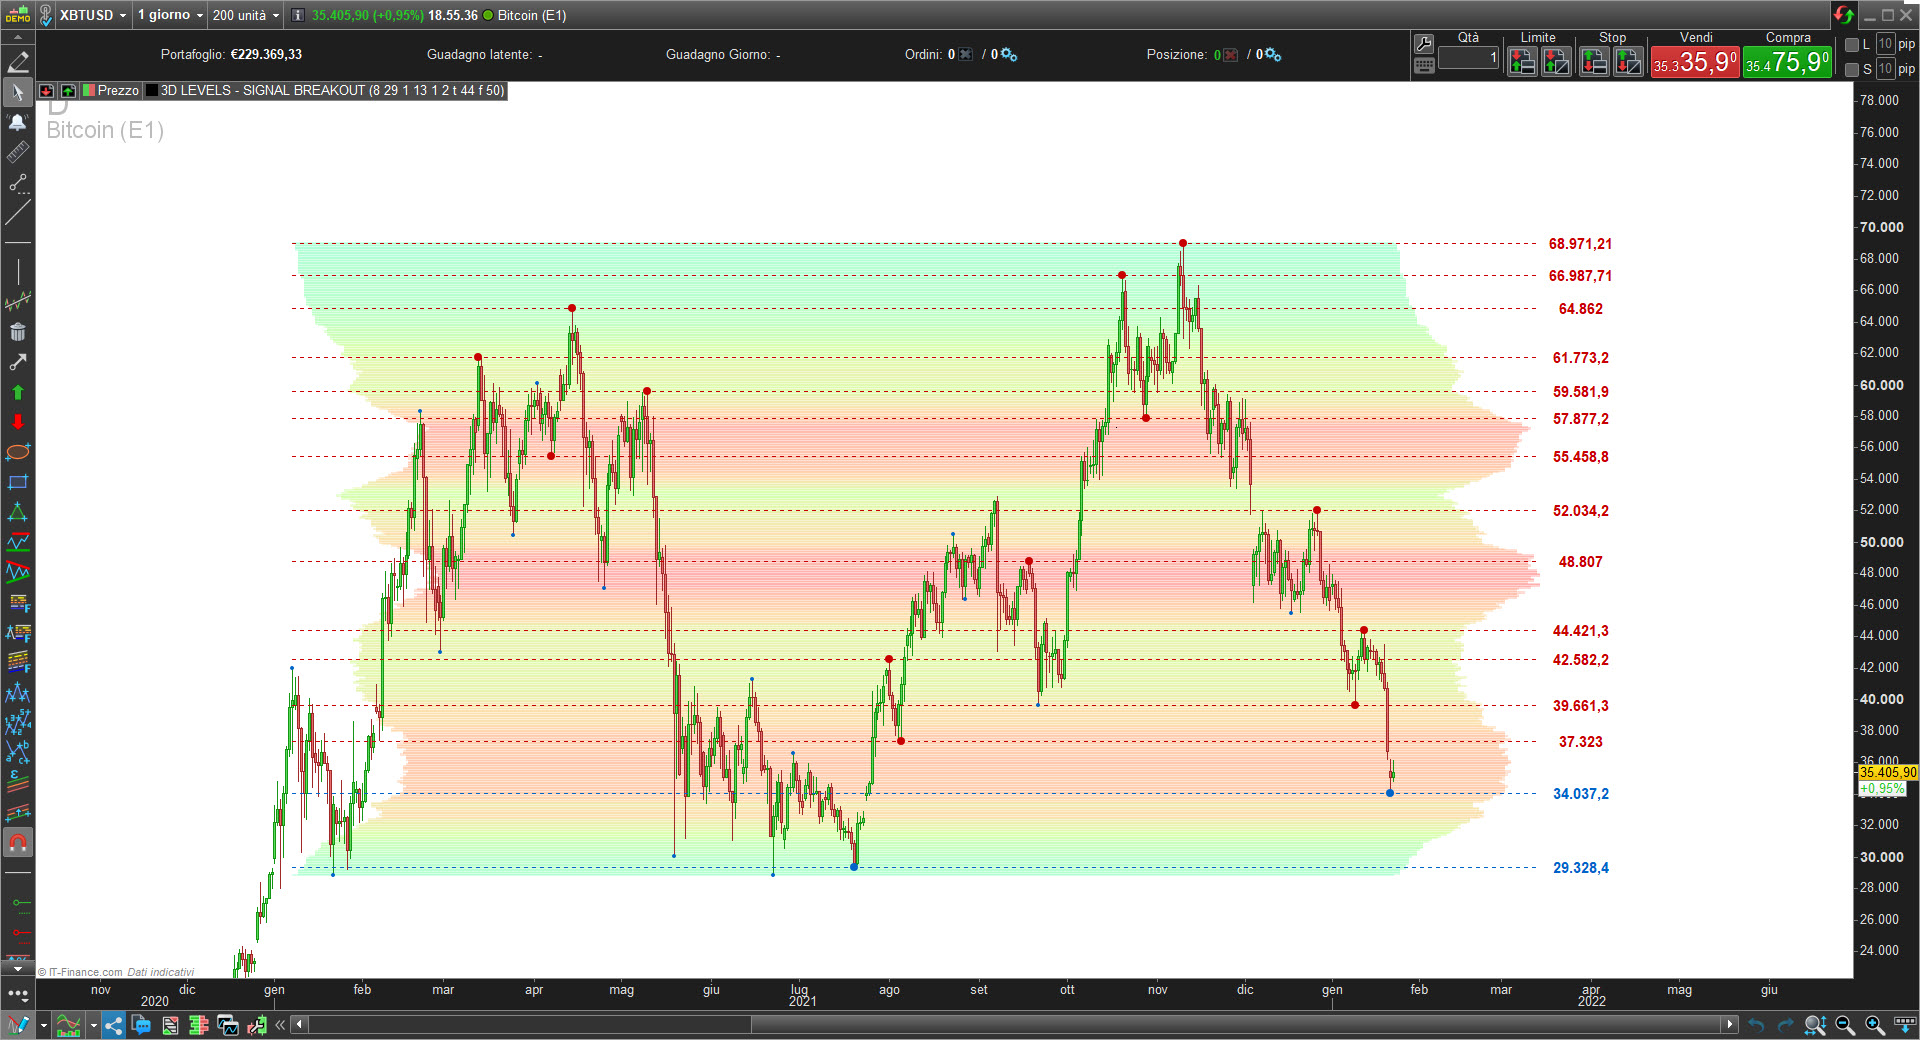
- By selecting the variable “MarketLevels = 3”:
- Detects supports, resistances and market shape, and plot on the graph corresponding segments with increasing thickness for decreasing market density. (A smaller thickness indicates a lower resistance or a minor support)
-
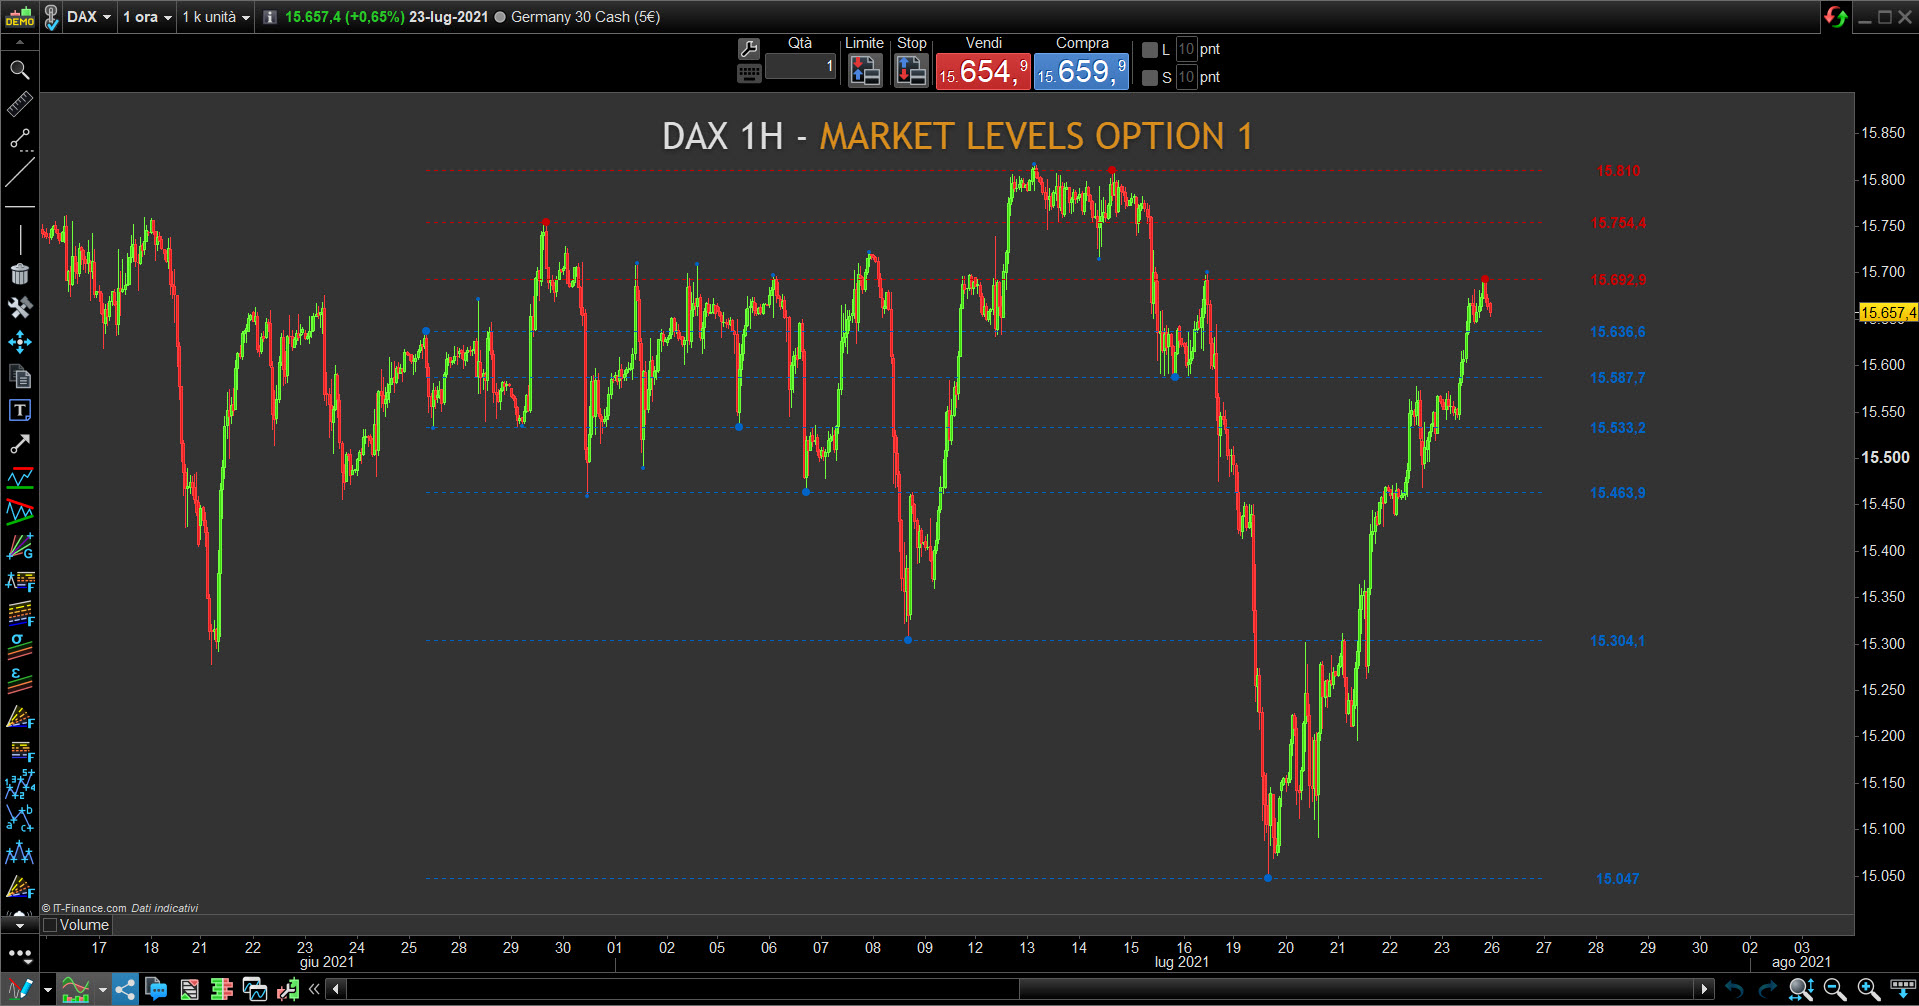
- Market Levels =1
-
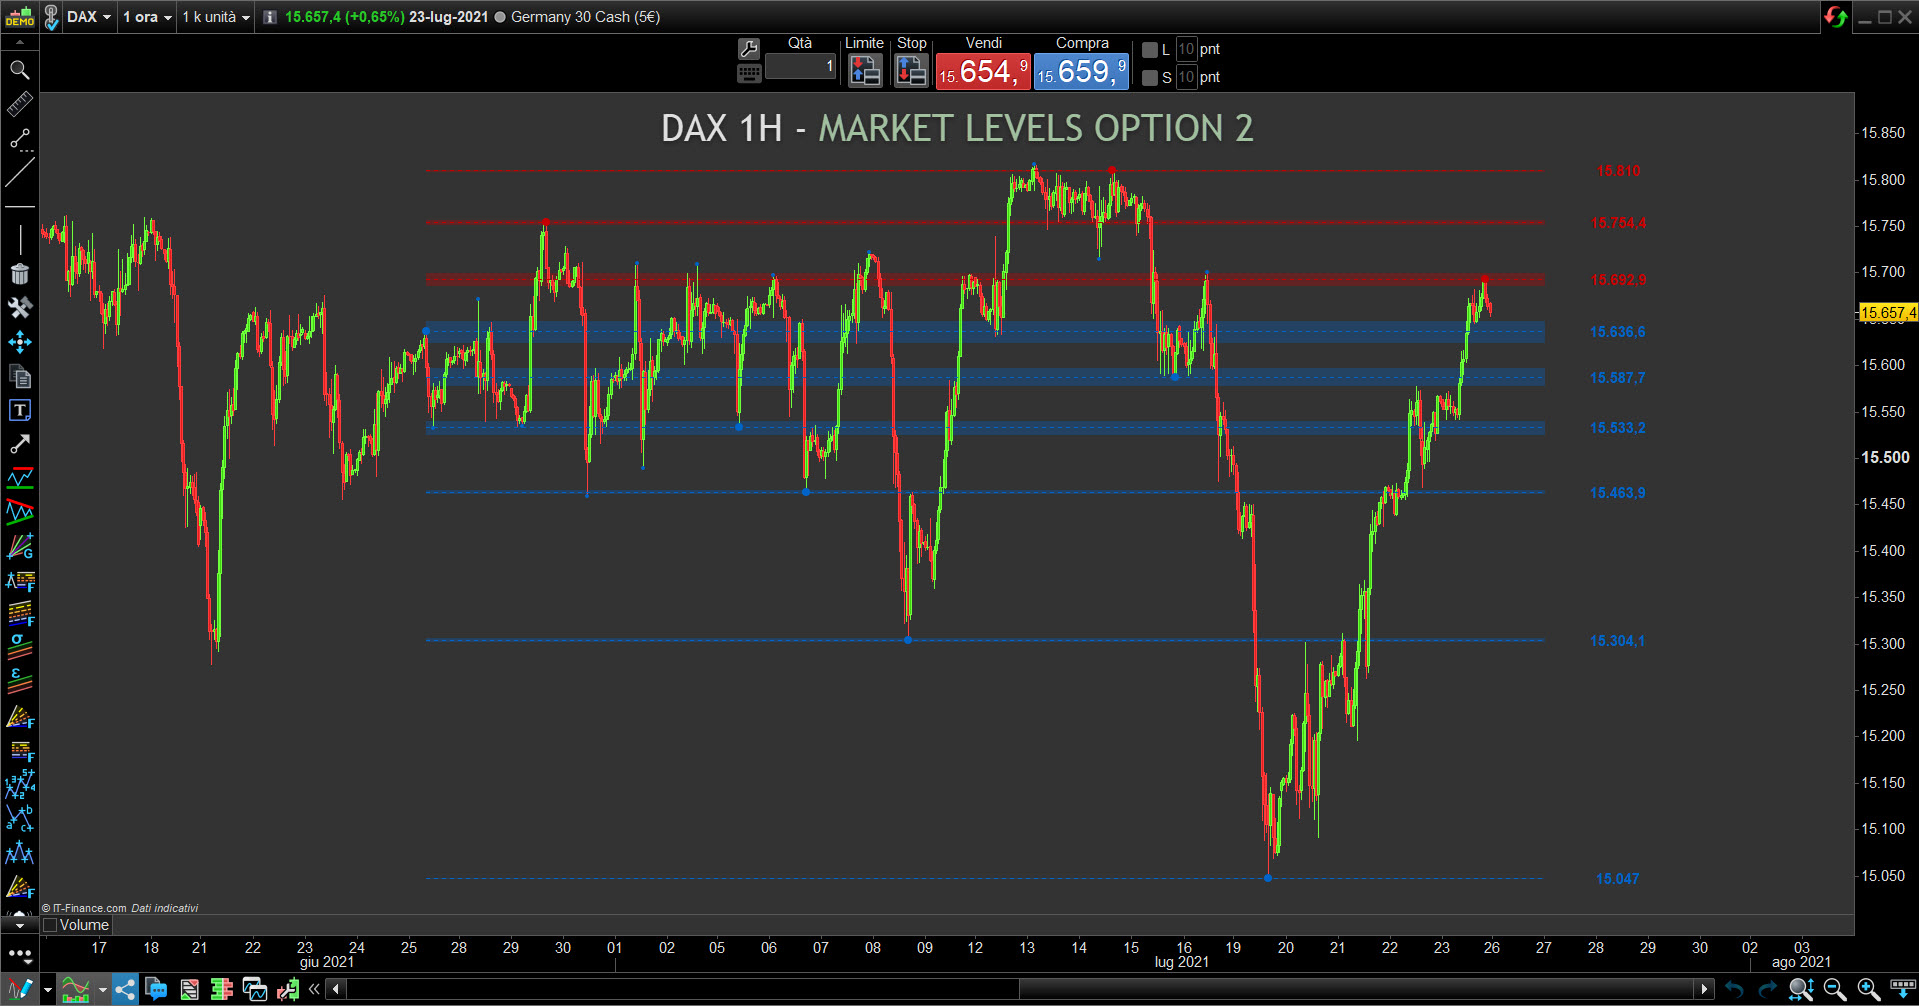
- Market Levels =2
-
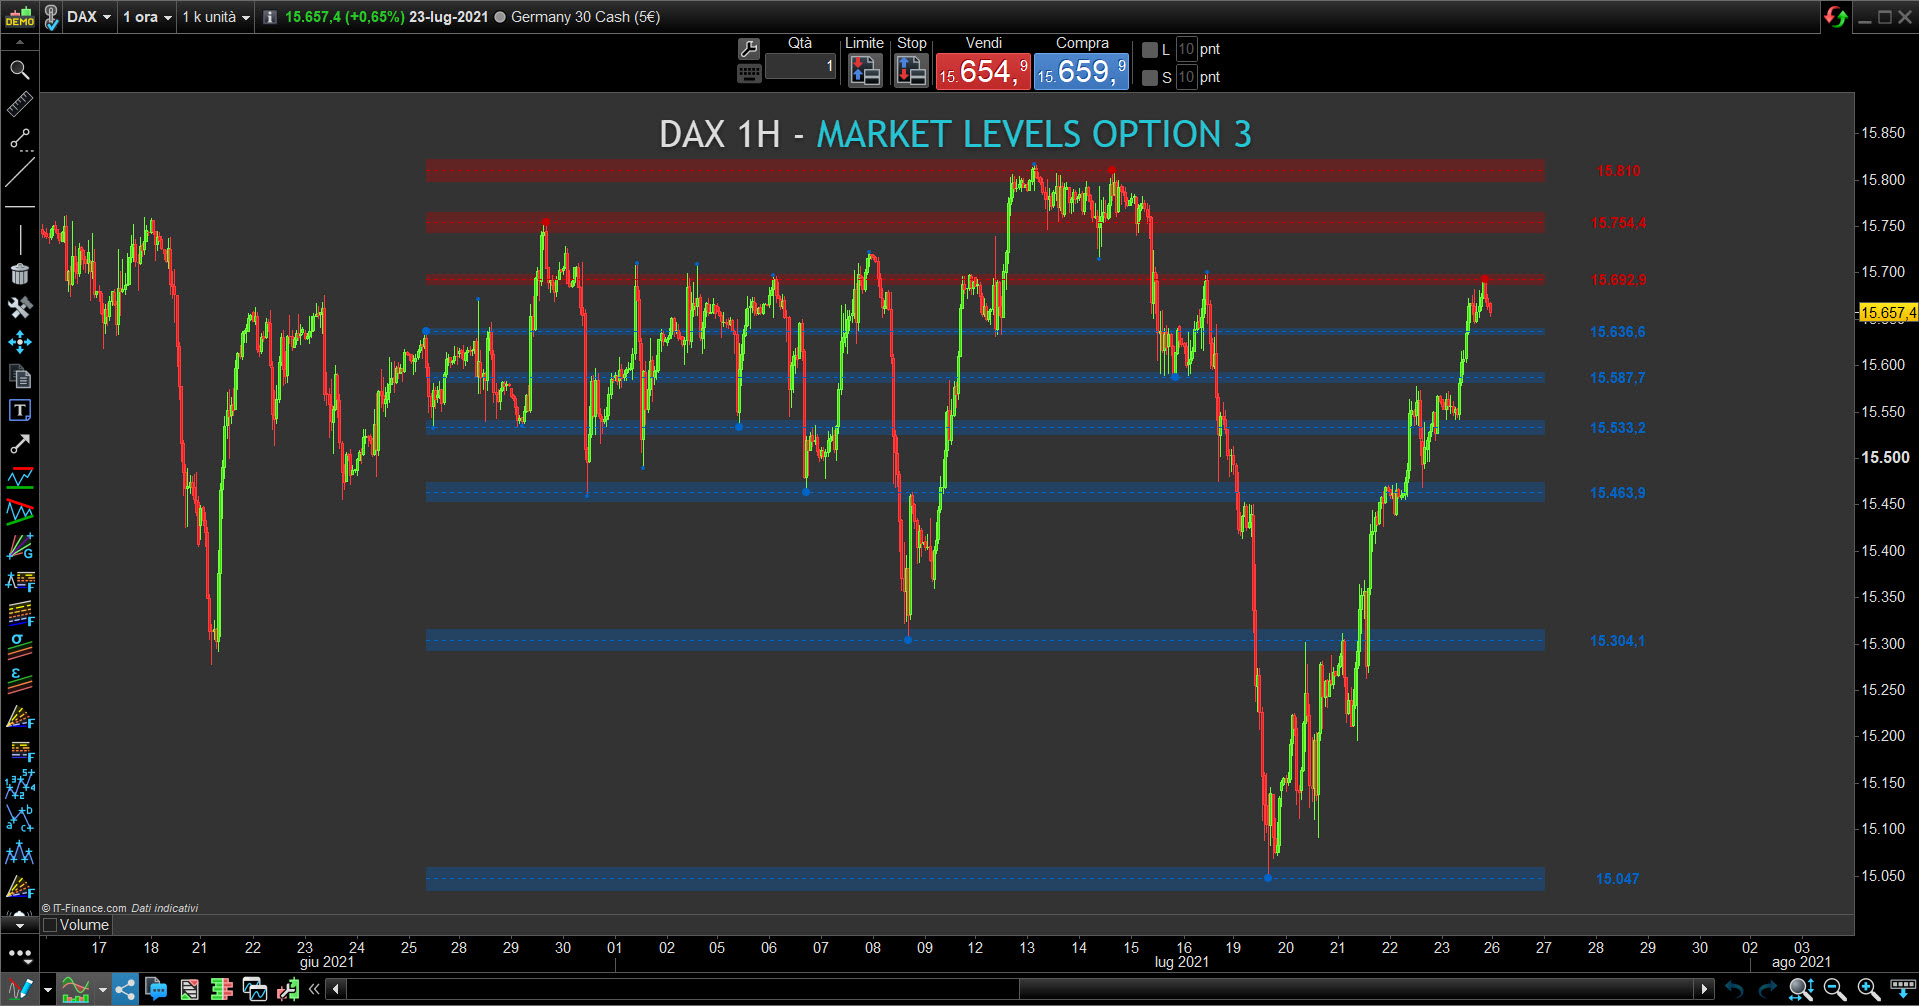
- Market Levels = 3
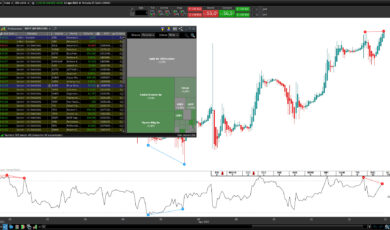
Volume shape and Market shape detection:
-
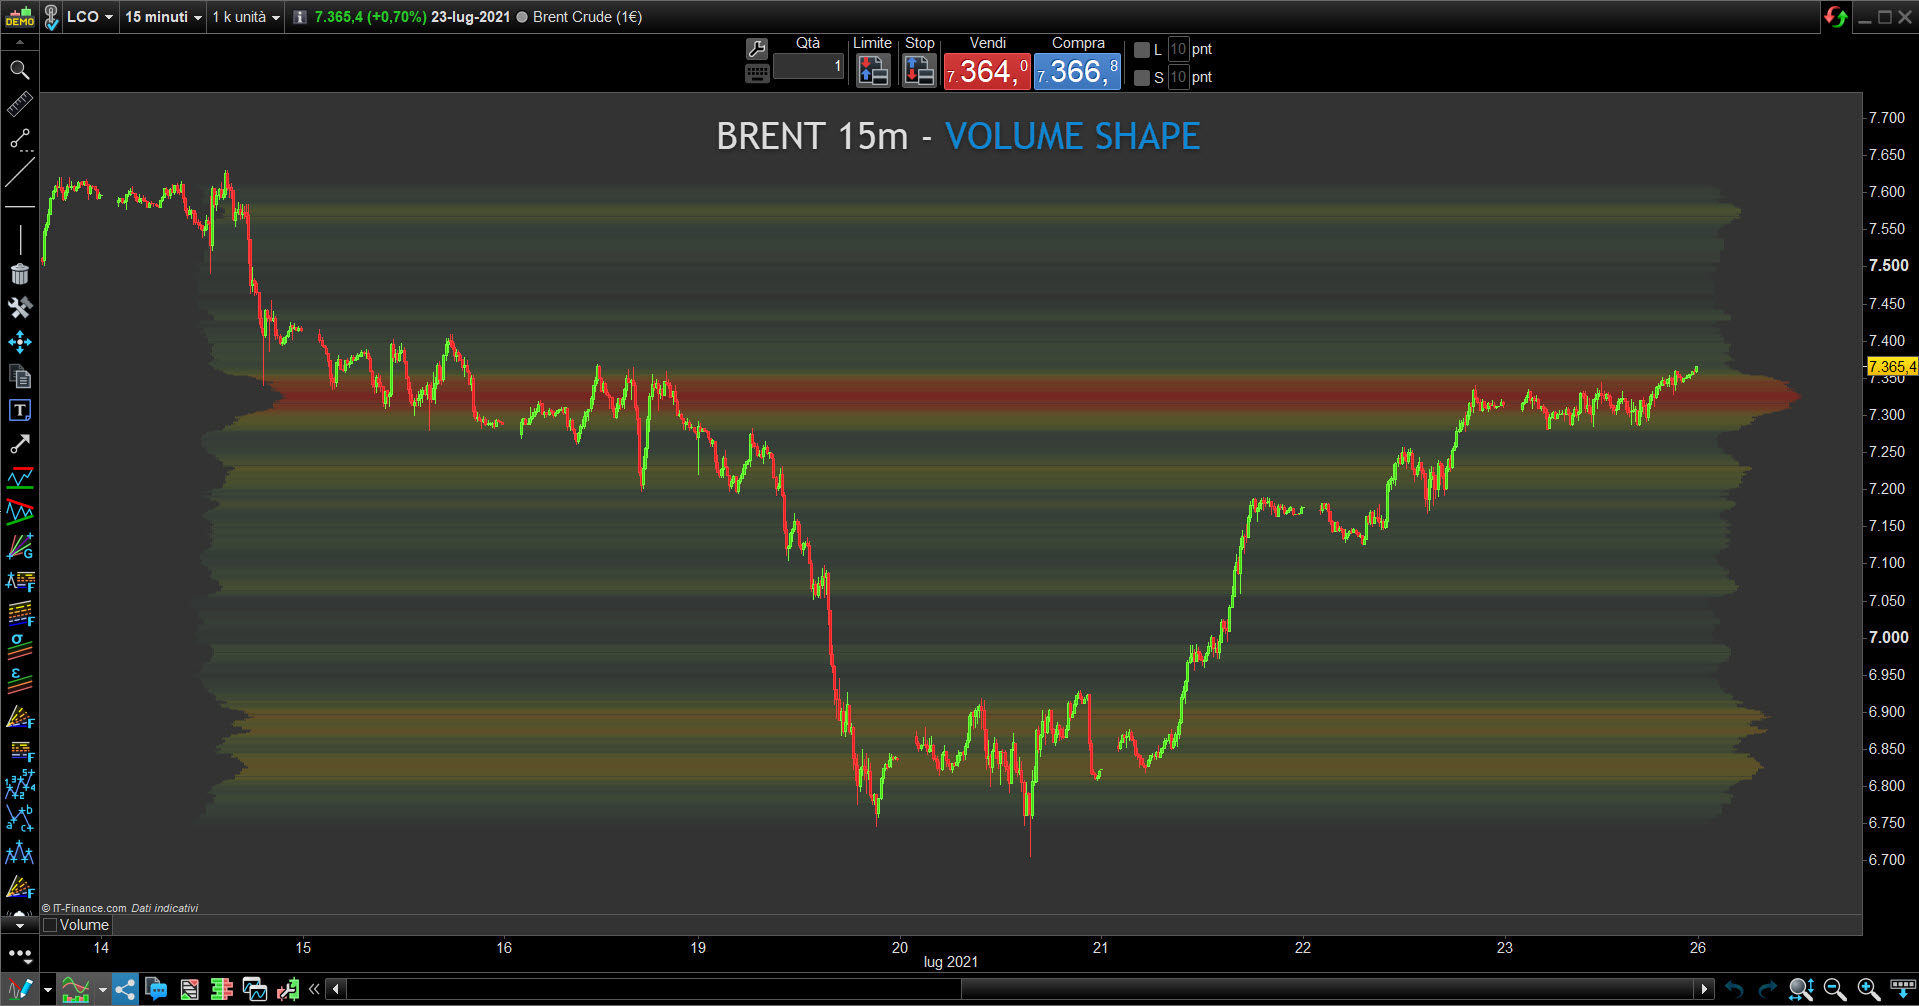
- Volume Shape
-
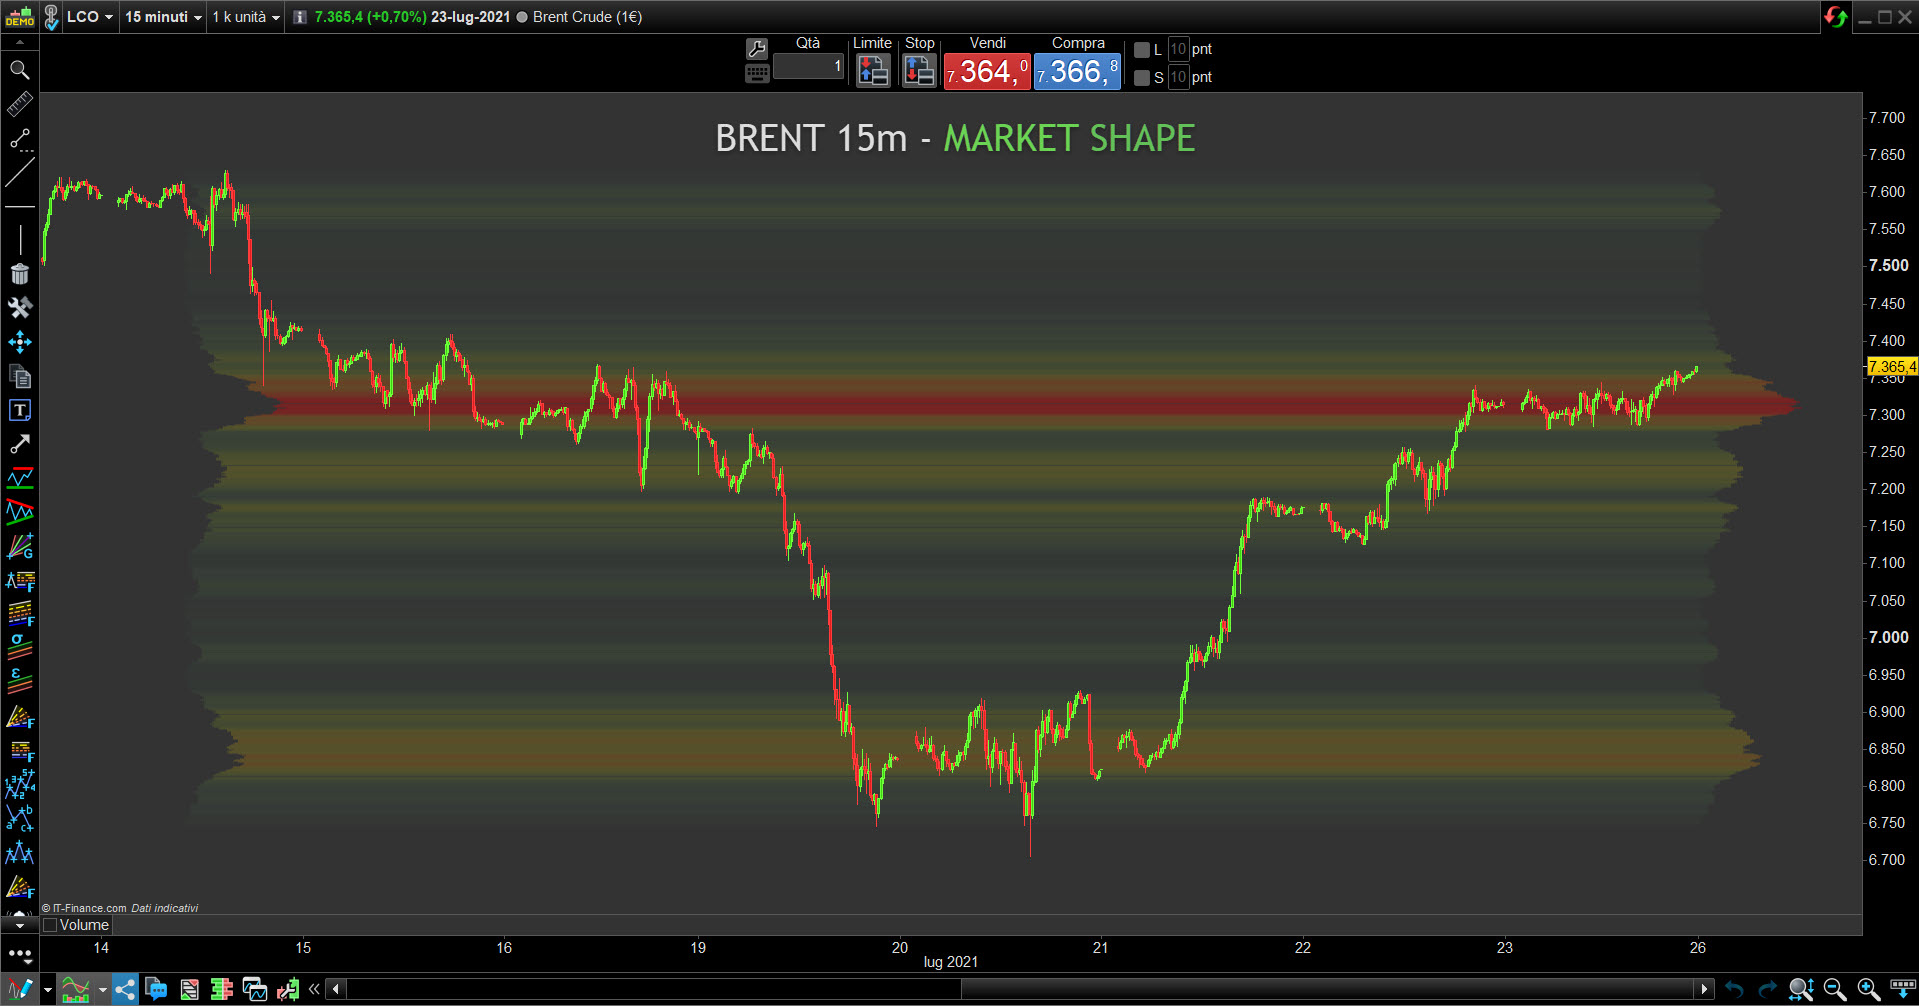
- Market Shape
- By selecting the variable “VolumeShape ” or “MarketShape”:
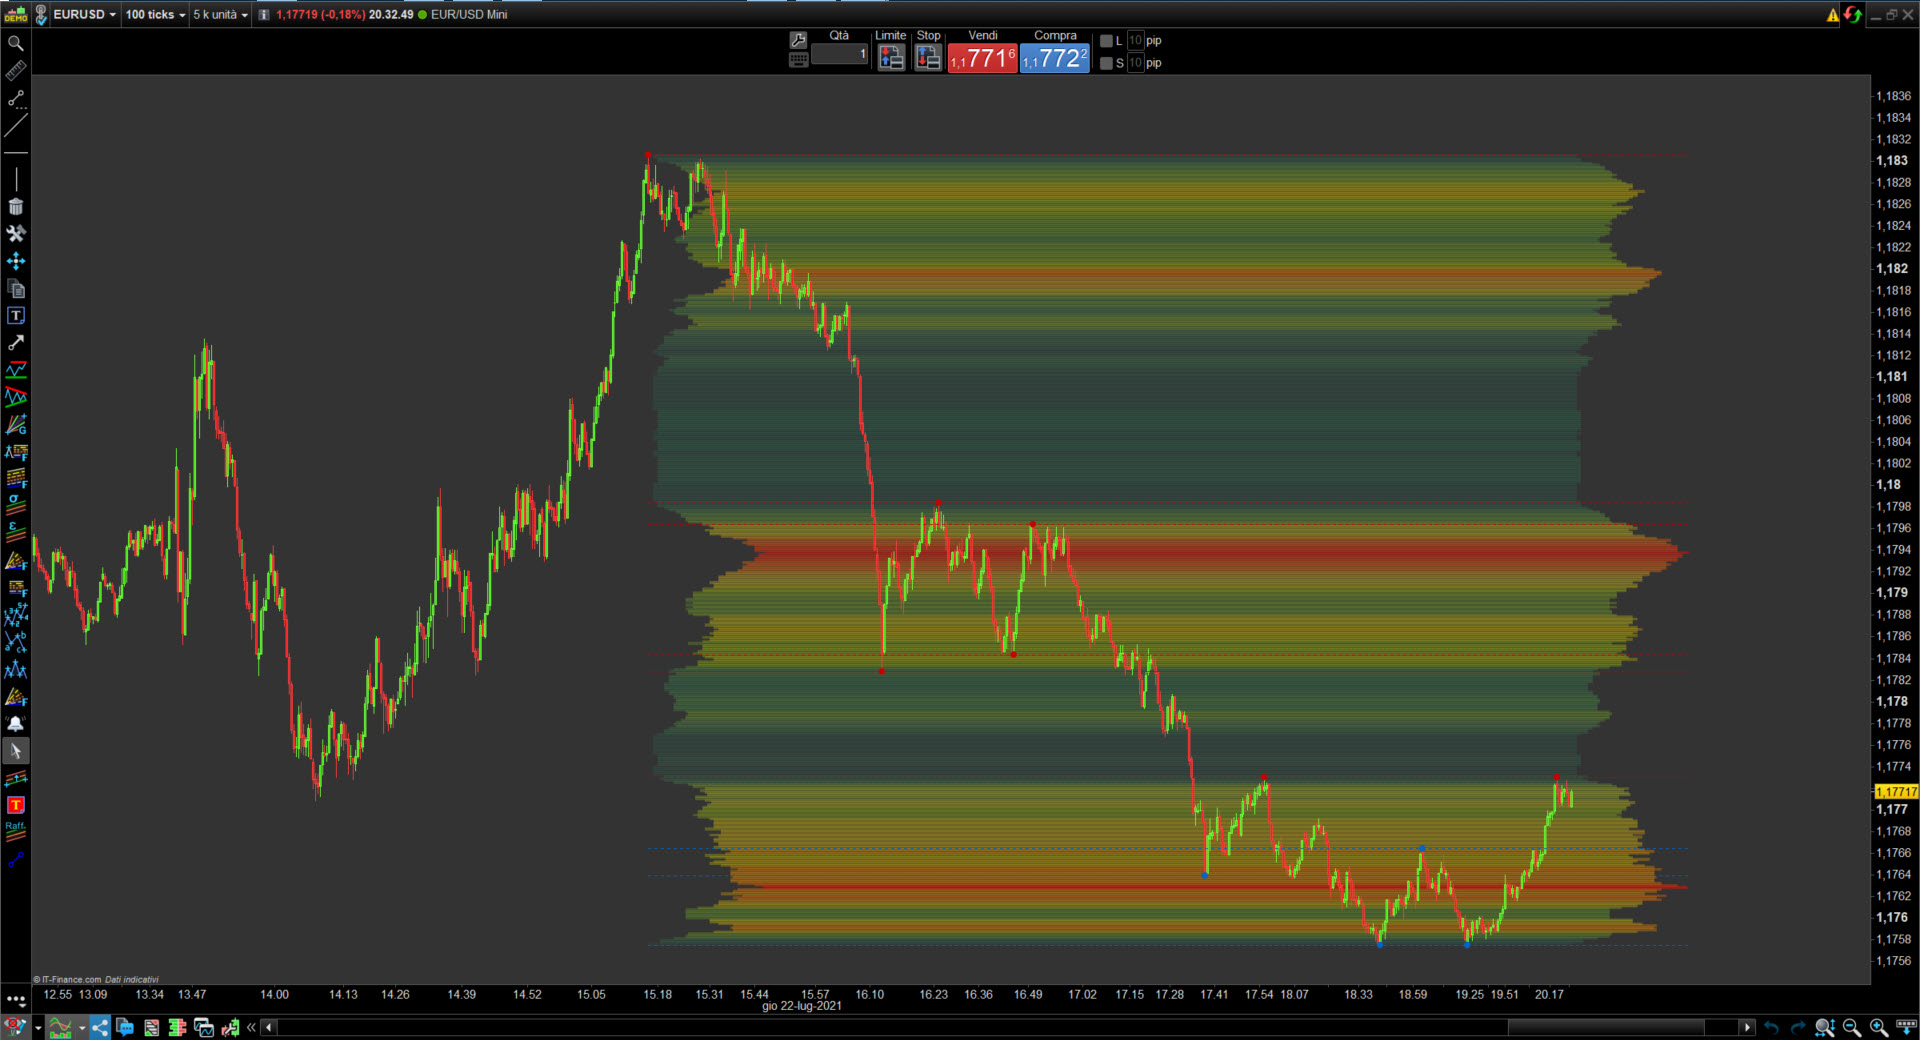
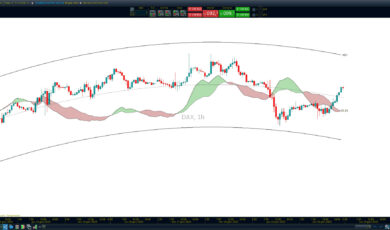
- The shape of volume by price and market shape will appear on the graph, graphically the shape has an undulating dimension, the valleys indicate a lower density of volumes or market, the peaks a greater density of volumes or market. The 3D shape chart is important, because the price movement has a significant correlation with the density of volumes or market, the following images show some examples. :
- A trading range is created around a peak
- the price tends to move from peak to peak
- the price tends to accelerate when crossing a valley
- The price tends to cross the entire area surrounding a peak.
- The shape of volume by price and market shape will appear on the graph, graphically the shape has an undulating dimension, the valleys indicate a lower density of volumes or market, the peaks a greater density of volumes or market. The 3D shape chart is important, because the price movement has a significant correlation with the density of volumes or market, the following images show some examples. :
-
- 3D Profile
-
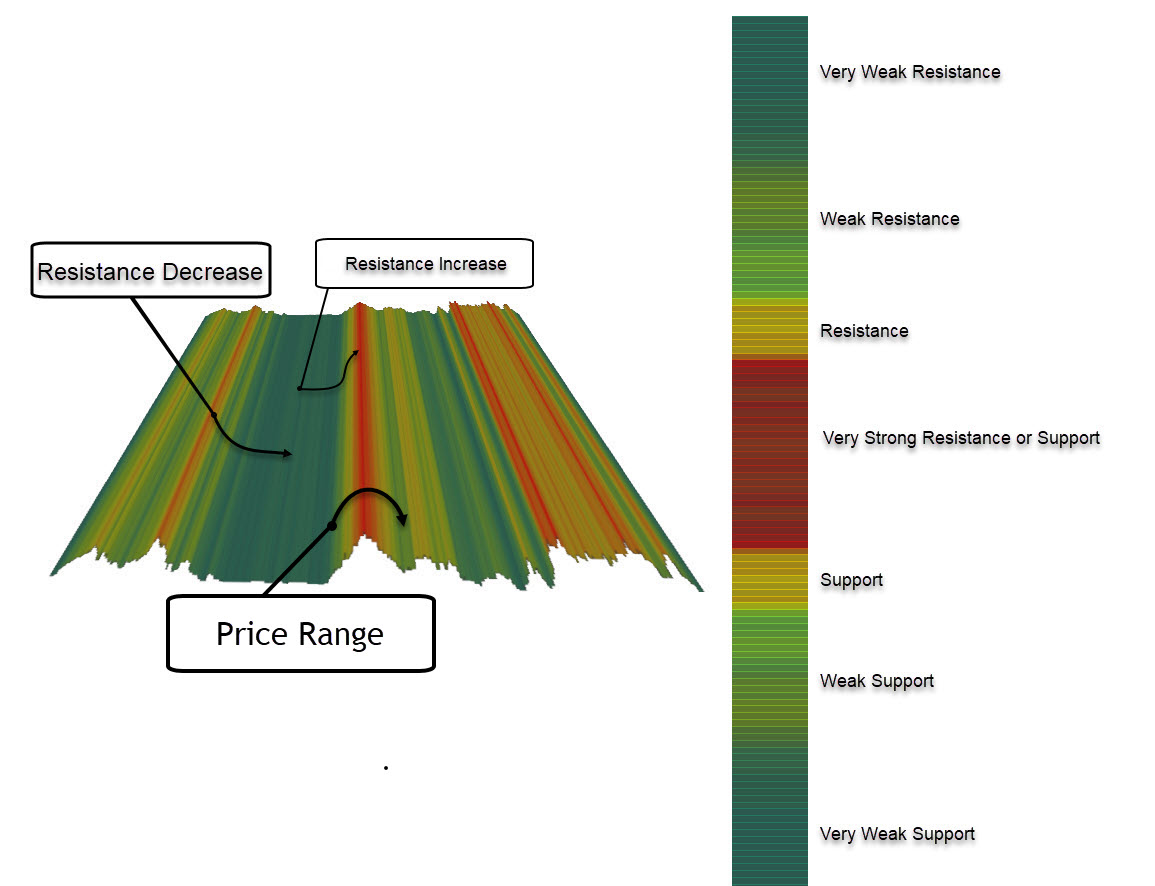
- 3D Profile Rules
-
- Estimate entry and exit order levels
-
- Predict levels of possible accelerations and decelerations of the price.
-
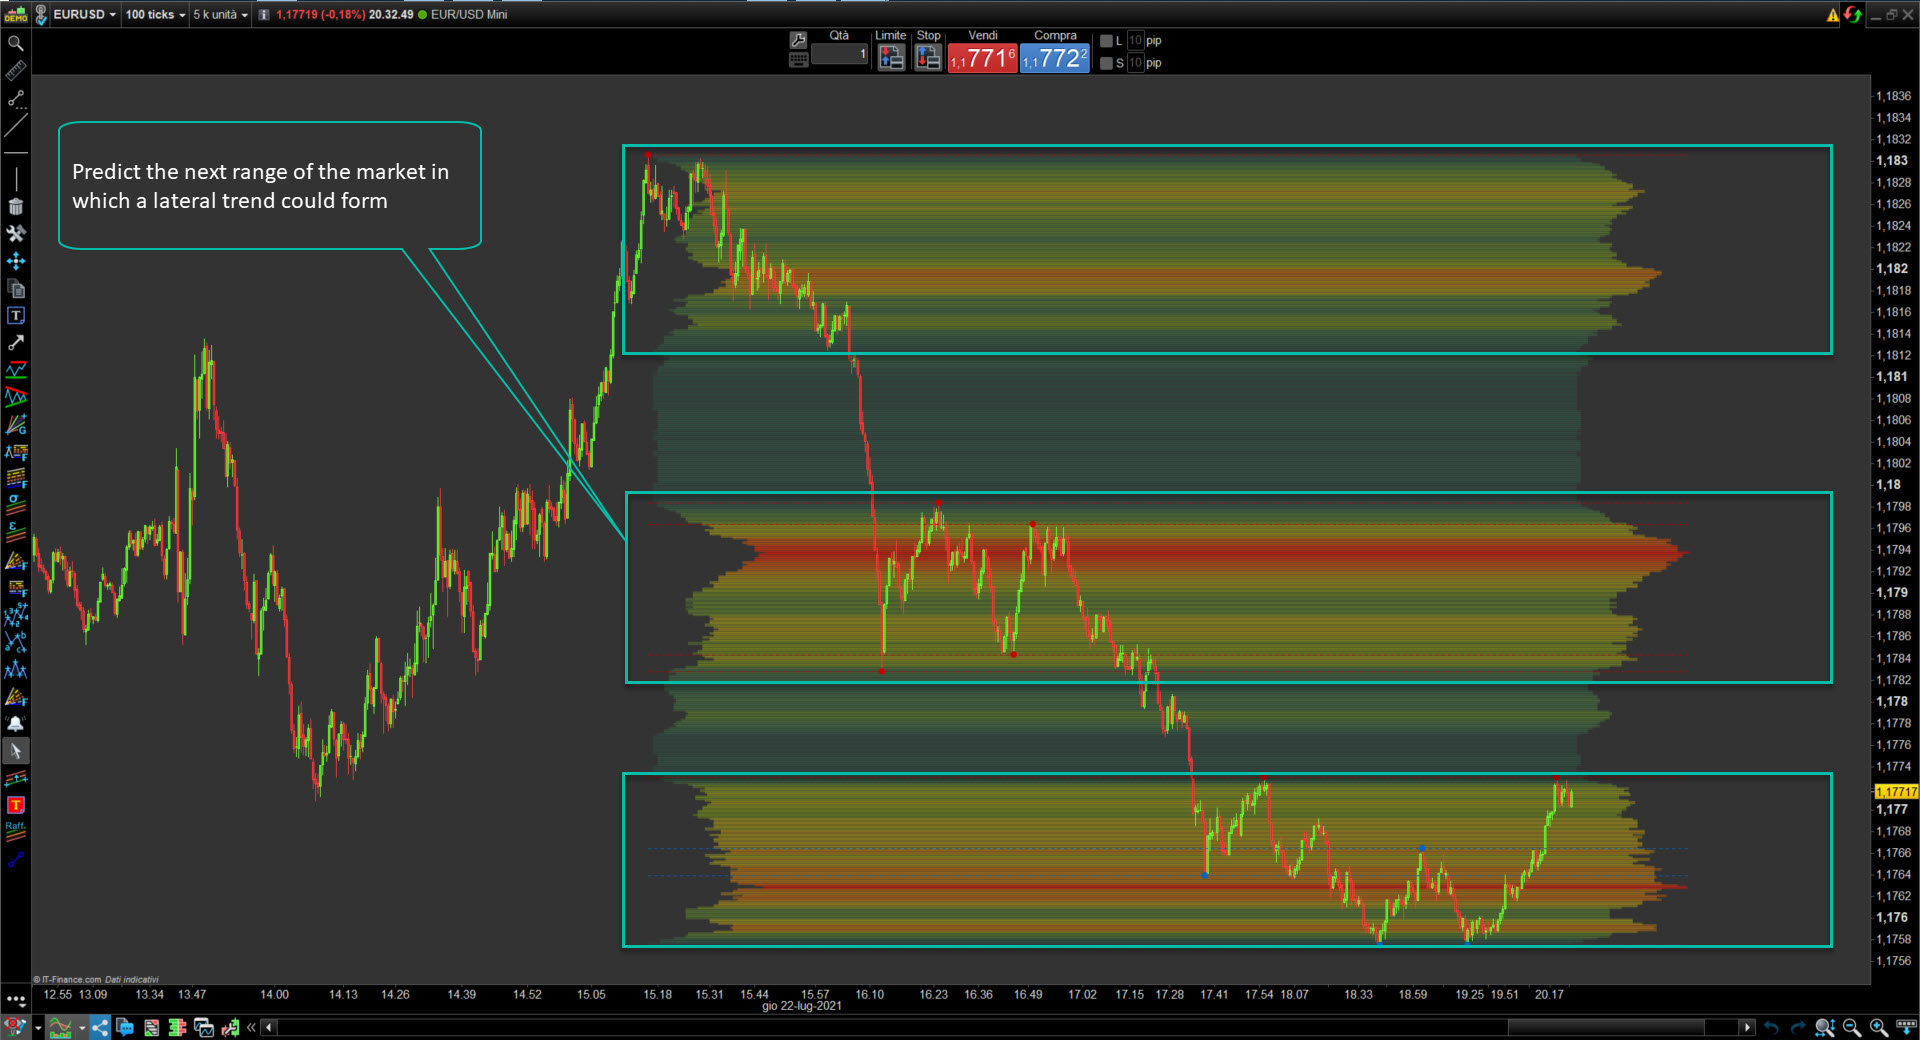
- Predict the next range of the market in which a lateral trend could form.
-
- psychological decision support
-
- Predict support and resistance
-
- Trading Range
-
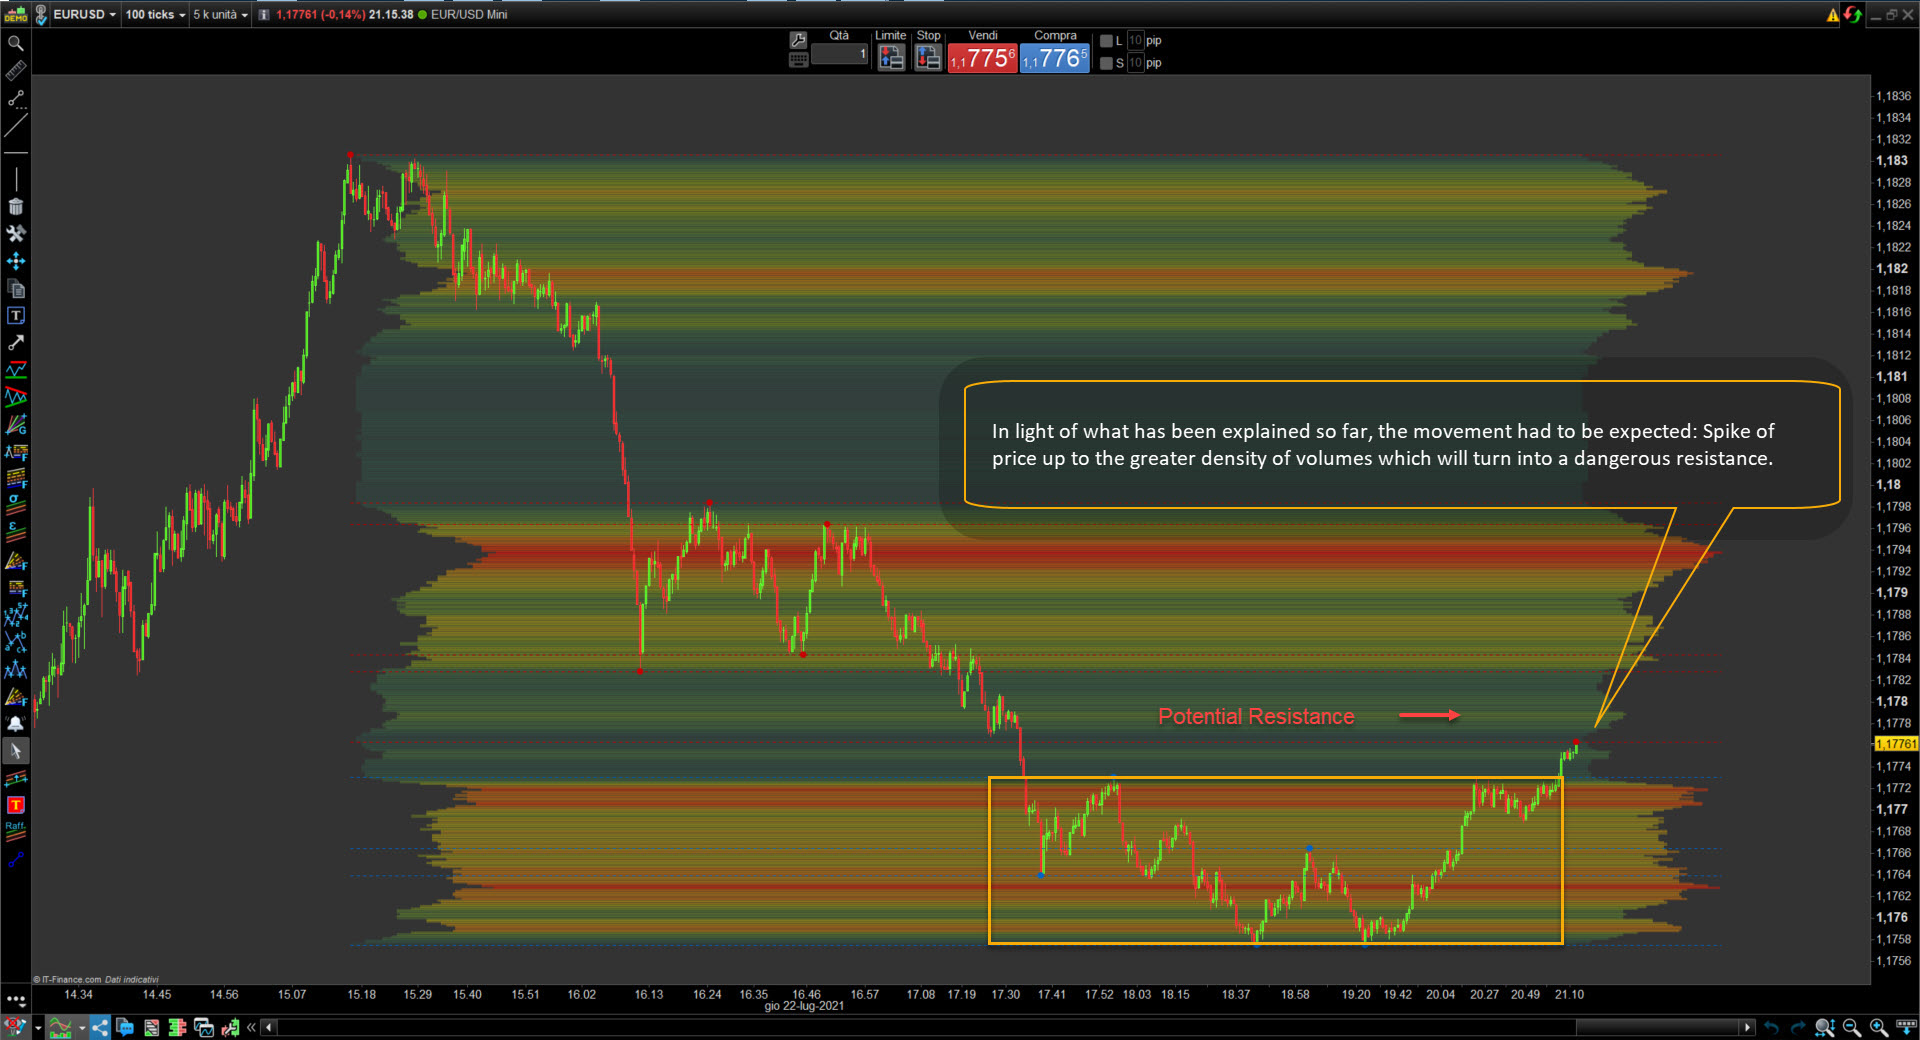
- Predict price’s spike
Remarks:
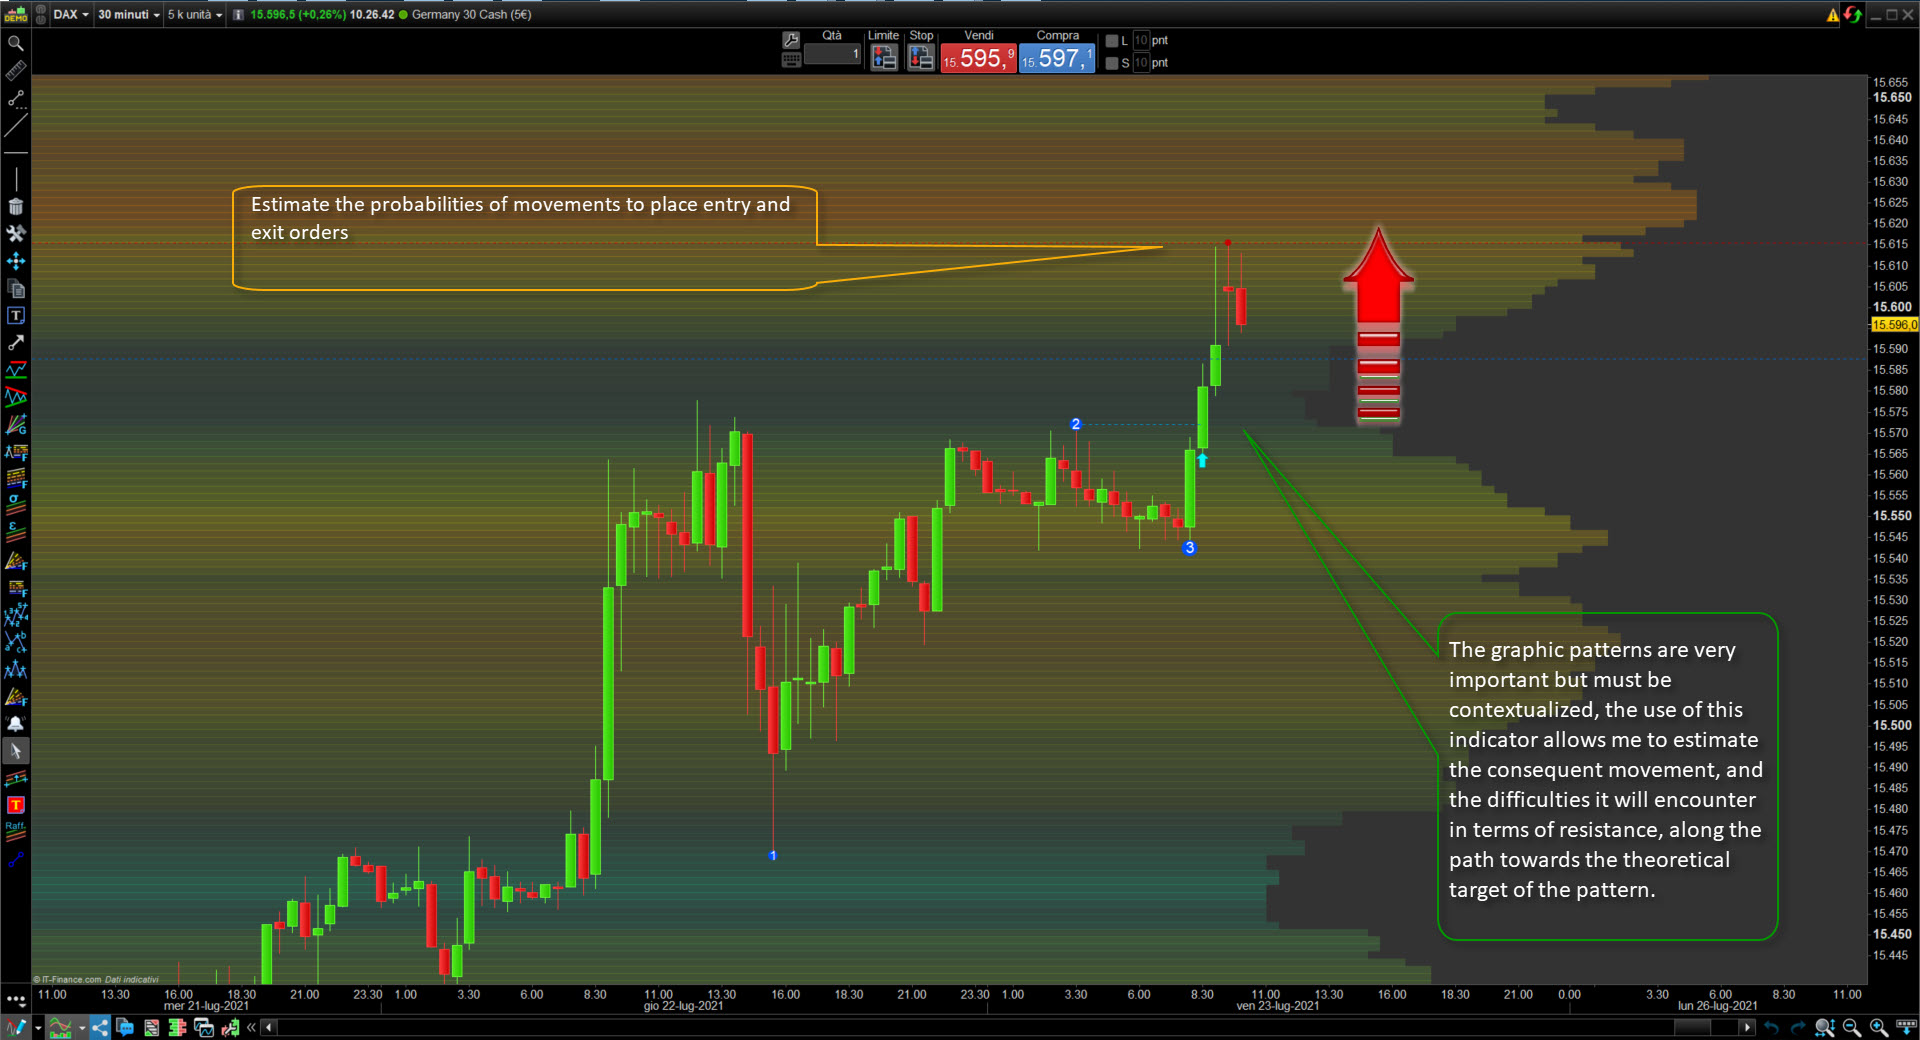
- The graphic patterns are very important but must be contextualized, the use of this indicator allows me to estimate the consequent movement, and the difficulties it will encounter in terms of resistance, along the path towards the theoretical target of the pattern.
- The movement of prices depends on the drivers of the market in question. The impact of daily news must be able to be quantitatively contextualized, and the “density” of the price or volumes by level helps to estimate the possible relative movement.
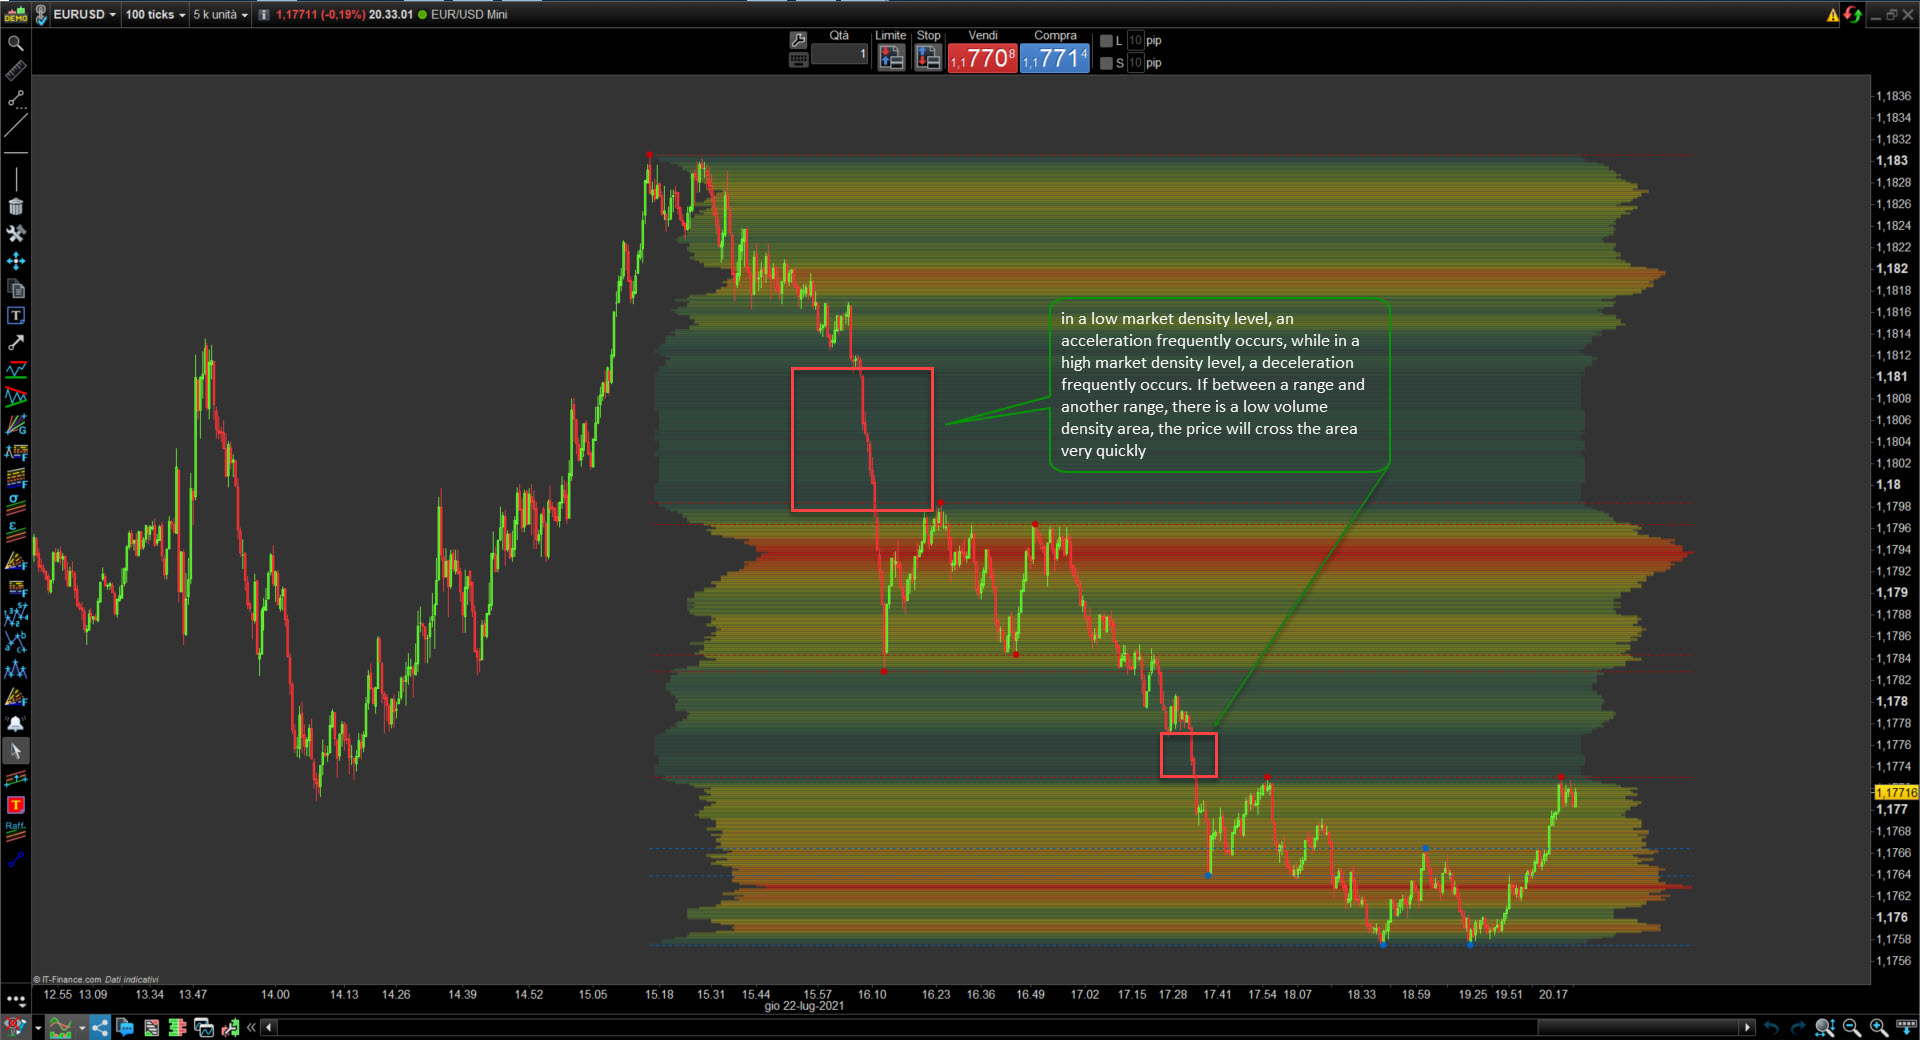
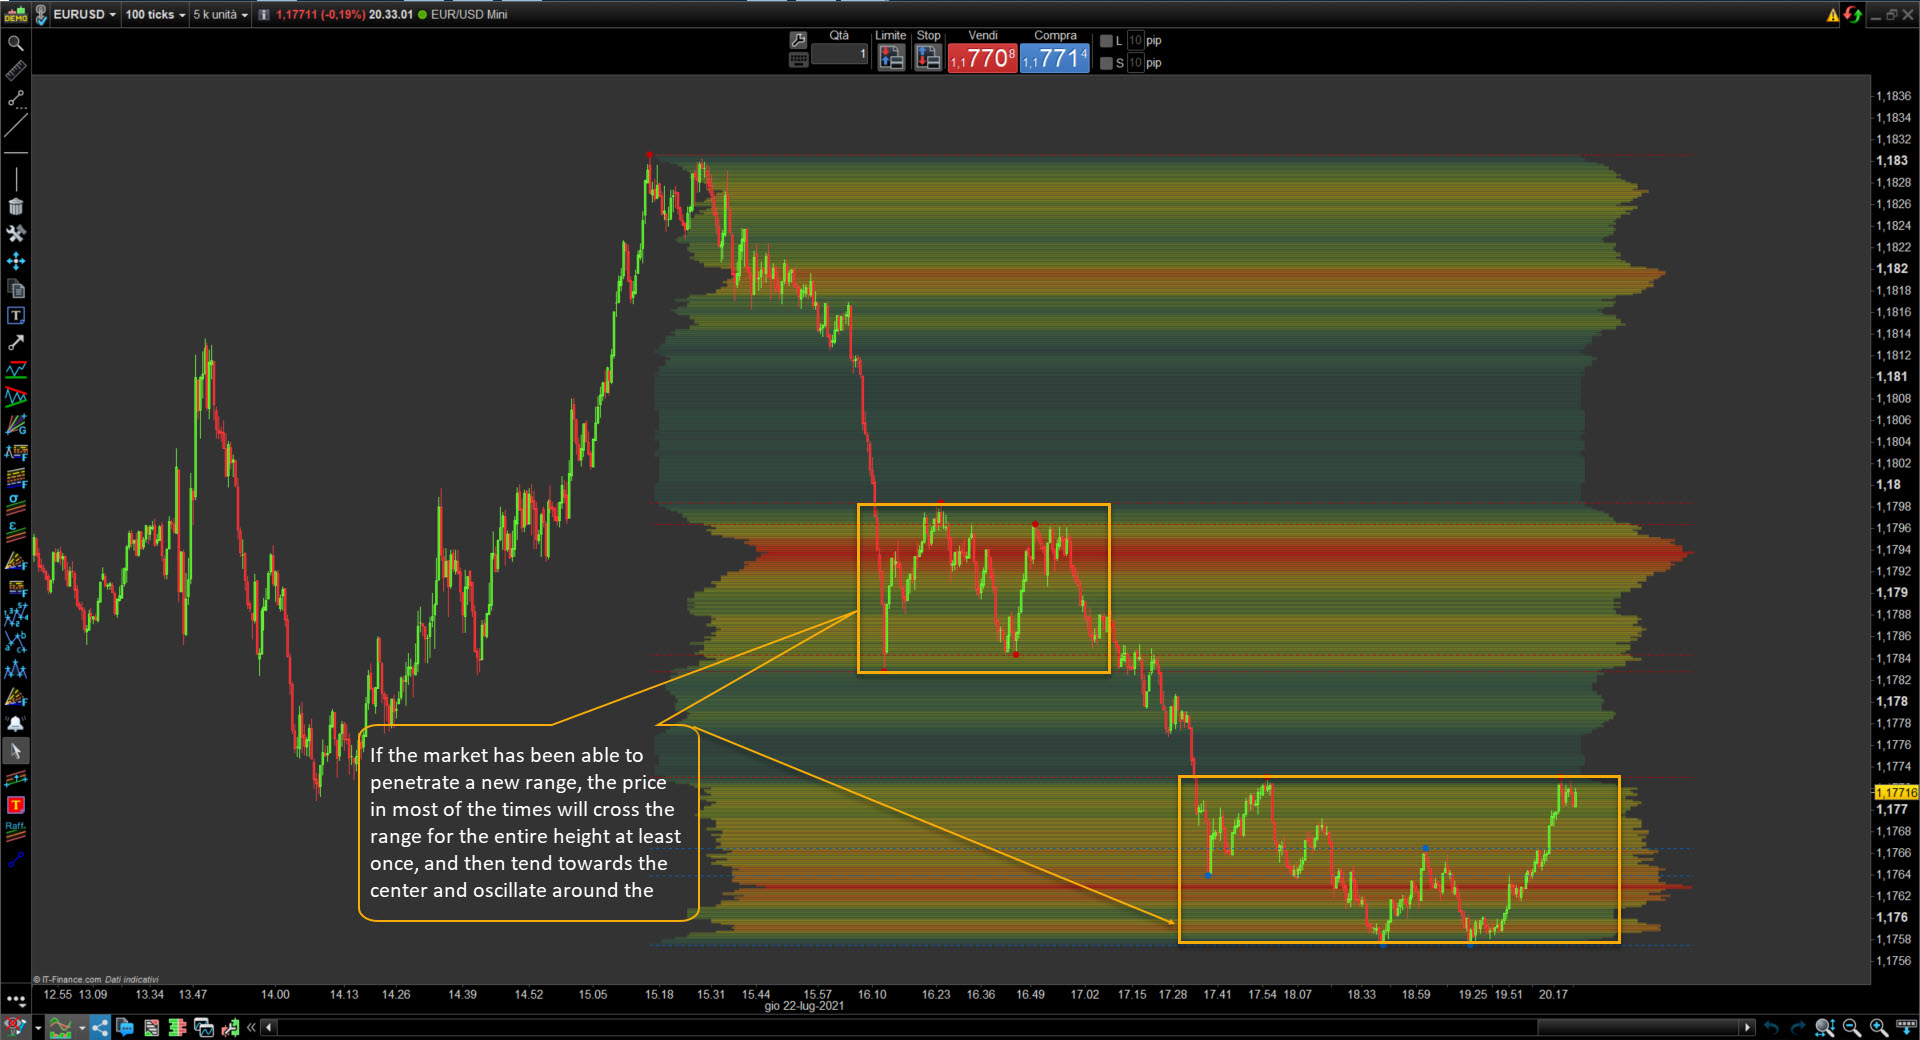
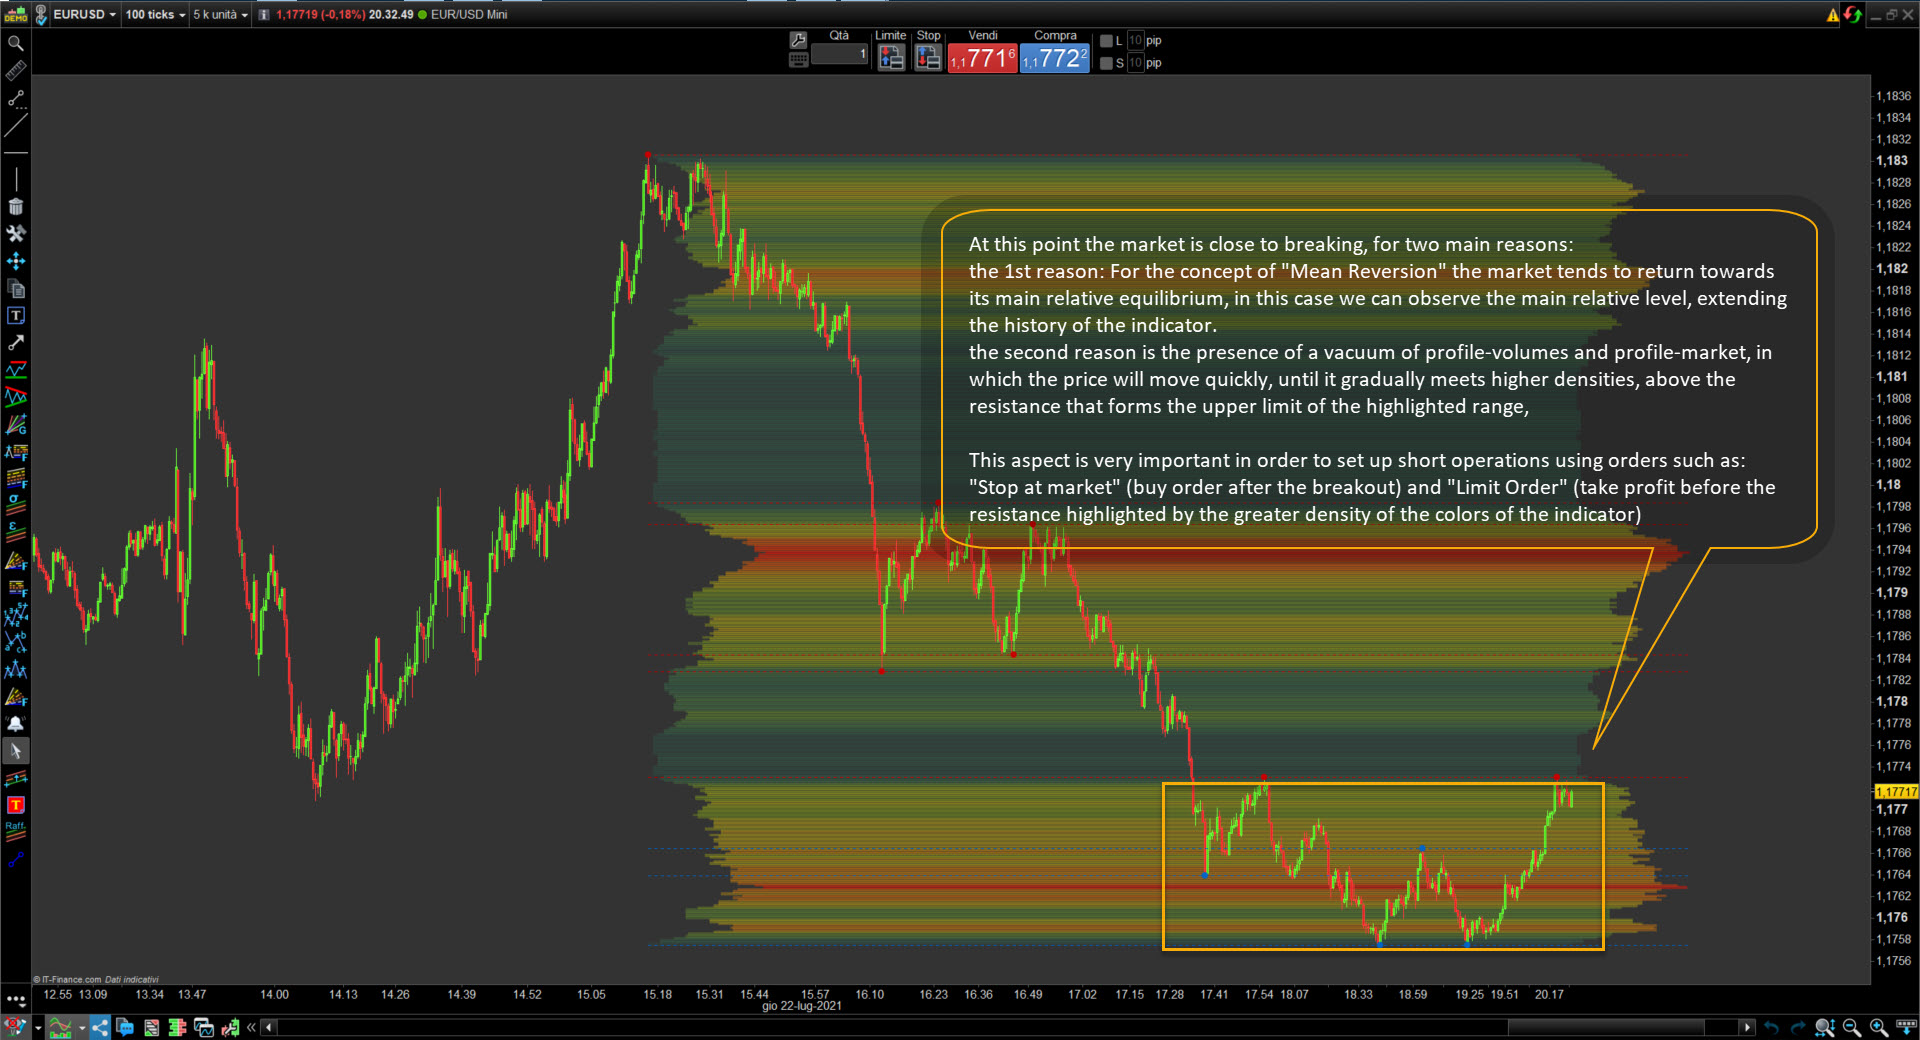
- Thanks to this indicator, the relationship can be appreciated: in a low market density level, an acceleration frequently occurs, while in a high market density level, a deceleration frequently occurs. If between a range and another range, there is a low volume density area, the price will cross the area very quickly. If the market has been able to penetrate a new range, the price in most of the times will cross the range for the entire height at least once, and then tend towards the center and oscillate around the center of the range.
INDICATOR’S INTERFACE
-
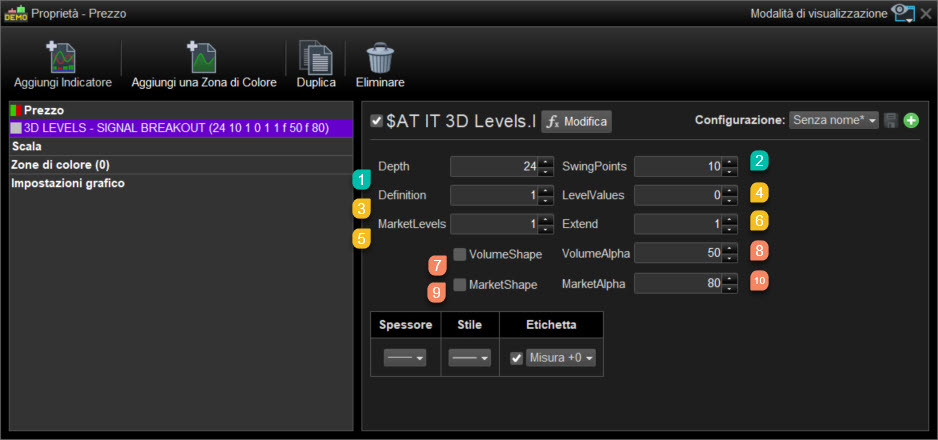
- INTERFACE
- Depth: Value of the period, between a new maximum and a new minimum to detect swing points.
- SwingPoints: Number of points of swing detected in the past.
- Definition: Increase or decrease the definition of levels. The more the definition increases, the more levels will be determined.
- LevelValues: Show levels values and regulate distance
- MarketLevels: Show segments of levels, in 3 different options:
- Support and Resistance
- Support and Resistance by volume shape
- Support and Resistance by market shape
- Extend: Extend the segments
- VolumeShape: Shows the density of volumes by price levels
- VolumeAlpha: Transparency of the colors
- MarketShape: Shows the density of market by price levels
- MarketAlpha: Transparency of the colors
HOW THIS INDICATOR CAN HELP YOUR ANALISYS:
- Understanding the beginning of a potential lateral price trend within a range.
- Understanding the beginning of a potential directional trend.
- Predict the resistances that a directional trend will encounter.
- Predict the next range of the market in which a lateral trend could form.
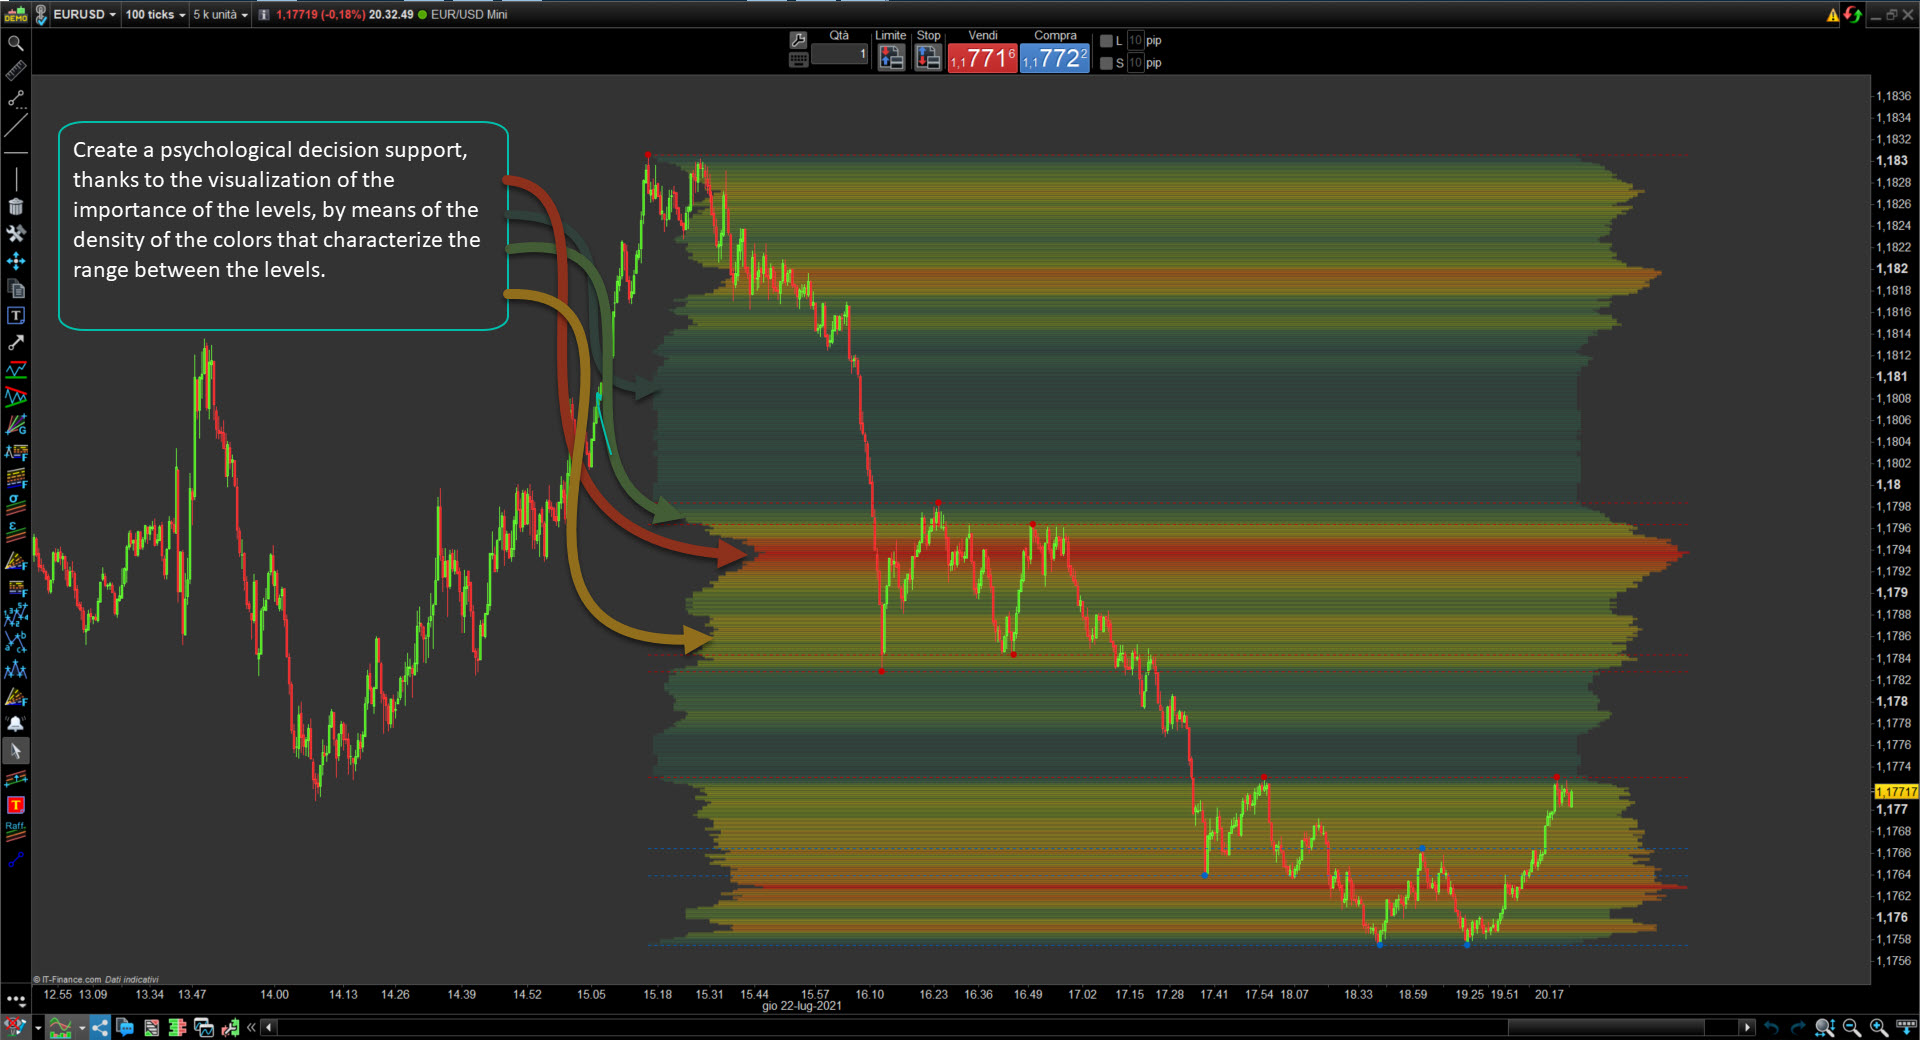
- Create a psychological decision support thanks to the visualization of the importance of the levels, by means of the density of the colors that characterize the range between the levels.
- Predict levels of possible accelerations and decelerations of the price.
- Estimate the probabilities of movements to place entry and exit orders
————- LIFE TIME LICENCE ————-
GenPips (verified owner) –
I’m using Volume shape function.
When you know the trend, this indicator makes your trades near to the perfection.
I recommend it.
d_maassen (verified owner) –
I use this indicator together with the PRT RENKO indicator (also available from AutomaticTrading). Since I am still quite inexperienced in CFD trading, these indicators help me to find good entry points and take profit levels, as well as to positively influence my tendency to overtrade. I struggled with myself for a long time whether I should buy the indicators, as the purchase price for both indicators seem expensive at first glance (for my small budget). But already in the first week I brought back half of the purchase price and the equity curve of my trading account is finally pointing in the right direction. In addition, the e-mail support should be mentioned positively, even on a weekend you get quick and competent feedback. I would also have been satisfied with the feedback on the following Monday, everyone needs a little break from work after all :).
All in all, I can only recommend this vendor and will certainly purchase one or the other useful indicator in the future.