
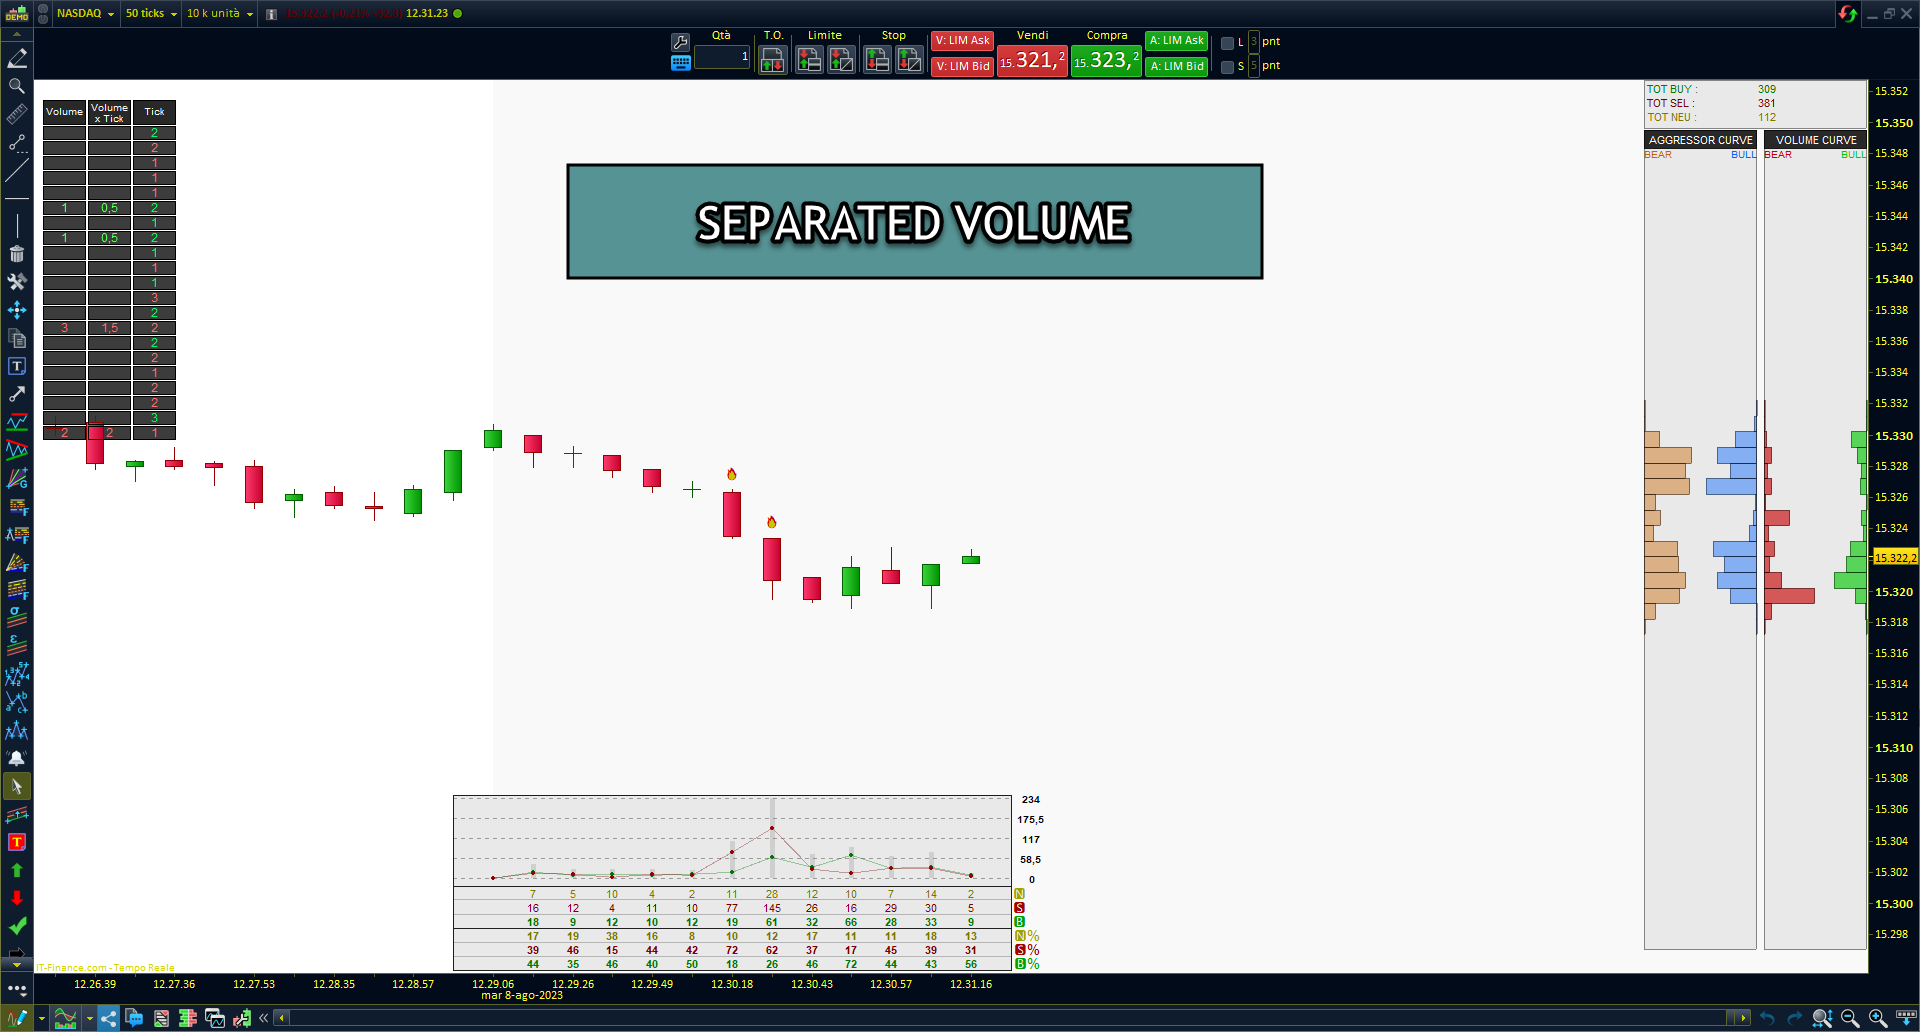

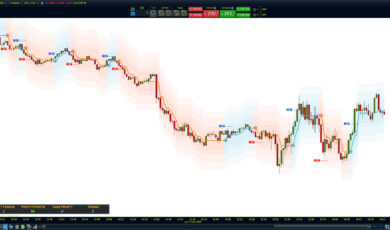
This quantitative indicator provides a detailed view of the participation of buyers and sellers, allowing traders to better understand market dynamics..
Advantages:
Using separate volumes to distinguish between buyers and sellers provides a more detailed view of market behavior, enhancing the understanding of market dynamics and increasing the likelihood of successful trading operations.
If you have access to separate volumes, that is, knowing how many buyers and sellers are in action, the benefits of the volume indicator become even more significant:
Quantitative Volume Analysis can provide valuable information, such as:
- Strength of Buying and Selling Pressure: By comparing the volumes attributed to buyers and sellers, you can assess the strength of buying and selling activity during a specific price movement.
- Confirmation or Divergence: Analyzing volume in relation to price movements allows you to identify whether the volume confirms or diverges from price trends. For example, if prices are rising on high buying volume, it might indicate a strong bullish trend.
- Reversal Signals: Unusual volume patterns, like high selling volume during an uptrend, could indicate a potential reversal or a shift in market sentiment.
- Breakouts and Breakdowns: High volume during breakouts or breakdowns of key levels can confirm these price movements.
- Market Participation: Separating volumes between buyers and sellers can provide insights into which group is driving the market at a given moment.
- Analysis of the imbalance between buyers and sellers: You can see who has control over the market, whether there are more active buyers or sellers. A higher buying volume may indicate potential price growth, while a higher selling volume might suggest a potential decline.
- Identification of trend reversals: Separate volumes allow you to identify changes in the ratio between buyers and sellers. This can help you identify more precise potential trend reversal points.
- Trend strength analysis: You can assess the strength of a trend by observing the increase in buying or selling volume. A trend with increasing volume may be more robust and lasting.
- Risk management: Knowing the number of buyers and sellers can help you make more informed risk management decisions, such as placing stop-loss or take-profit levels at strategic points.
- Confirmation of trading signals: Separate volumes can confirm the validity of trading signals generated by other indicators or technical analysis strategies.
As for the Gaussian curve composed of separate volumes, represented as a chart with price on the Y-axis and an histogram of total volumes per price level on the X-axis, it provides a clear visualization of volume distribution in the market. This chart, known as “Volume Profile,” offers several advantages:
Identification of key trading points: The Volume Profile displays price levels with the highest volume, known as “Point of Control.” These levels indicate where most of the trading activity is concentrated and can act as supports or resistances.
Visualization of areas of interest: The Volume Profile easily helps you identify zones with high or low volume, aiding in spotting potential accumulation, distribution, or congestion zones.
Risk management: The Volume Profile can assist you in determining key stop-loss and take-profit levels, based on the points of control and equilibrium prices.
Confirmation of breakouts: The Volume Profile can confirm or question price level breakouts. A breakout with significant volume might indicate a stronger validity of the breakout.
Liquidity analysis: The Volume Profile shows the distribution of liquidity in the market, helping you identify areas of higher activity or volatility.
In conclusion, using separate volumes and representing the Volume Profile with a Gaussian curve provides a detailed and comprehensive view of the market, enabling you to make more informed trading decisions and improve your analytical and strategic abilities.
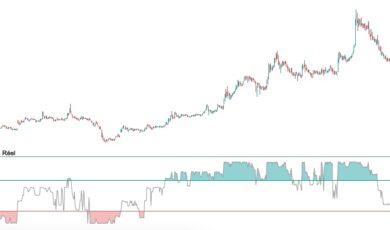
A very interesting example of accumulation that I was able to capture:
“The increase in bullish volumes during a downward phase can be interpreted as accumulation. Investors are potentially buying in large quantities because they believe the price is currently undervalued.”
-
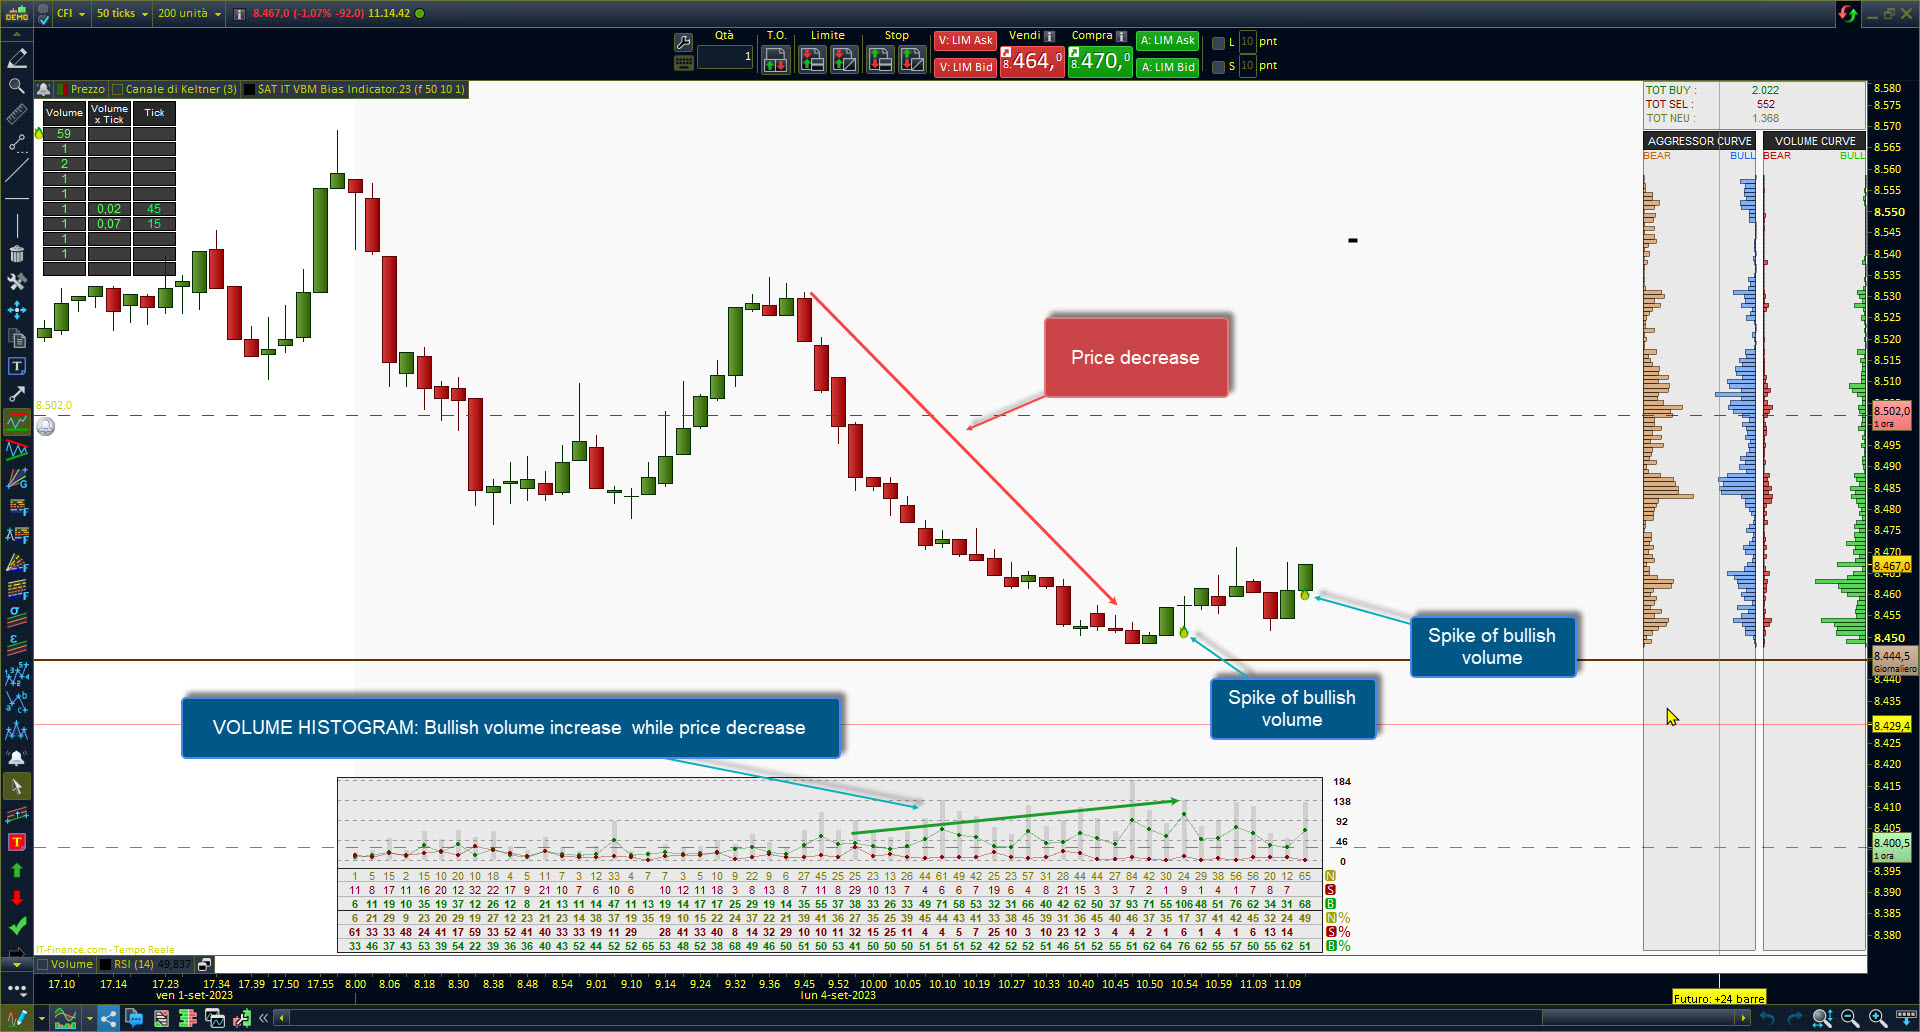
- ACCUMULATION
-
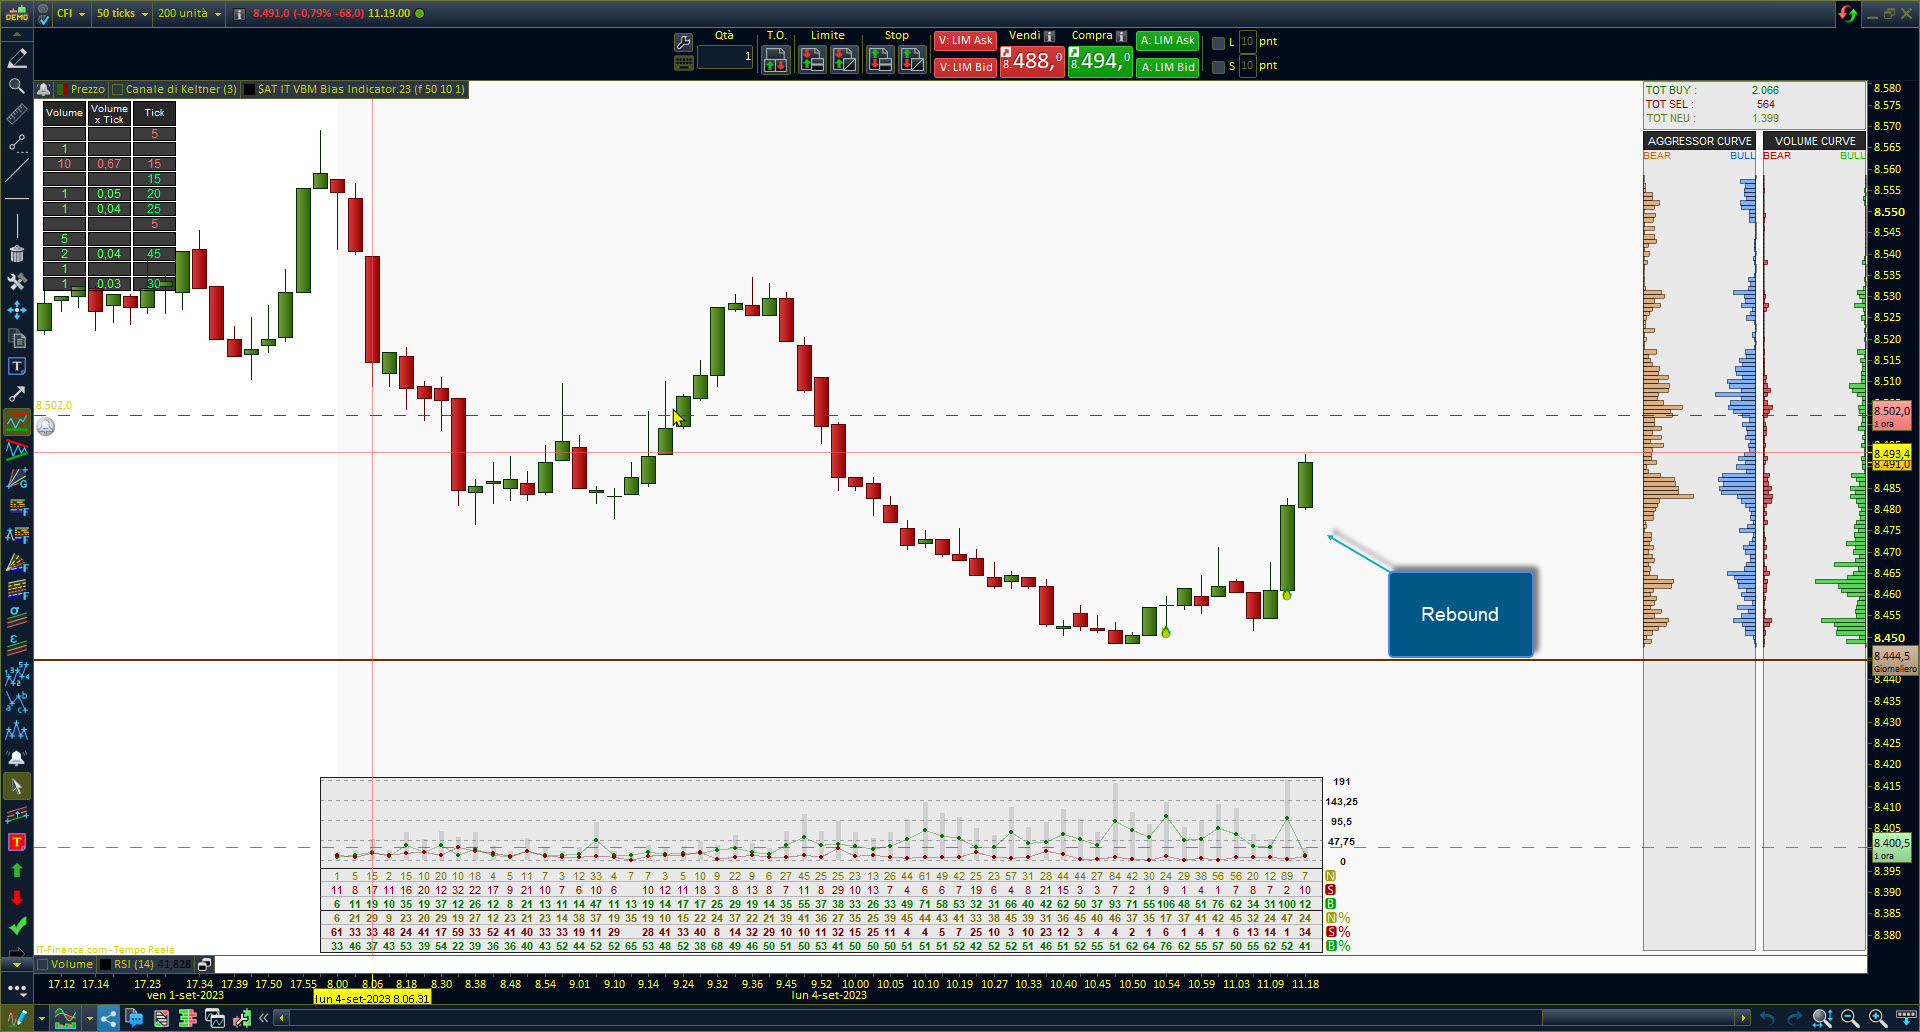
- REBOUND
🔔This indicator has a complementary indicator, to be used if you want to set ALARM to identify buying or selling volumes higher than a certain customizable value
Click here to download the Separate Volumes Indicator Manual in PDF format and start exploring the world of more informed and successful trading opportunities.
https://market.prorealcode.com/volume-based-market-bias-indicator-manual-18082023-en/
Take control of your trading with the Separate Volumes Indicator today!
Reviews
There are no reviews yet.