
49 / an
Compatible à partir de

Favoris: 5   Vues: 668   Avis: 0  

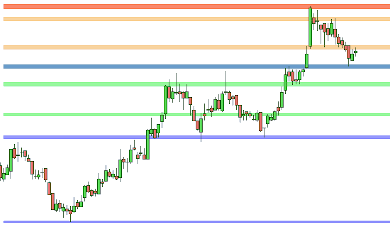
Find lastest weekly and default timeframe support/resistance areas on a same graph.

Report Abuse

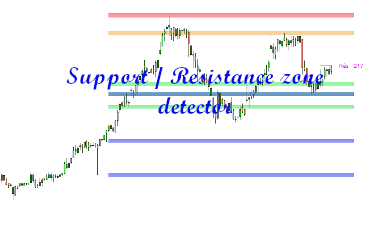
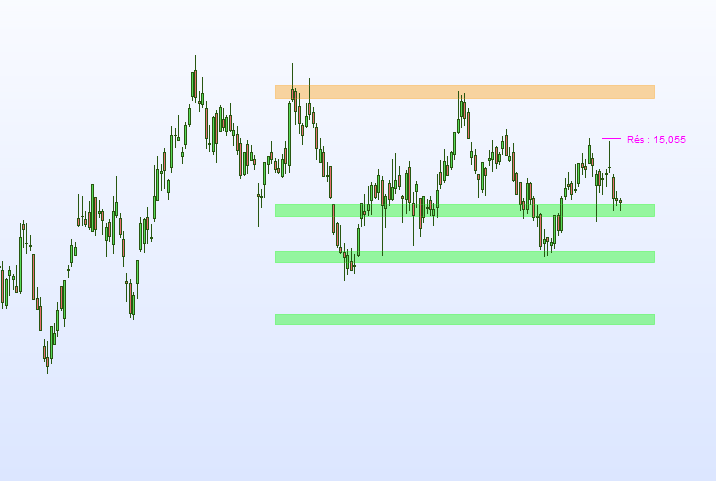
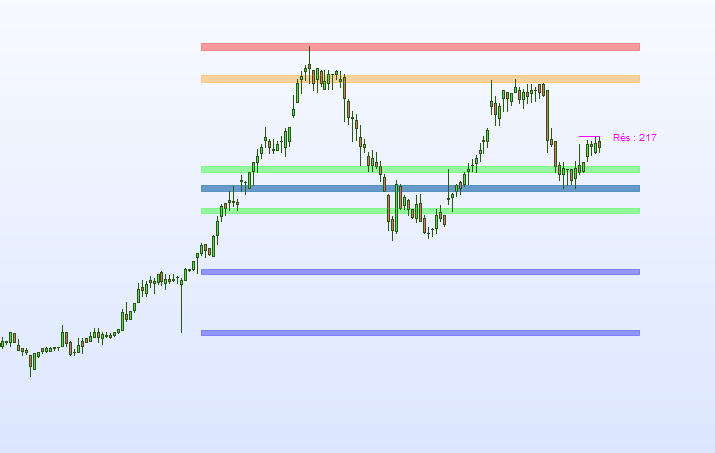
This indicator draws on the graph weekly and default timeframe support/resistance areas.
So, you can have on a daily chart weekly and daily support/resistance.
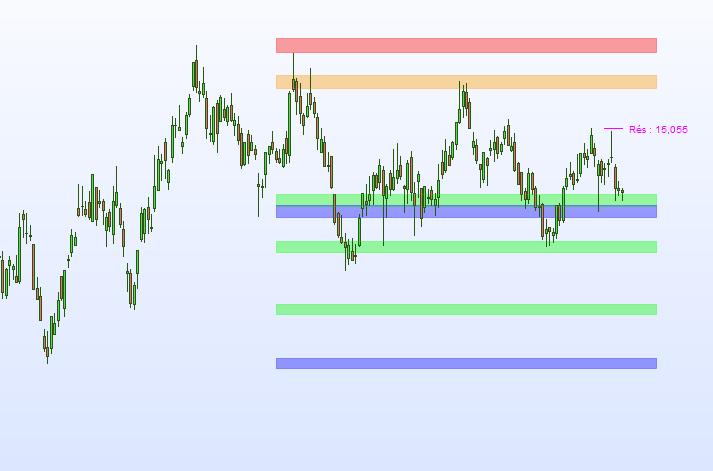
You can configure the indicator to see only weekly support/resistance or only default timeframe support/resistance.
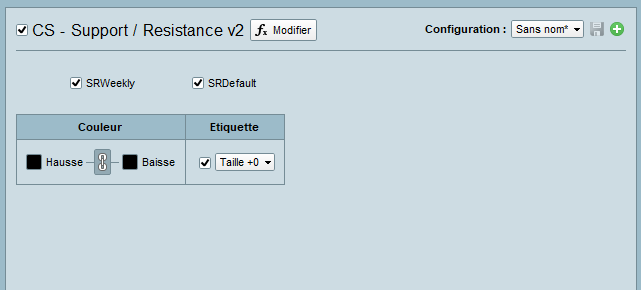
  • weekly support/resistance areas are drawn in blue and red.
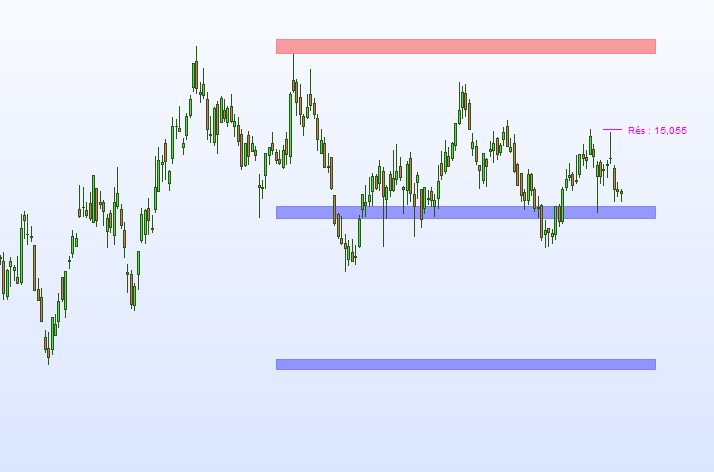
  • default timeframe support/resistance areas are drawn in green and orange.
Advantages :

  • easy to use.
  • it’s not working with ProRealtime v10.3
 

Avis

Il n’y a pas encore d’avis.

Seuls les clients connectés ayant acheté ce produit ont la possibilité de laisser un avis.

Demande de renseignements

Your personal data will be used to support your experience throughout this website, to manage access to your account, and for other purposes described in our privacy policy

Autres produits par CoolScreeners

Product Image

Trend IntraDay

Quickly view the trend and get entry points in position

69

10

Product Image

Big breakout tracker

Track breakout with volume on an asset

49

1

Product Image

Scalping divergence

Automatically detect divergences for short-term trading

59

2

Prêt à Rejoindre Notre Marketplace pour le Trading !
Plus de 1,000,000 clients potentiels attendent de découvrir vos outils de trading.
Inscrivez vous