
 QUICK &





Trendlines / Support & Resistance Pack for ProRealTime
The Trendlines / Support & Resistance Pack combines four complementary tools for ProRealTime to automatically detect and display ascending support trendlines and descending resistance trendlines.
An ascending support trendline connects successive price lows and represents a dynamic support area. Traders may monitor price returning towards this line for a potential bounce or a breakdown below support.
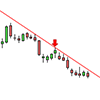
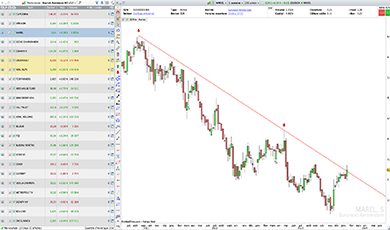
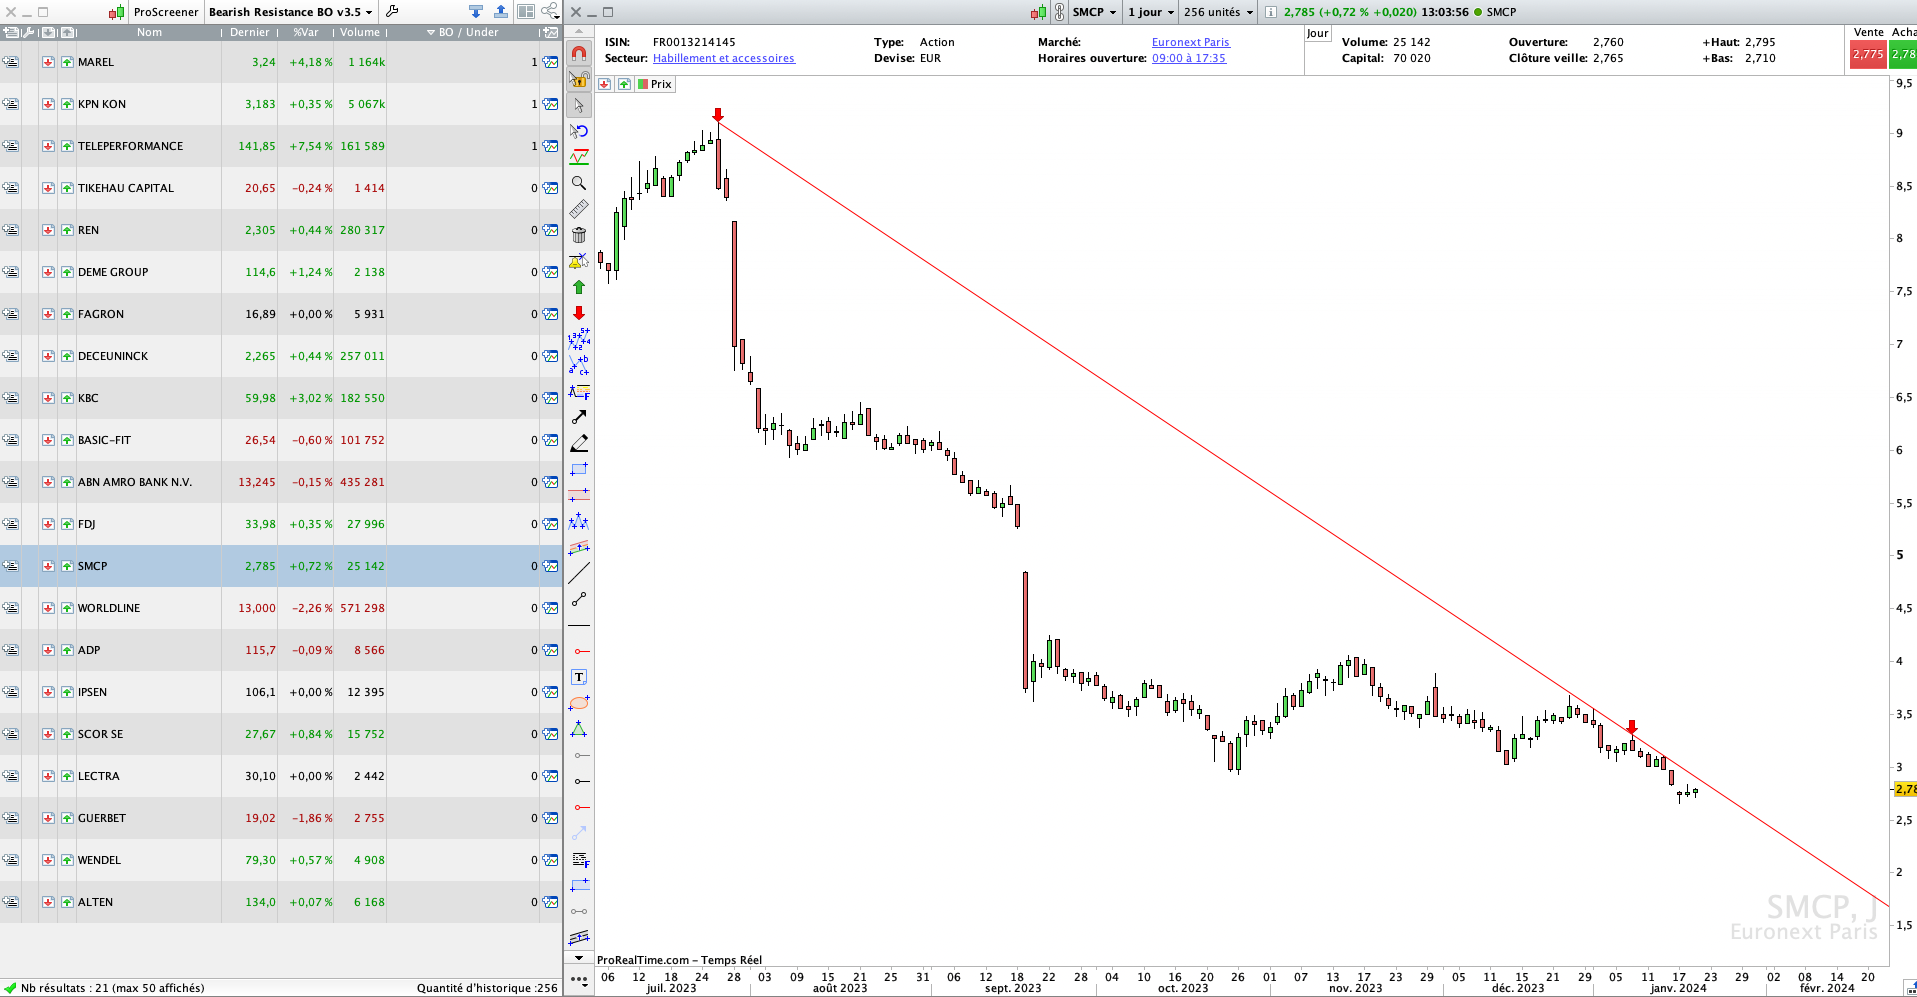
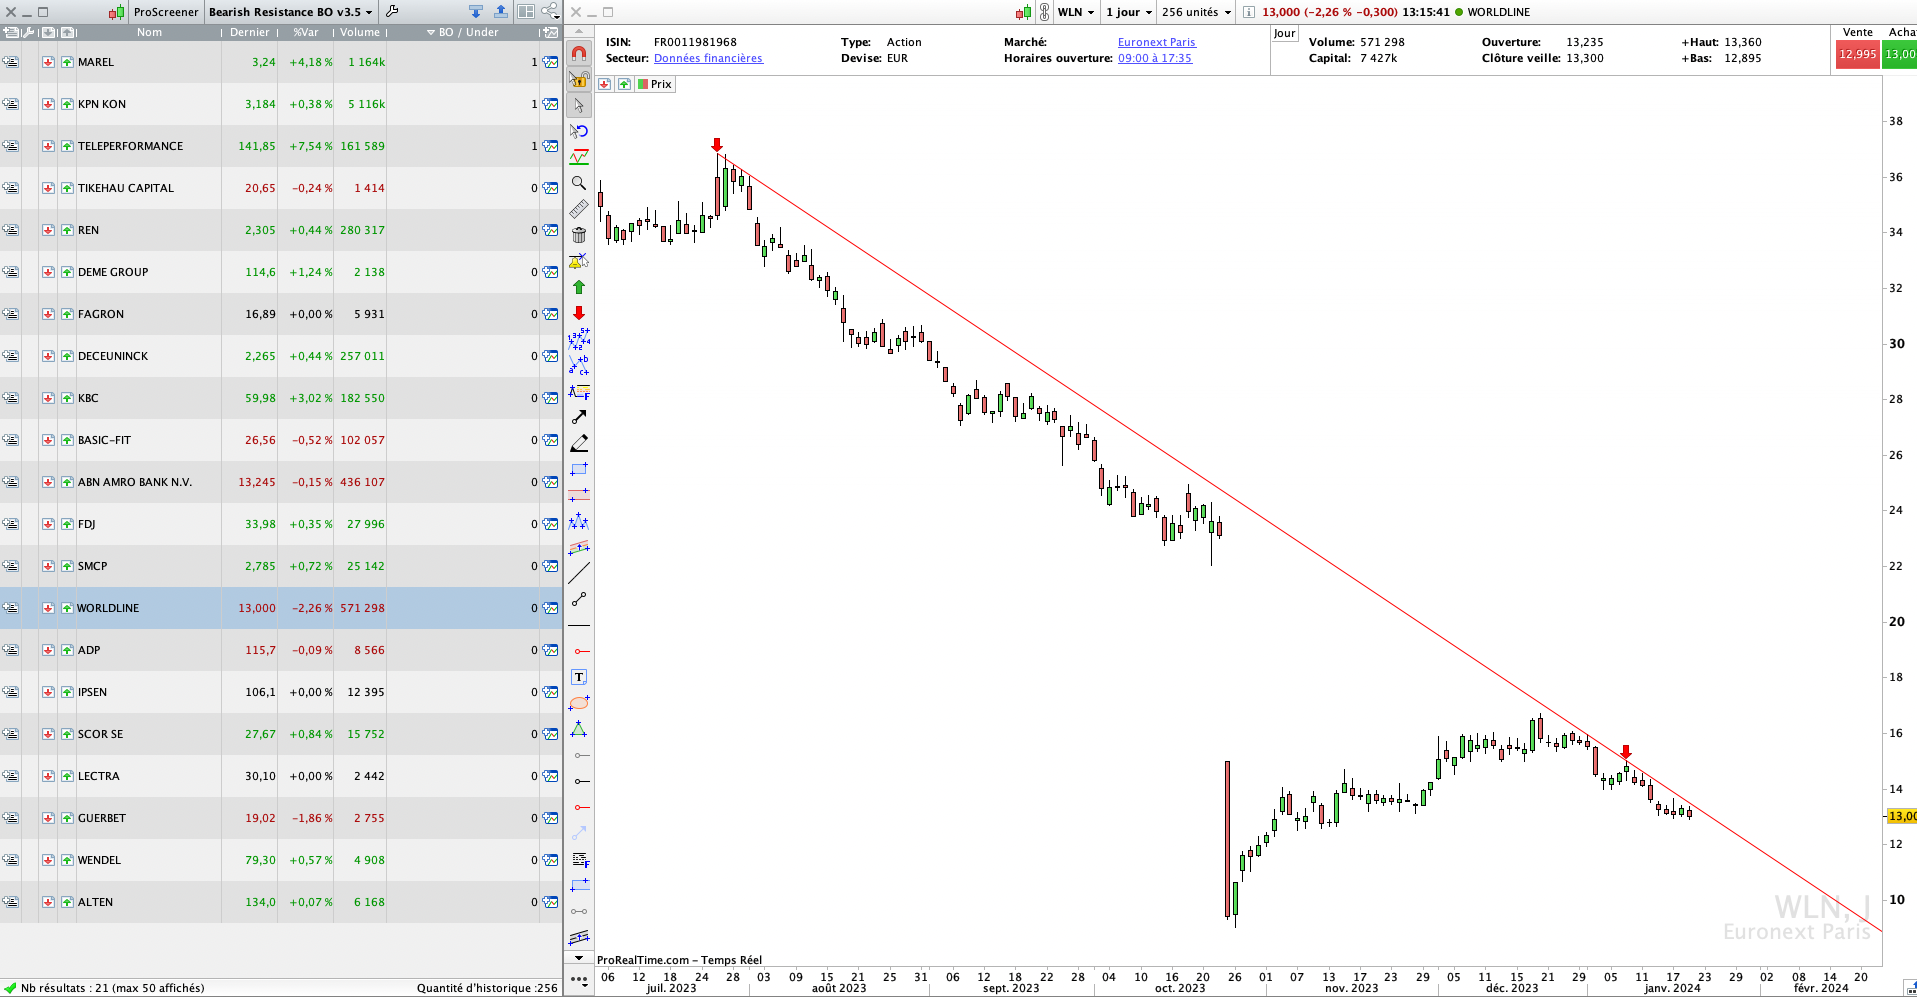
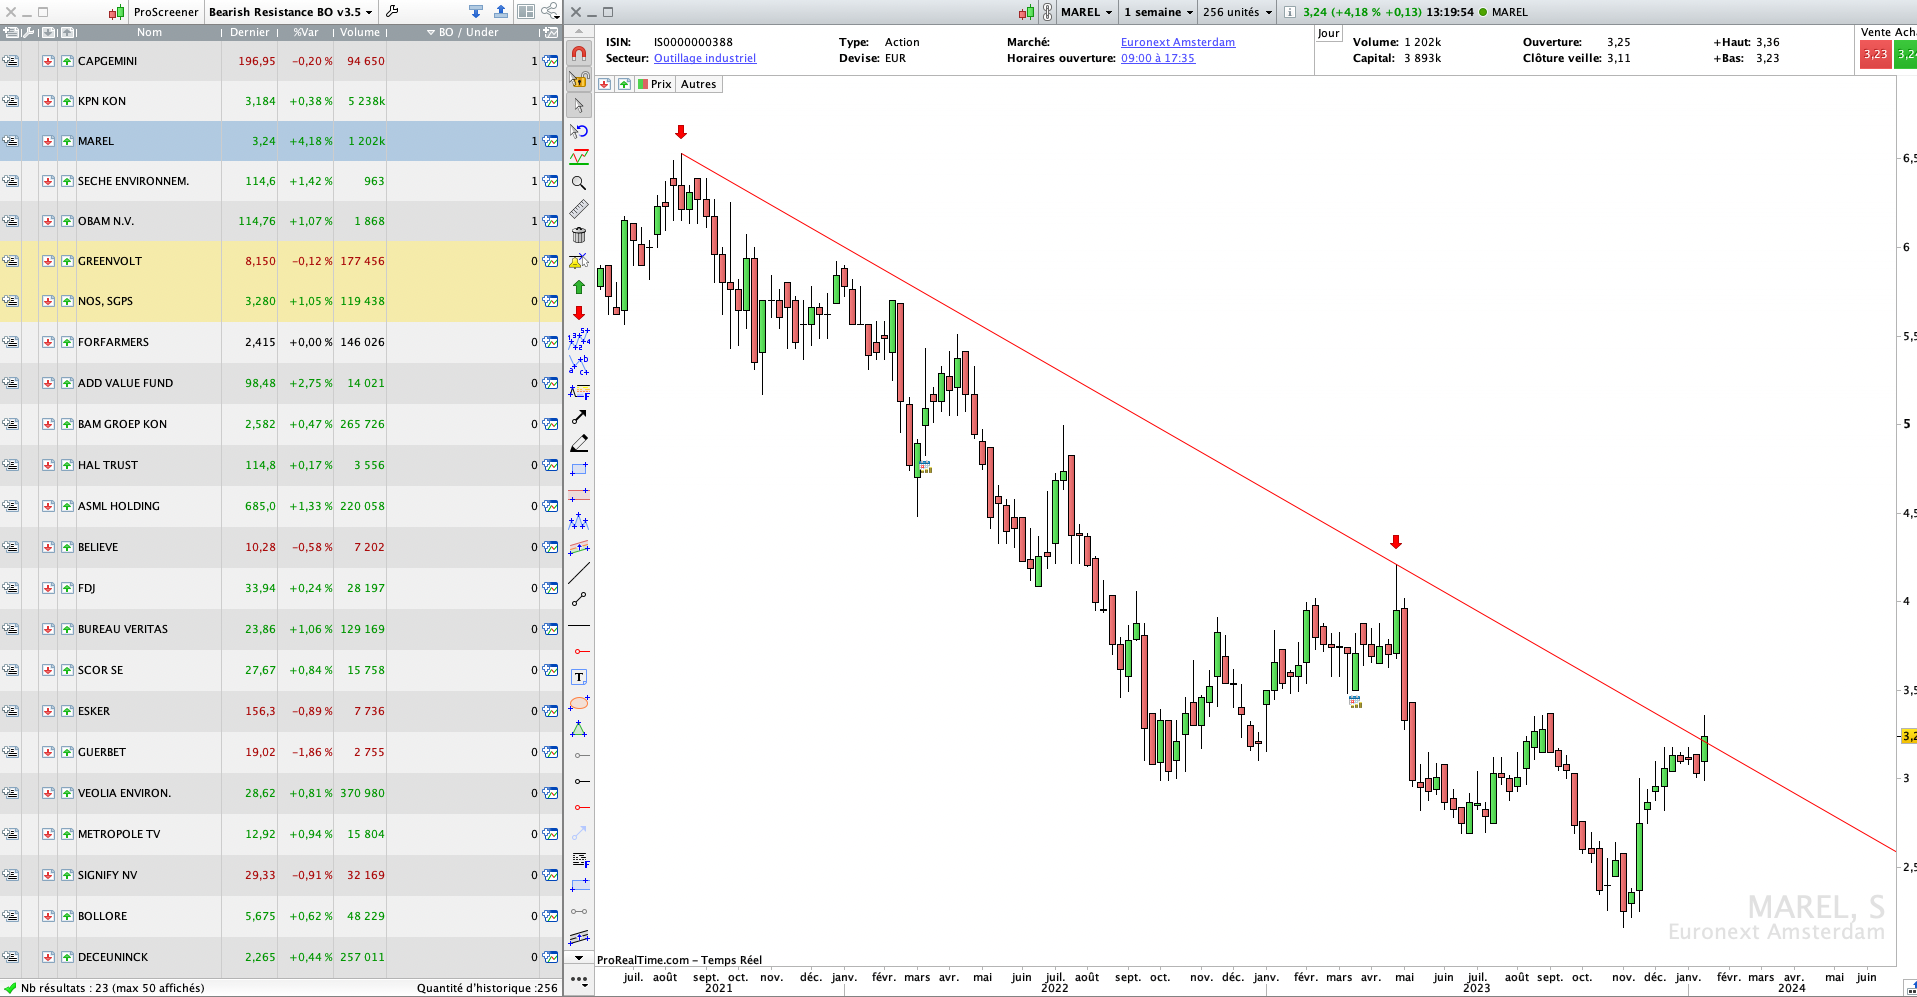
A descending resistance trendline connects successive price highs and represents a dynamic resistance area. Traders may monitor stocks approaching this resistance or breaking above it in a potential bullish breakout.
By combining both configurations, the pack helps you find trading setups across the markets and analyse them directly on your charts.
4 Tools Included
Ascending Support Trendlines (SOH):
- Bullish Support Screener – scans financial markets for stocks approaching ascending support trendlines or breaking below them.
- Bullish Support Indicator – automatically displays ascending support trendlines on your charts.
Descending Resistance Trendlines (ROB):
- Trendline Breakout Screener – scans financial markets for stocks approaching descending resistance trendlines or breaking above them.
- Descending Trendline Indicator – automatically displays descending resistance trendlines on your charts.
The two Screeners identify stocks close to their support or resistance trendlines, while the Indicators draw the detected lines directly on your ProRealTime charts.
Pack price: €80 instead of €100 when purchasing both Screeners separately, saving you 20%.
Screener Results and Trendline Detection
Both Screeners automatically scan financial markets according to your own detection criteria and filters.
Results are ranked by the percentage distance between the current price and the detected trendline, allowing you to quickly identify stocks approaching their support or resistance.
You can also filter for configurations showing a potential breakdown below ascending support or a breakout above descending resistance.
The Indicators complement this search by automatically drawing the detected trendlines, making it easier to evaluate each setup directly on the chart.

Customizable Settings
Customize the Screeners from ProRealTime’s Variables menu and the Indicators from the Configuration menu, without modifying the code.
Adjustable validation criteria:
- Number of candles analysed
- Age of the second contact with the trendline
- Maximum distance between the current price and support or resistance
- Trendline detection amplitude
Available filters:
- Presence of a third contact with the trendline
- Short-term trend towards the support or resistance
- Current support breakdown or resistance breakout
General market filters (Screeners):
- Minimum price
- Minimum average trading volume
- Adjustable average volume period
- Volume calculation based on the number of shares or traded value
These filters use daily market data to select instruments according to your preferred price and liquidity criteria.
Display options (Indicators):
- Trendline displayed as a segment or extended line
- Display of the trendline’s key points
Characteristics
- 2 Screeners and 2 Indicators included
- Automatic detection of ascending support and descending resistance trendlines
- Works on all timeframes
- Results ranked by percentage distance from the detected trendline
- Customizable detection criteria, filters and display options
- Compatible with ProRealTime V11 and later
- Compatible with the free version of ProRealTime (daily closing prices)
- Settings adjustable without modifying the code
- Free automatic updates for life
Video Presentations
Bullish Support (SOH) – Screener & Indicator
Video in French – English subtitles available.
Trendline Breakout (ROB) – Screener & Indicator
Video in French – English subtitles available.

Reviews
There are no reviews yet.