

 QUICK &
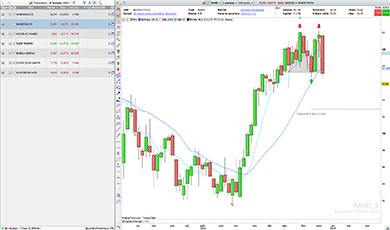
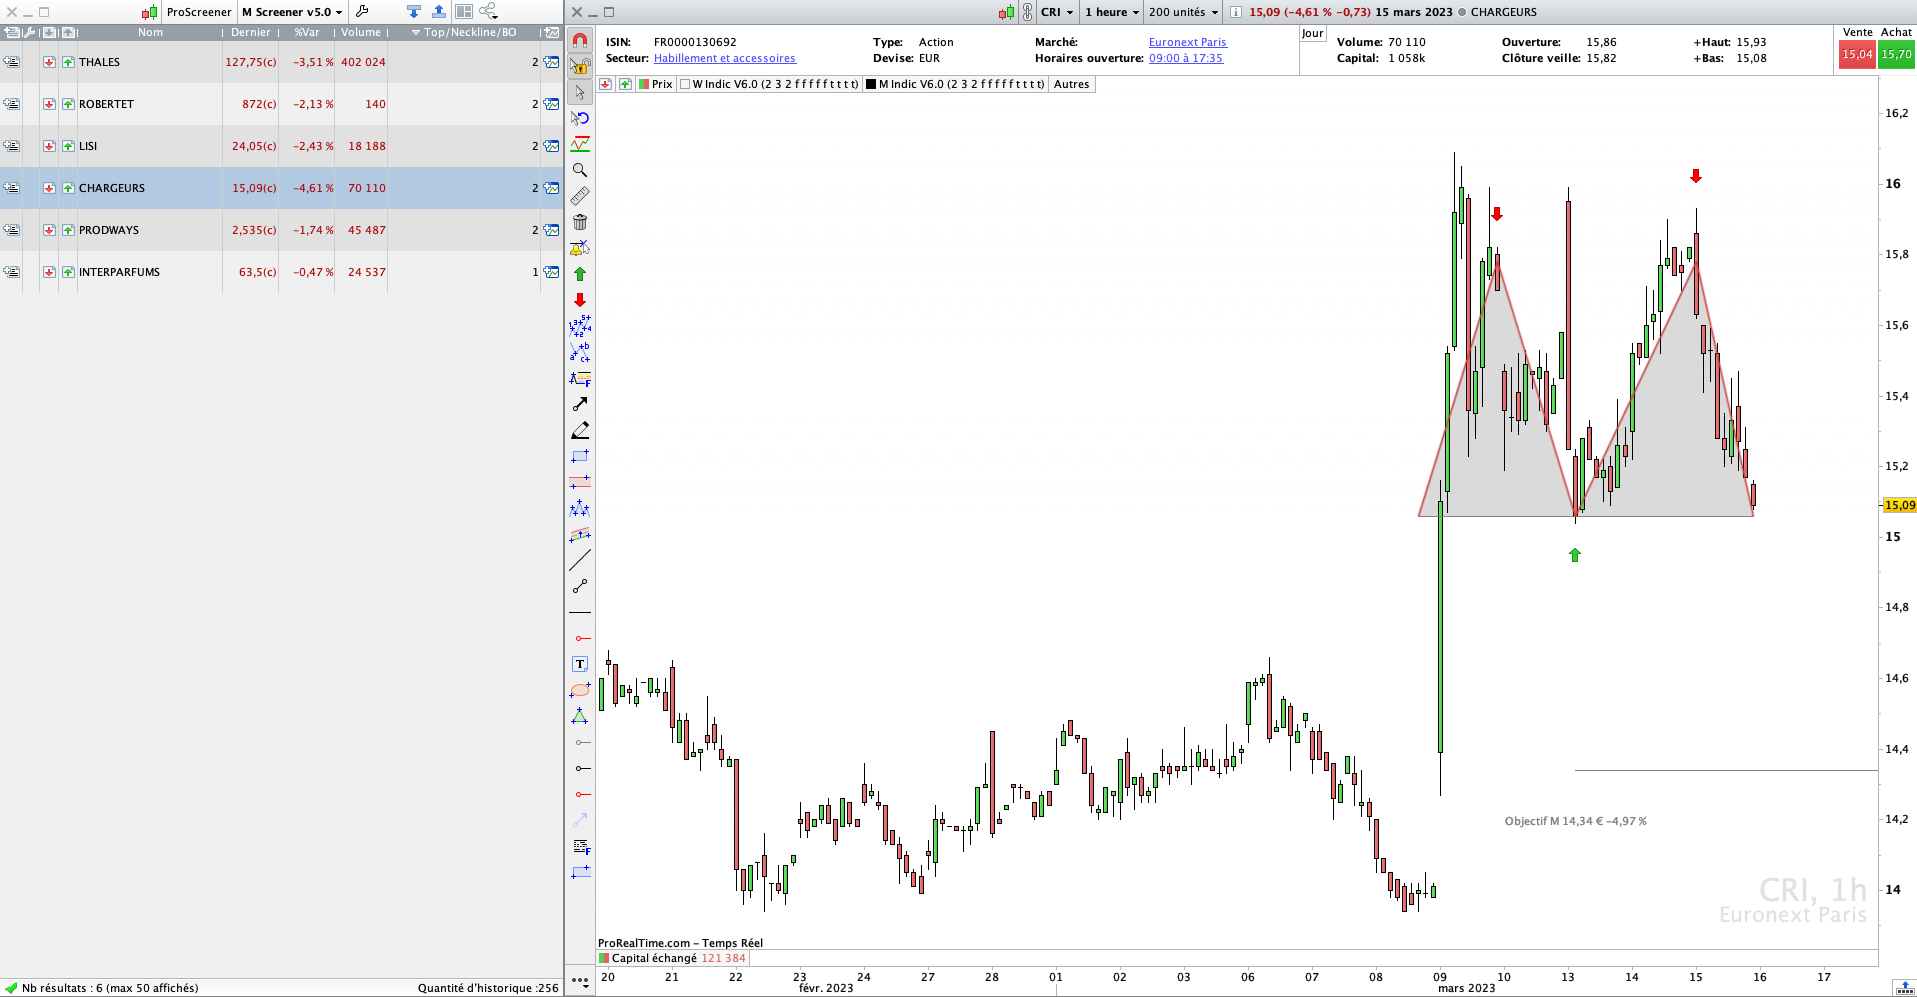
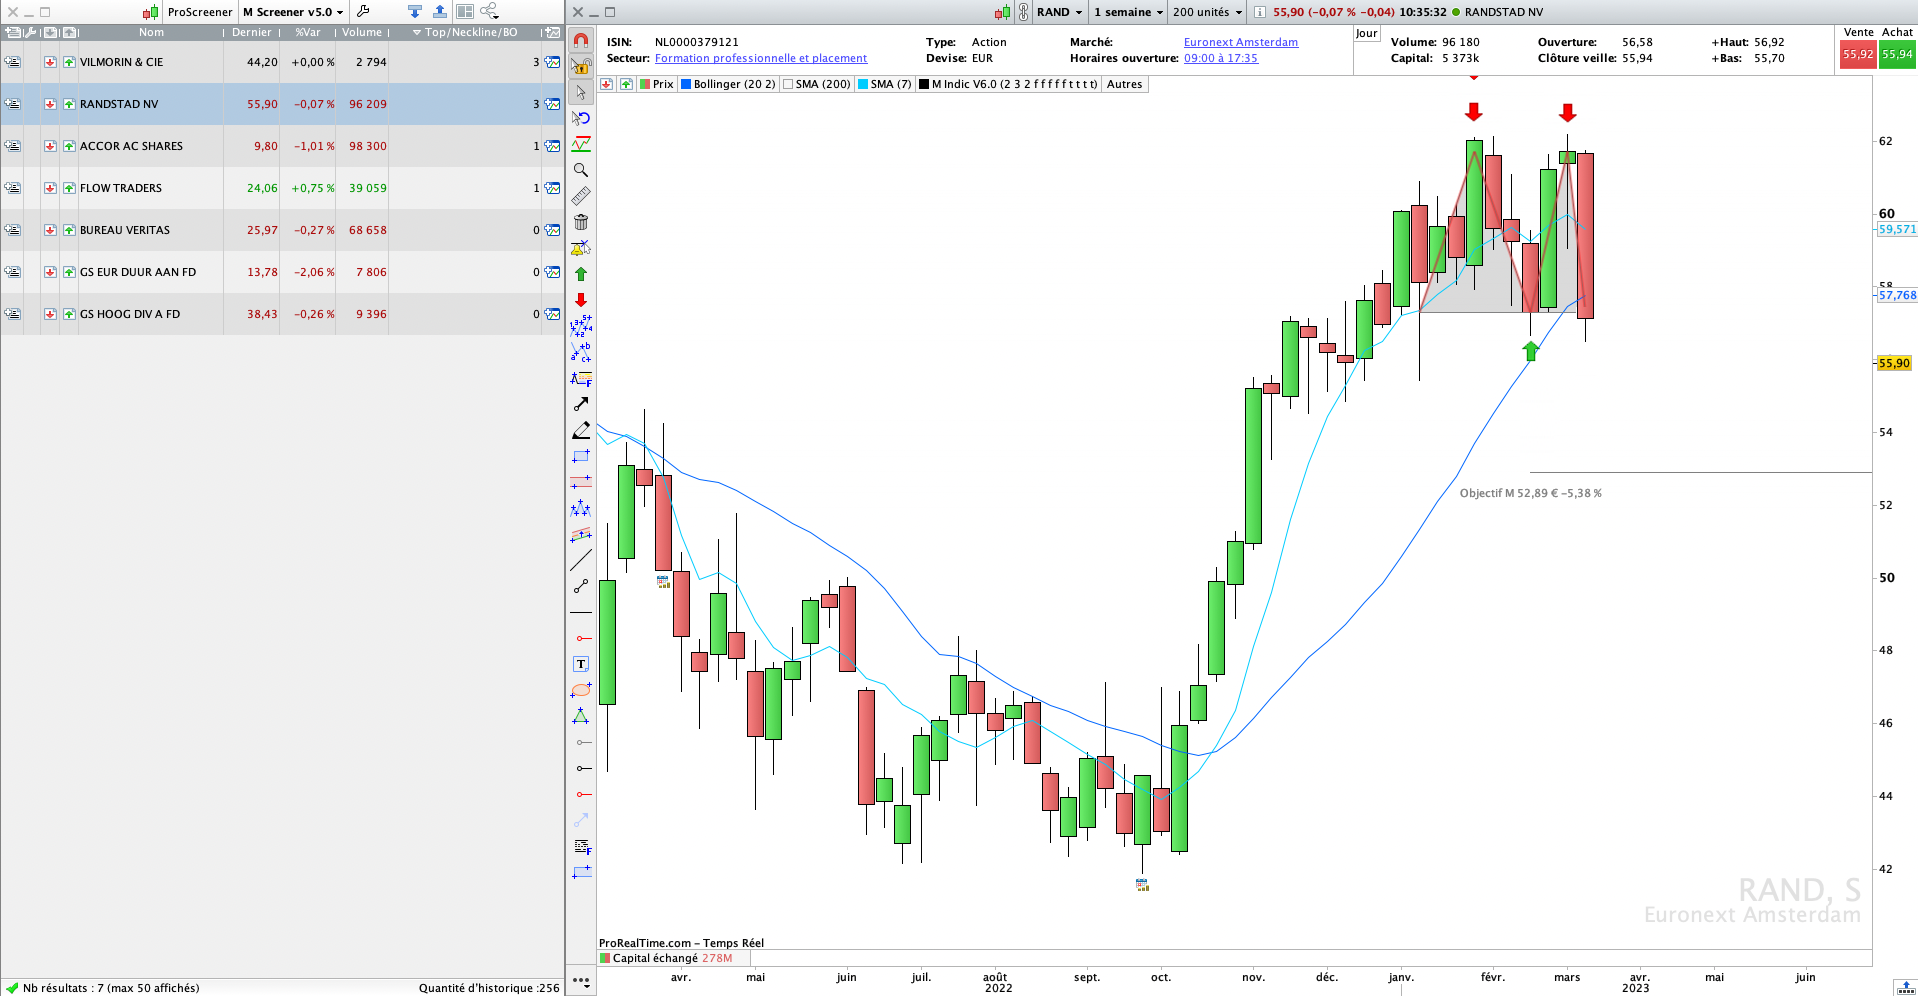
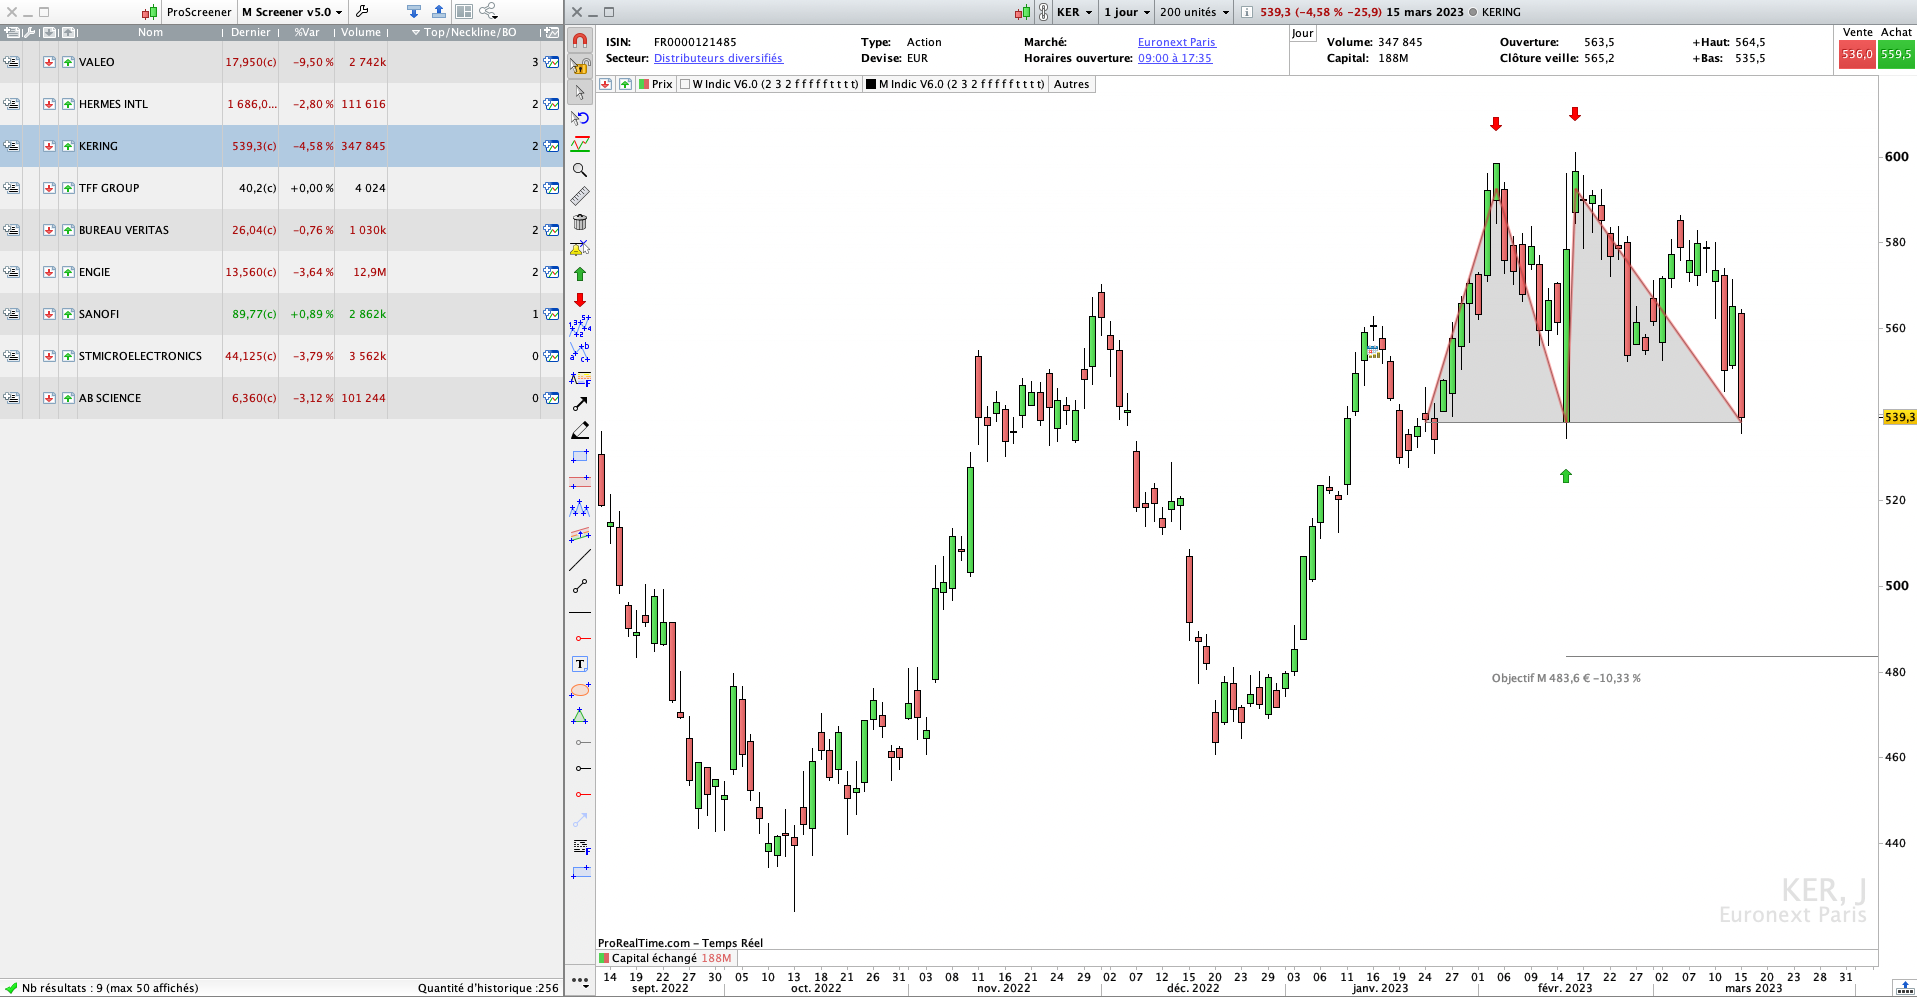
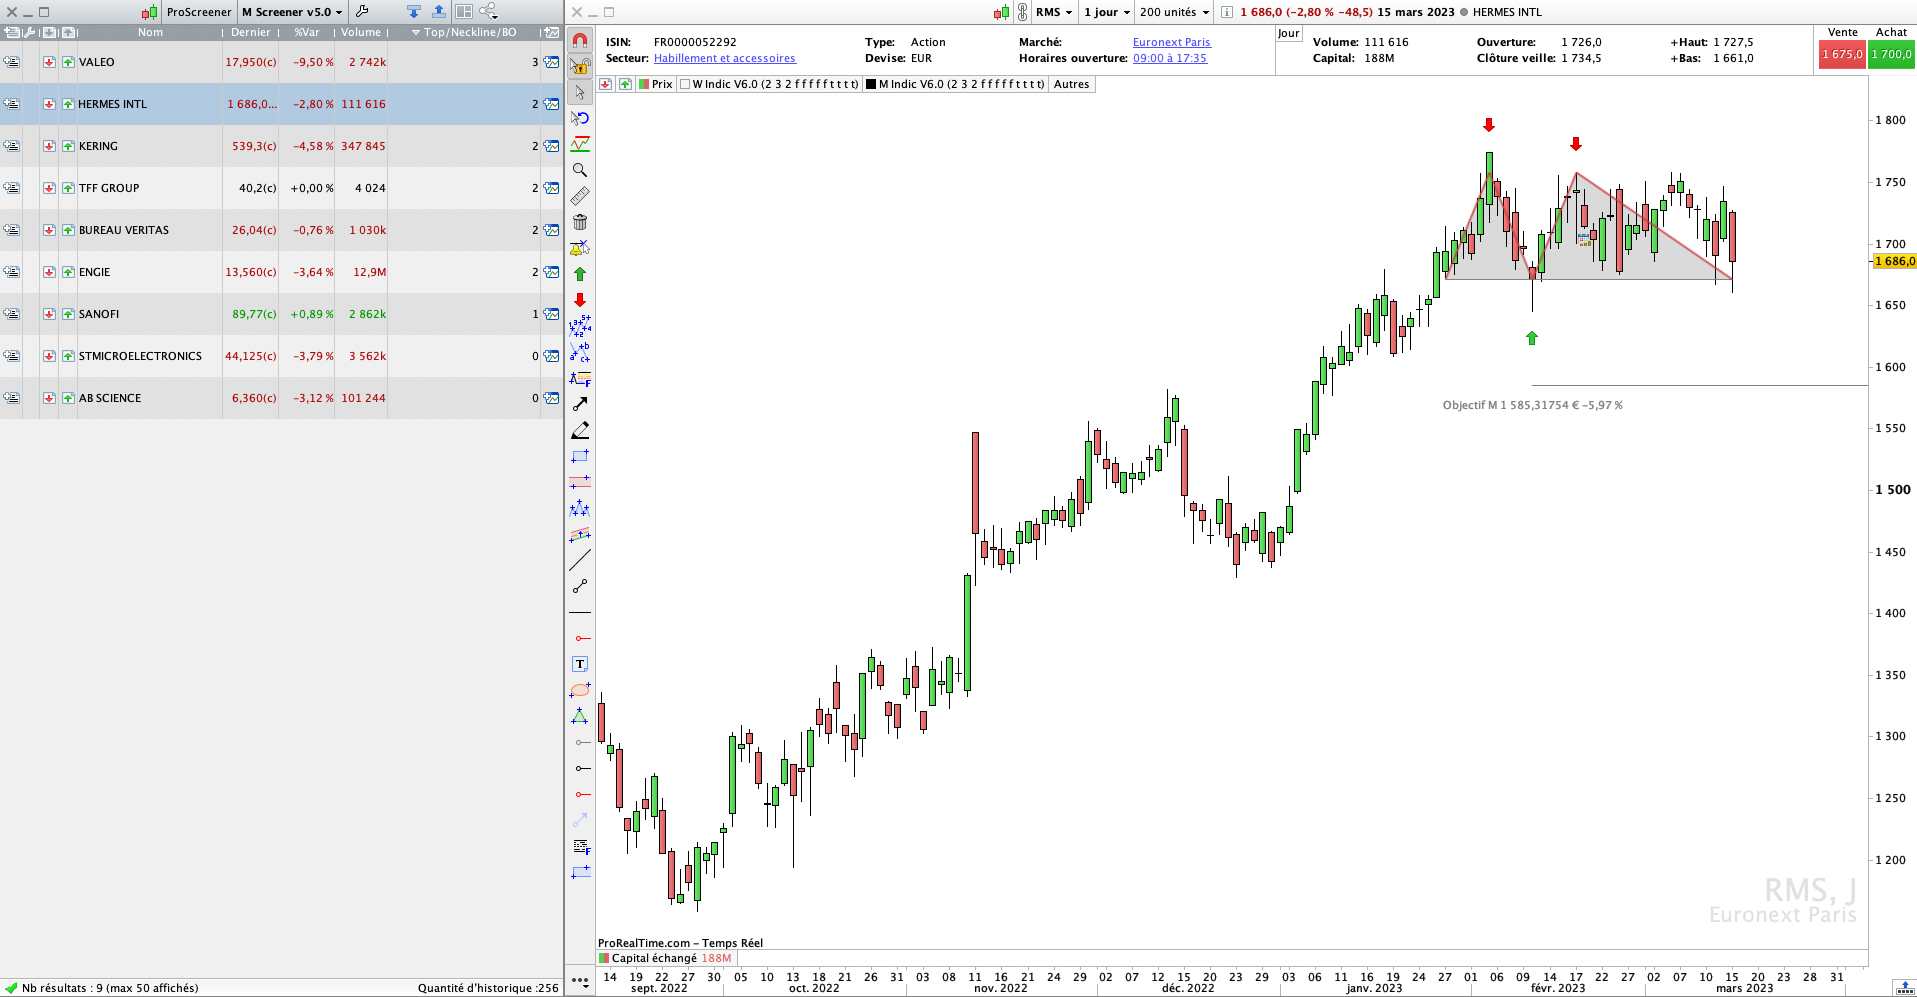


Double Top (M) Screener for ProRealTime
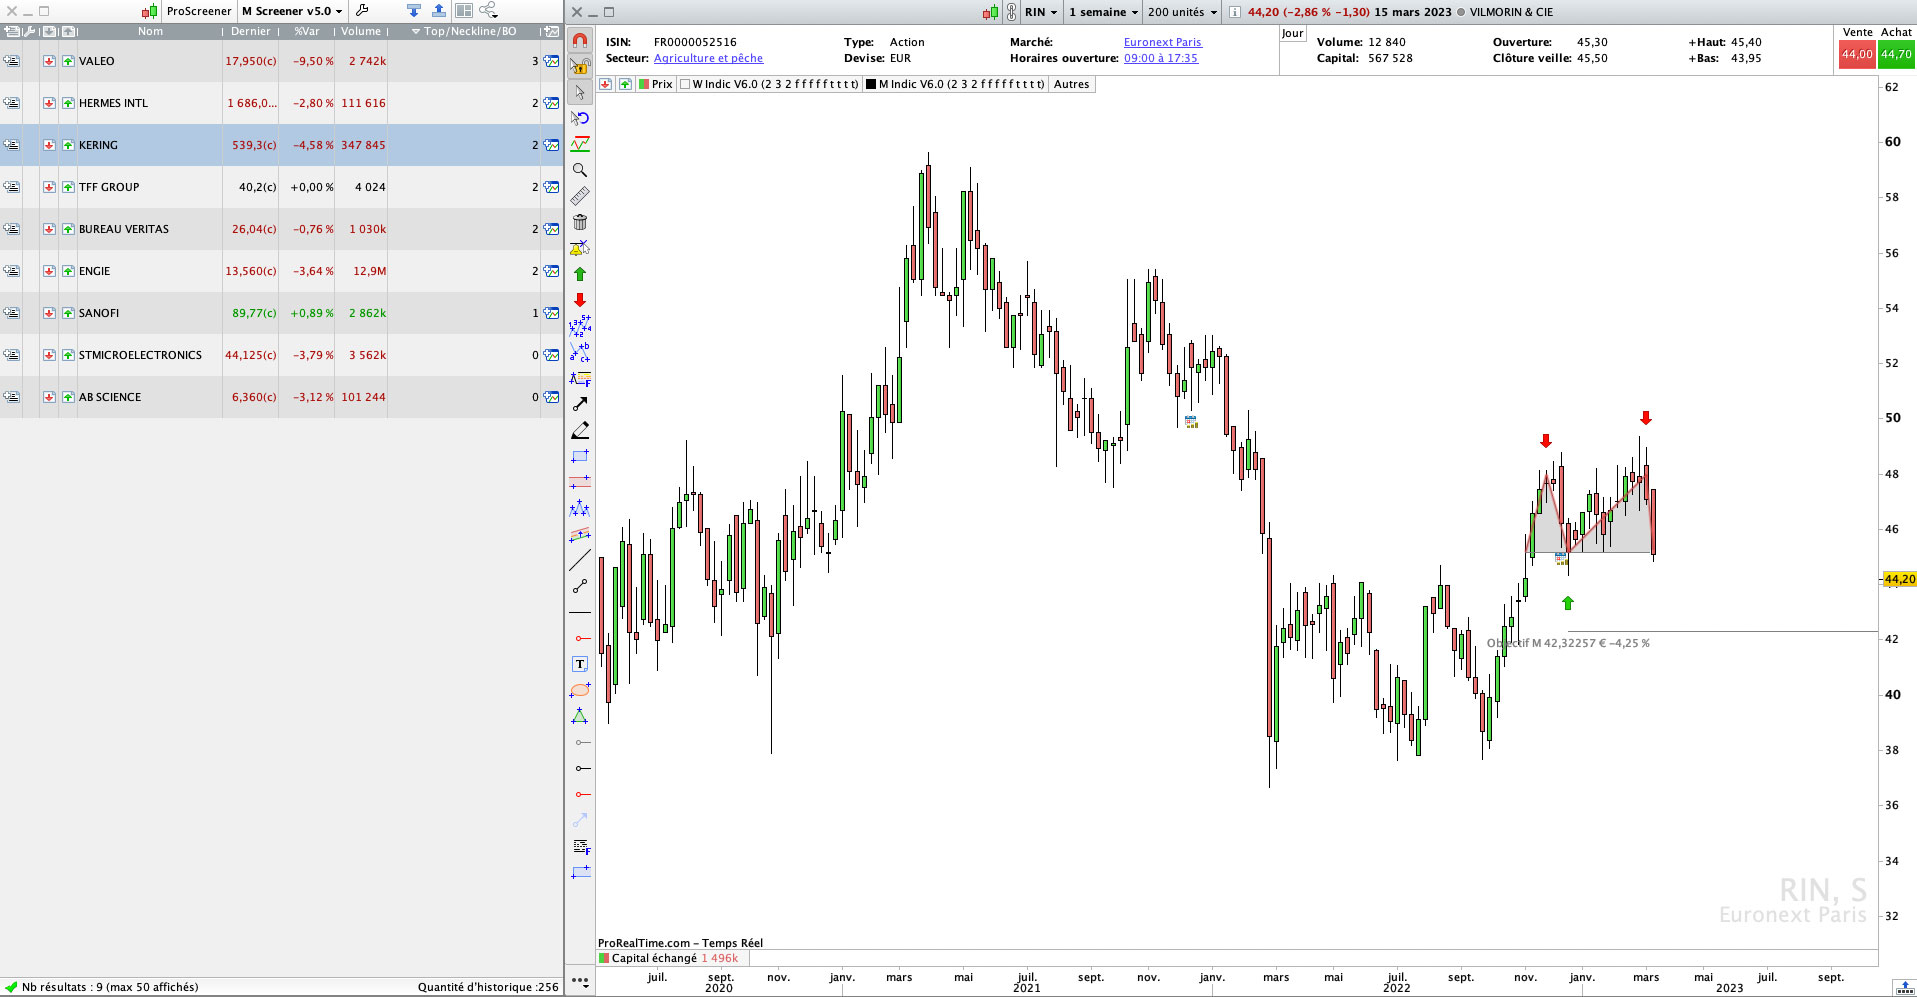
The Double Top (M) Screener automatically scans financial markets to identify instruments showing M-shaped chart patterns based on customizable detection criteria.
This Screener helps you find potential bearish reversal setups and locate instruments at different stages of a Double Top formation.
It works on all timeframes and allows you to adapt the search to your own trading criteria without modifying the code.
Customizable Settings
Adjust the Screener directly from ProRealTime’s Variables menu, without modifying the code.
Adjustable validation criteria:
- Maximum percentage difference between the two tops
- Minimum height of the M pattern
- Maximum distance between the current price and the pattern’s key points
Available filters:
- Current price near the tops
- Current price near the neckline
- Current price breaking below the neckline
- Bearish RSI divergence between the two tops
- Neckline touching the 20-period simple moving average (SMA20)
General market filters:
- Minimum price
- Minimum average trading volume
- Volume calculation based on the number of shares or traded value
These general filters use daily data to help you select instruments according to your preferred price and liquidity criteria.
Understanding Screener Results
The Screener classifies detected patterns in the Top / Neckline / BO results column according to the current price position:
- 0: price in the middle of the M formation
- 1: price near the tops
- 2: price near the neckline
- 3: price breaking below the neckline
This classification helps you identify instruments according to the stage of the pattern you want to monitor.
Characteristics
- Automatic detection of Double Top (M) chart patterns
- Works on all timeframes
- Customizable detection criteria and filters
- Results classified according to the current price position within the M pattern
- Compatible with ProRealTime V11 and later
- Compatible with the free version of ProRealTime (daily closing prices)
- Settings adjustable without modifying the code
- Double Top (M) Indicator included
- Free automatic updates
Video Presentation
Video in French – English subtitles available.

Reviews
There are no reviews yet.