

 QUICK &



Descending Trendline Indicator for ProRealTime
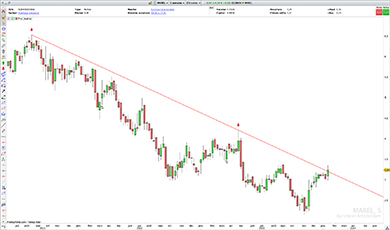
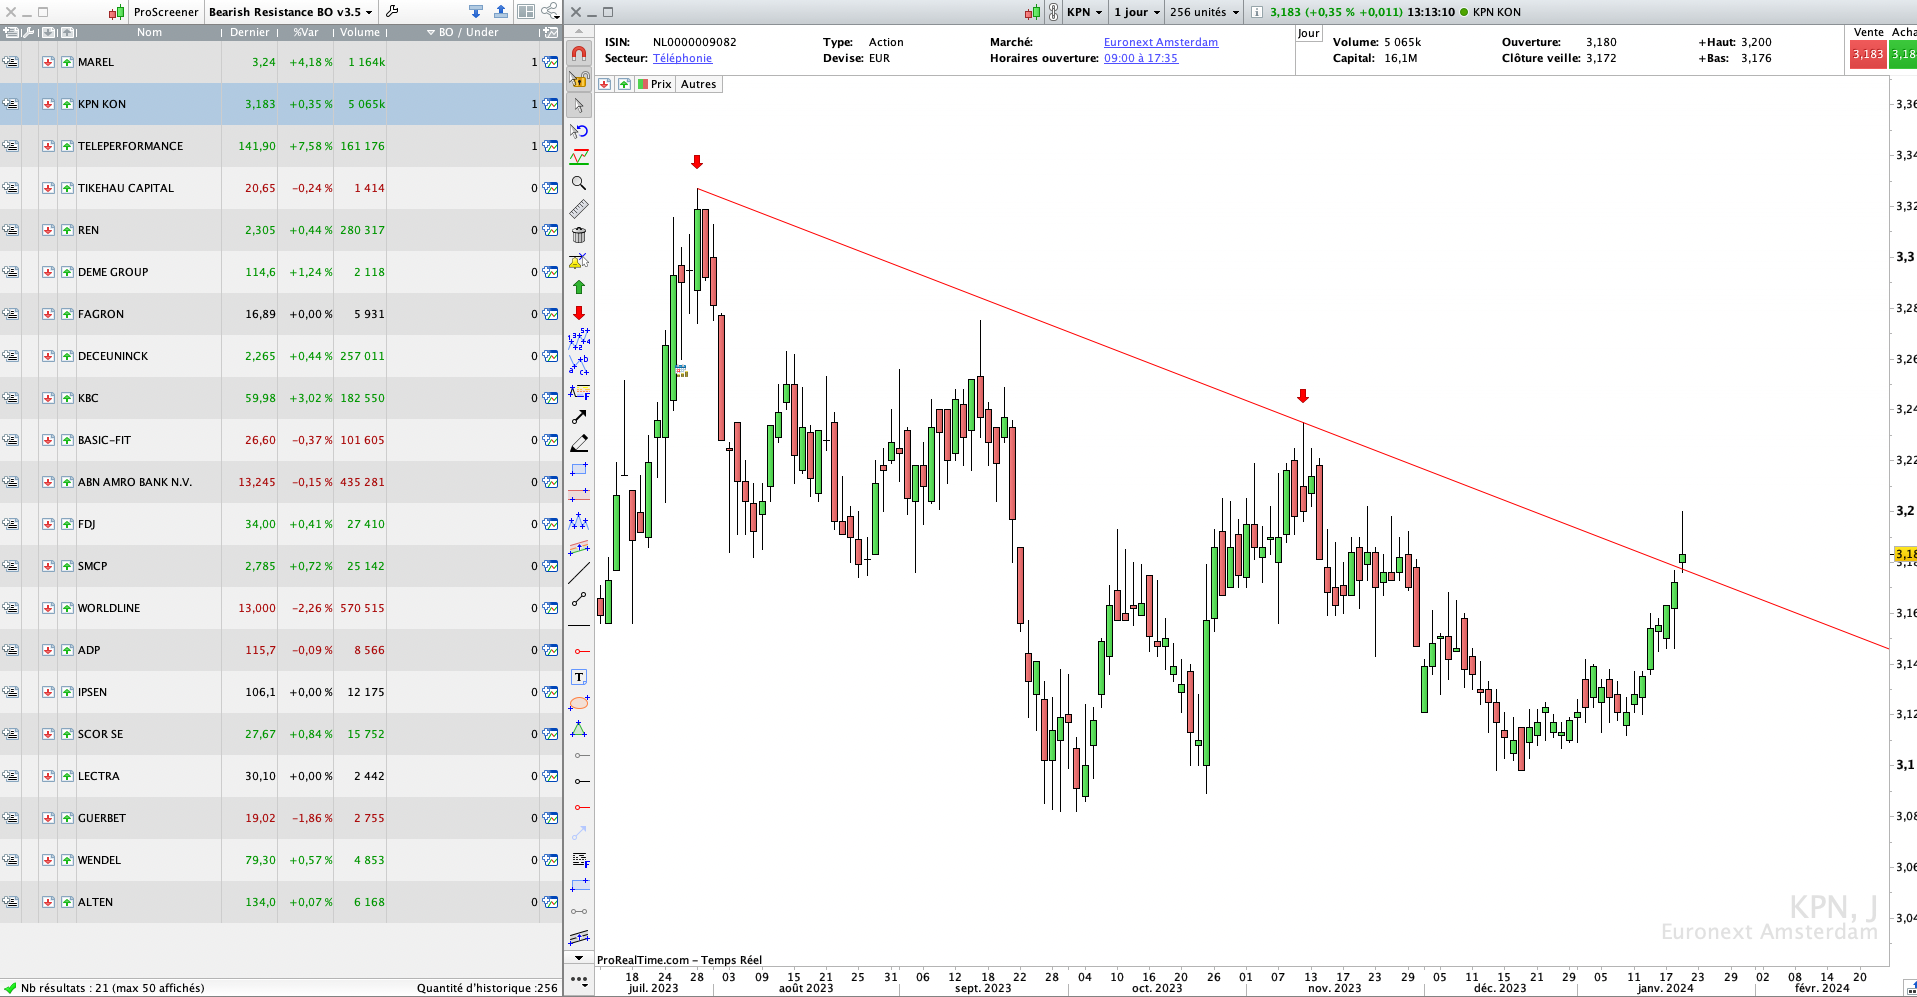
The Descending Trendline Indicator automatically detects and displays descending resistance trendlines directly on your ProRealTime candlestick charts.
A descending resistance trendline connects several price highs and represents a dynamic resistance level. Traders can monitor prices approaching this resistance or watch for a potential bullish breakout above the trendline.
The indicator saves time by identifying and displaying these trendlines automatically, without requiring you to draw them manually.
Display Descending Trendlines Automatically
The indicator displays descending resistance trendlines directly on your price charts, making it easier to monitor:
- Stocks approaching a descending resistance trendline.
- Price reactions near resistance.
- Potential bullish breakouts above the trendline.
Several detection criteria and display options are available to adapt the indicator to your trading preferences.
All settings can be adjusted directly through ProRealTime’s Configuration menu, without modifying the code.

Customizable Settings
Adjustable detection criteria:
- Number of candles analyzed.
- Maximum age of the second contact with resistance.
- Maximum distance between price and the descending trendline.
- Price movement amplitude used for trendline detection.
Available filters:
- Presence of a third contact with the resistance trendline.
- Short-term trend moving toward resistance.
- Ongoing breakout above the descending trendline.
Display options:
- Display descending resistance as a segment or an extended line.
- Display the key points used to identify the resistance trendline.
Characteristics
- Works on all timeframes.
- Compatible with ProRealTime V11 and later versions.
- Compatible with the free version of ProRealTime (daily closing prices).
- Adjustable detection criteria and display options.
- Settings customizable without modifying the code.
- Free automatic updates.
Video Presentation
Video in French – English subtitles available.
Looking for Descending Trendline Breakouts Across the Markets?
Want to find stocks approaching or breaking above descending resistance trendlines according to your own trading criteria?
Discover our Trendline Breakout Screener to automatically scan the markets for these configurations.
The Indicator displays descending resistance trendlines directly on your charts, while the Screener helps you find stocks matching your criteria.
The Descending Trendline Indicator is included with the Trendline Breakout Screener.

Reviews
There are no reviews yet.