
Introduction
As we have seen in my previous studies, my point of view is that digital filters are the best tools available to analyze financial markets.
Unfortunately, there is no silver bullet: no digital filter can rule them all. Instead, we are forced to admit that for each specific situation, we need a specific filter. The main reason for this is that digital filters have a multiple number of poles, with different properties. The more poles we have, the more smoothing we get, and unfortunately, the more delay we suffer.
I always liked Ichimoku because it is an “all-in-one solution”. But I see it as a good idea without a good implementation. Basically, the mathematical tool that undergoes Ichimoku is the statistical mid-range. It is a very weak statistical measure because it is very sensitive to outliers. In robust statistics, we strongly prefer the median, as it is considered a much better measure of central tendency, with little sensitivity to outliers. Therefore, all the filters we will use are chosen to “mimic” the median, but with greater smoothness.
Principles
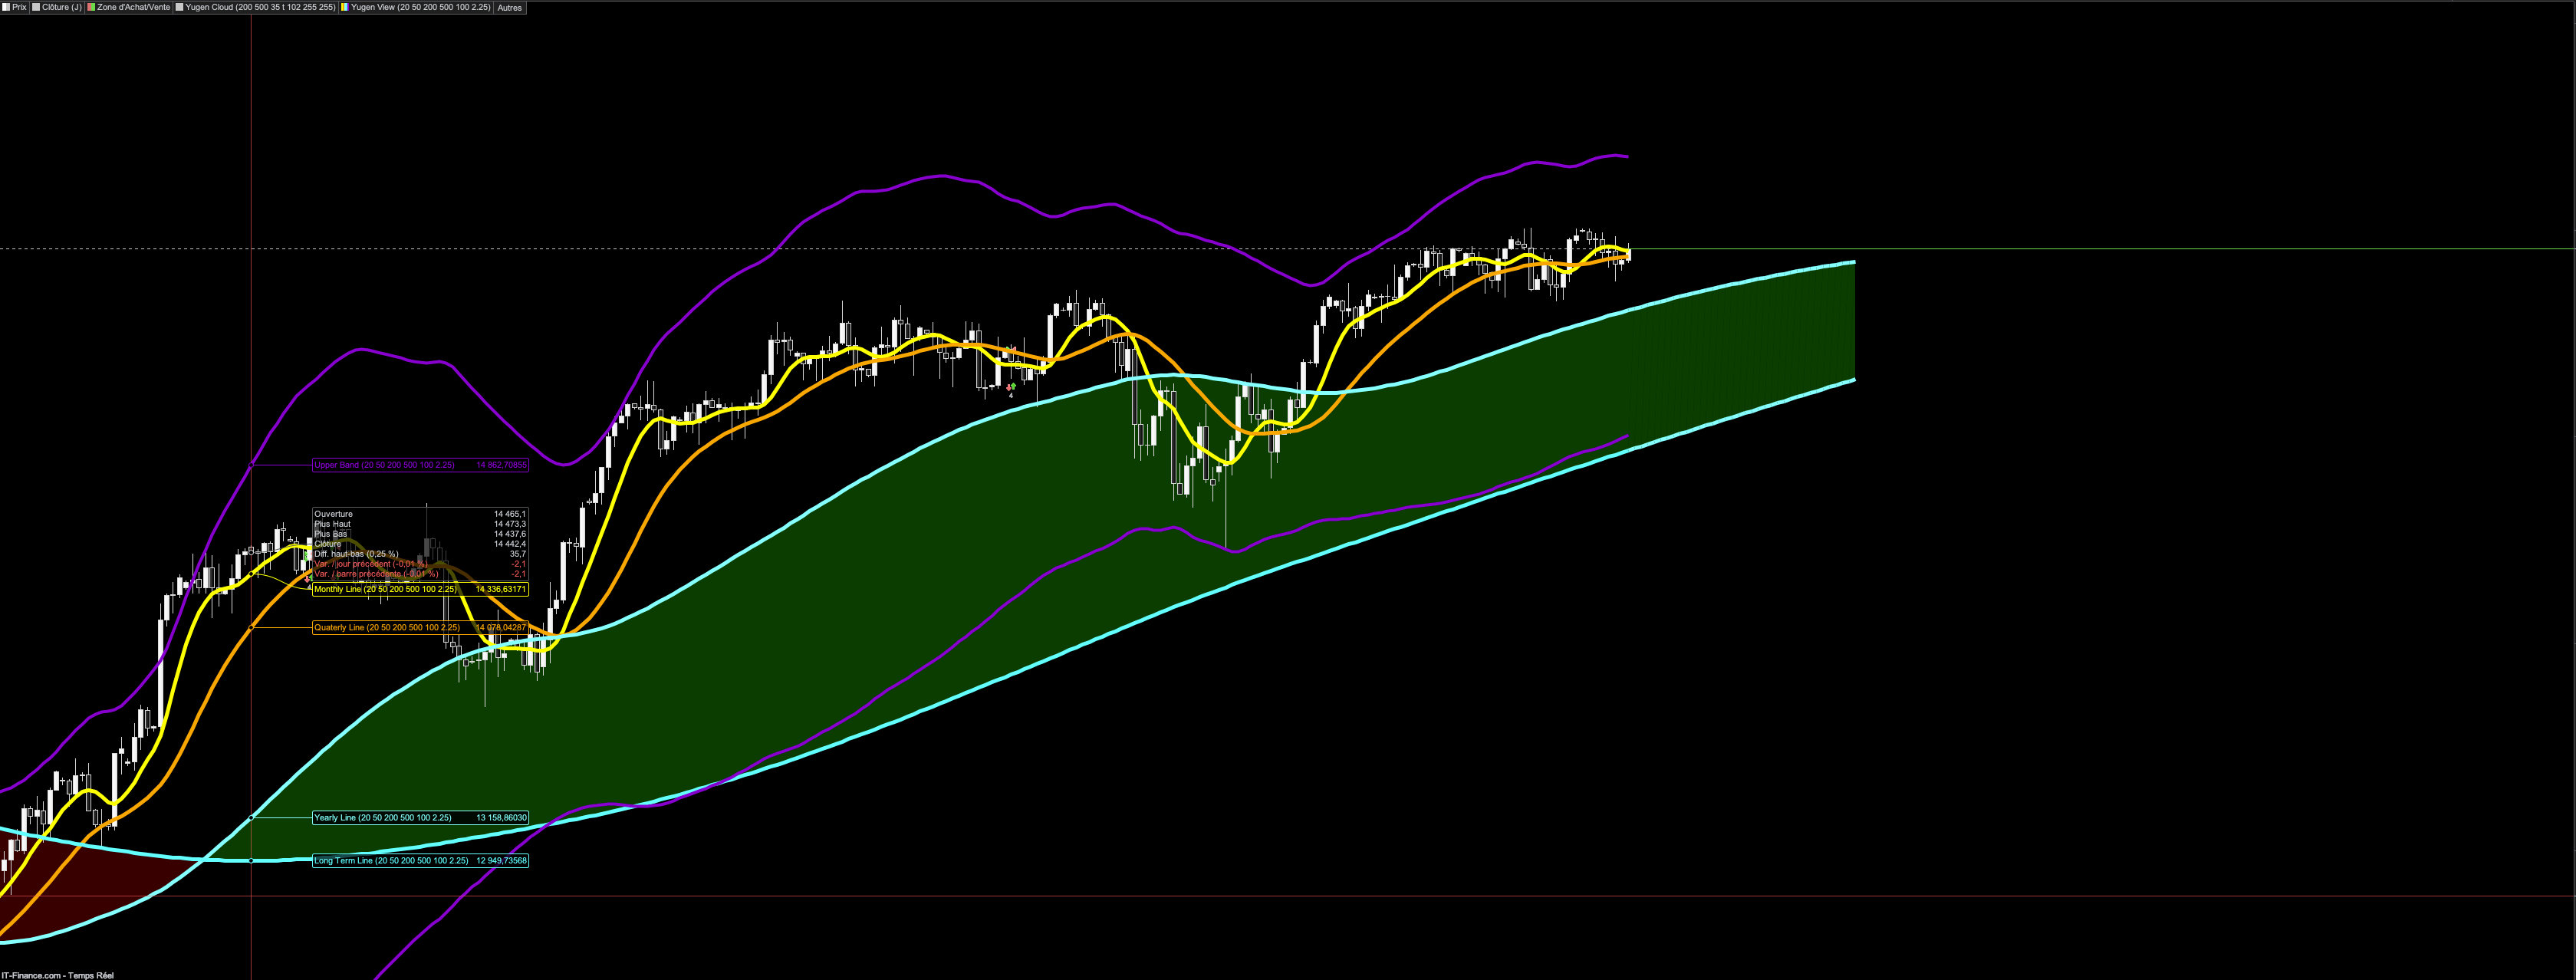
The idea behing Yugen View is that the shorter the period, the more poles. In this way, we increase the smoothness at a smaller period length, but we don’t suffer from too much delay. Once we have determined the poles of the filter, we need to define their length. The idea is that our system should simply represent one year’s worth of data, so we have :
- The fastest line is the monthly period: 20 (param m)
- The average line corresponds to the quarterly period: 50 (param q)
- The first line of the cloud corresponds to the annual period: 200 (param y)
- The second line of the cloud corresponds to the long term period: 500 (param l)
As you can see, we use one less line than the Ichimoku :
- The monthly line corresponds to Tenkan Sen
- The quarterly line corresponds to Kijun Sen
- The annual line corresponds to Senkou Span A
- The long term line corresponds to Senkou Span B
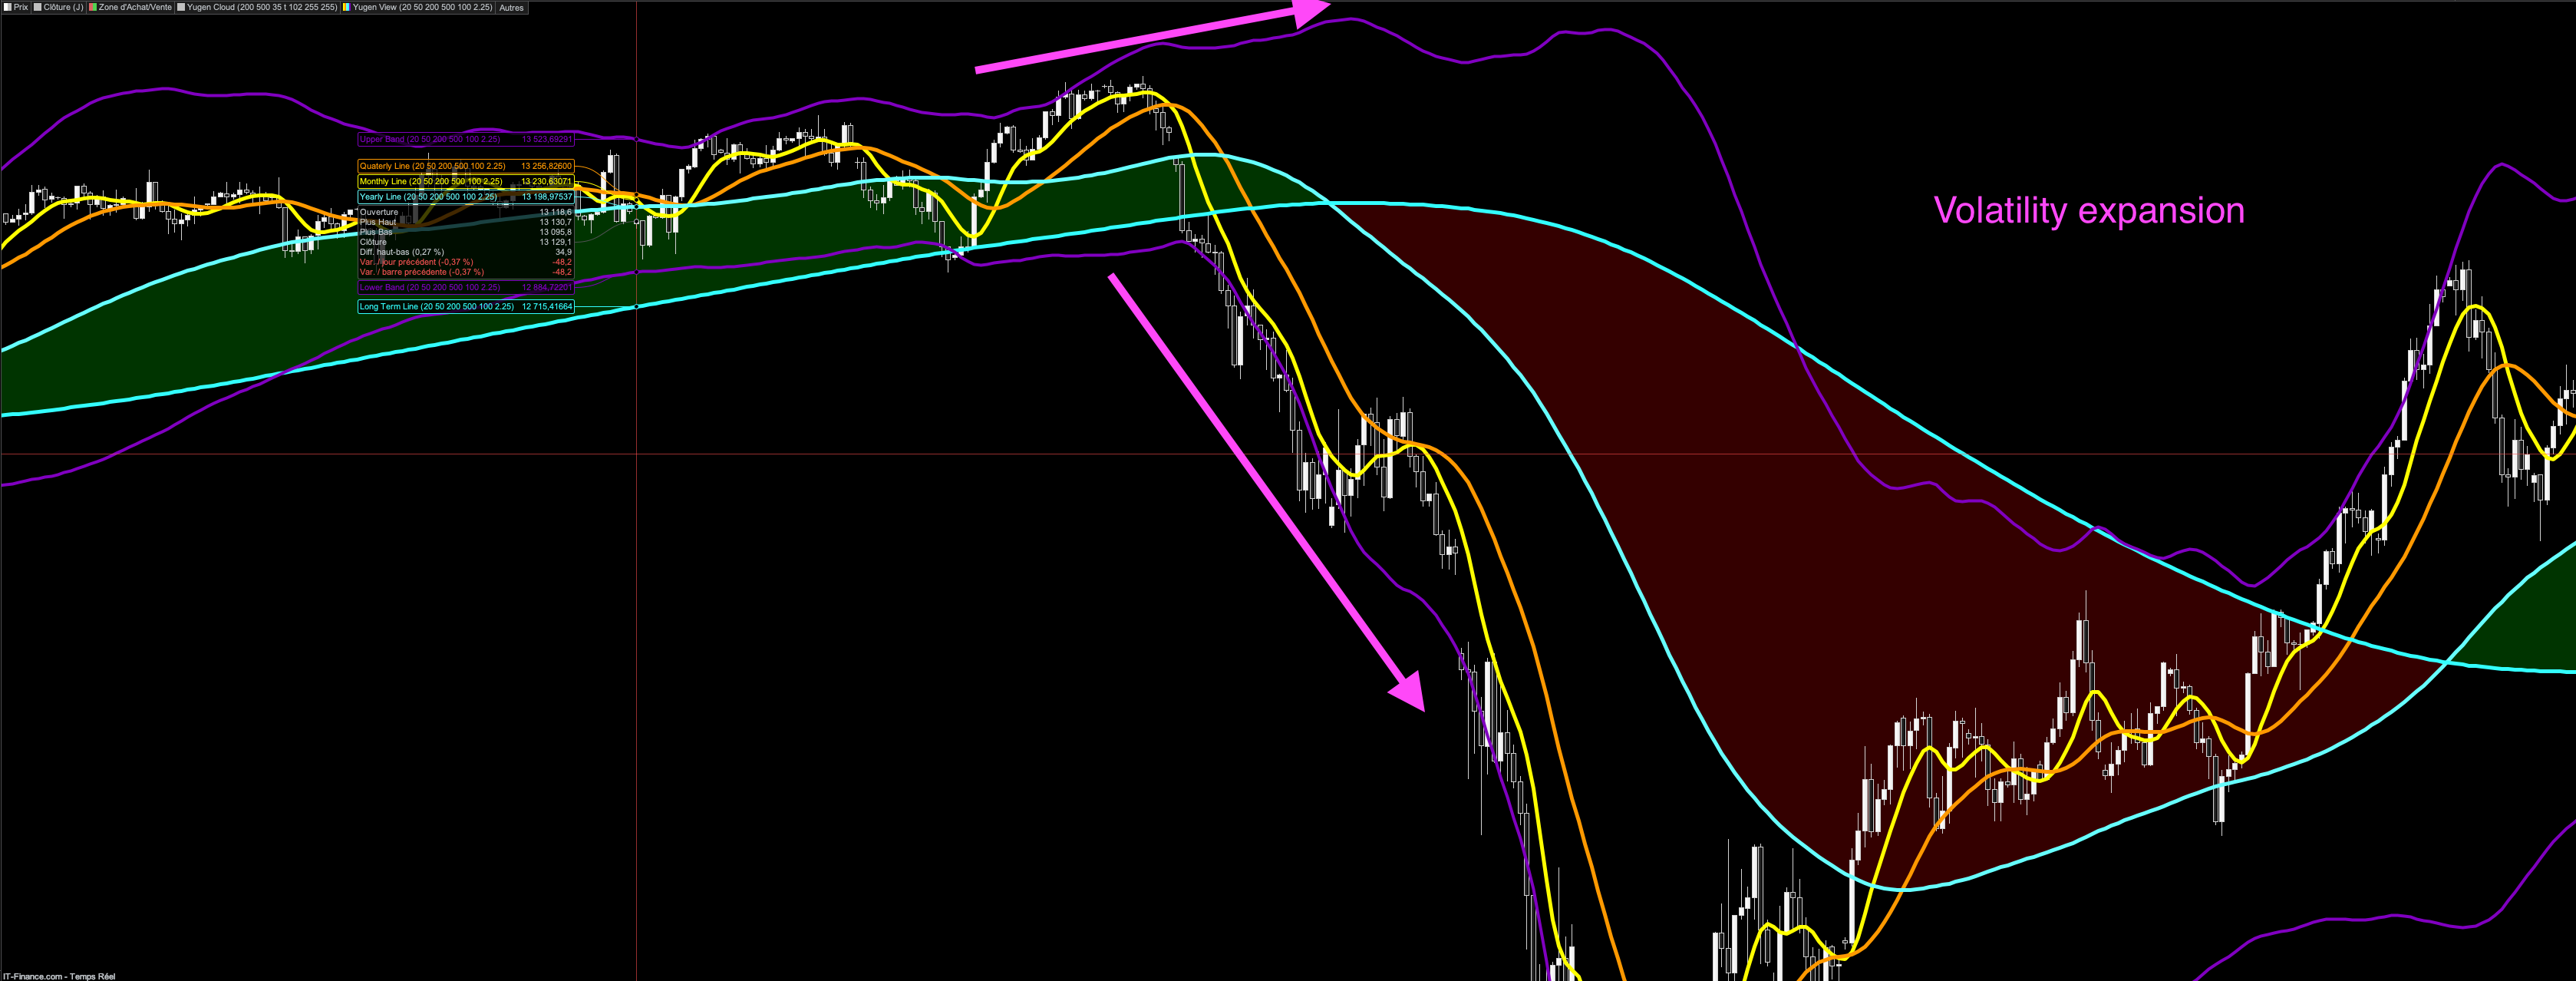
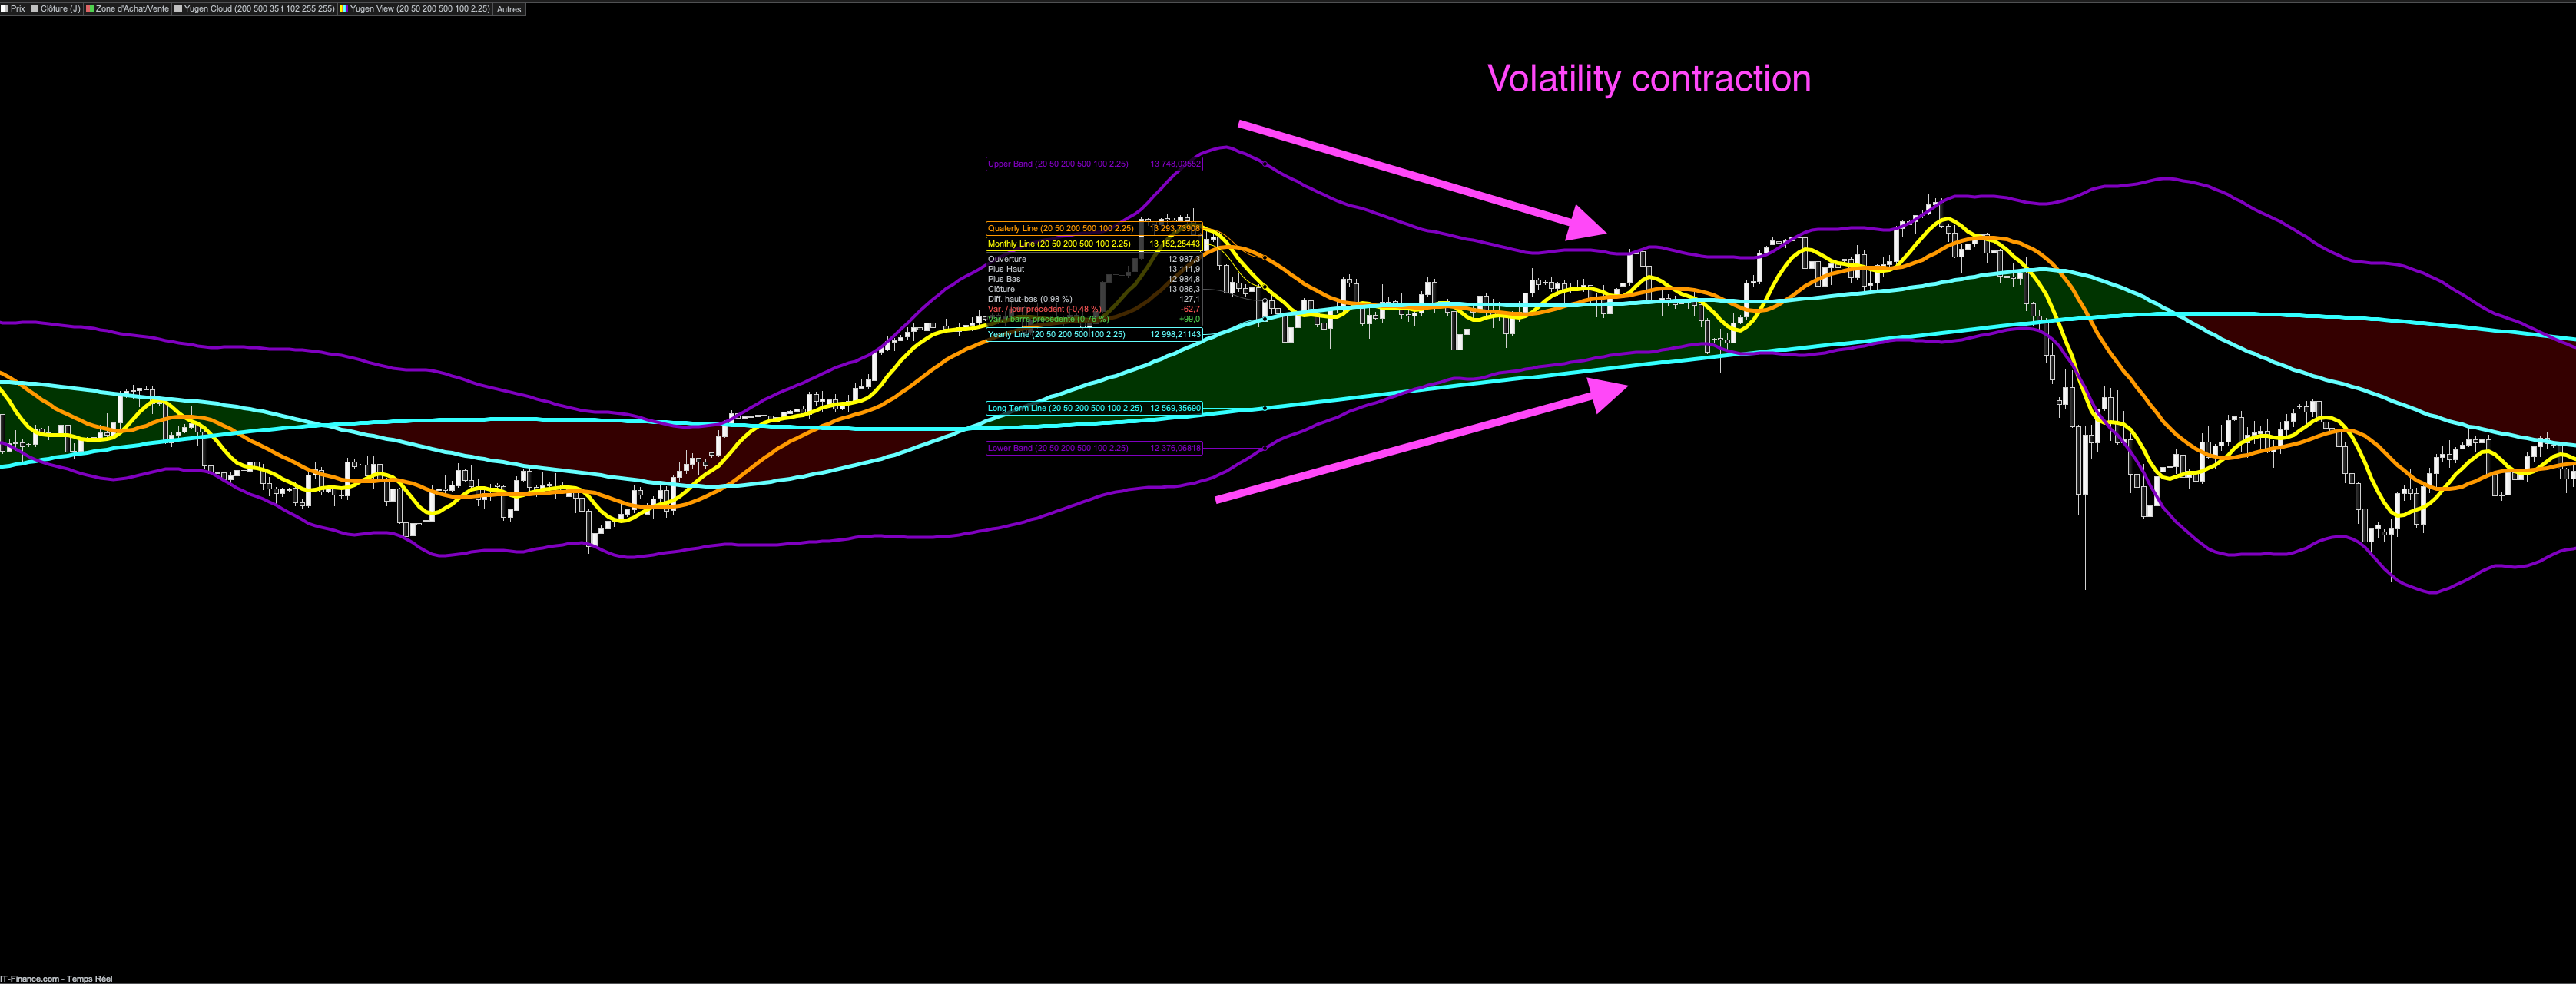
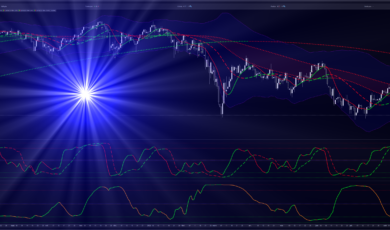
But what do we do with the Chikou Span? When you think about it, it is a kind of volatility indicator: when it is flat, volatility is low and we are in a small range and when it is above the Kumo, we are in a trend. I had the idea to replace the chikou with my absolute deviation bands, a robust indicator that measure volatility. We measure the same type of quantity, but with a more modern tool.
The default setting for the volatility bands is 100 periods (one semester, param v) with a spread of 2.5 (param n). With this period length, we measure the volatility that results from the power relationship between the cloud and the faster line pair. This is especially useful in counter-trend positions, for example.
How to install Yugen View ?
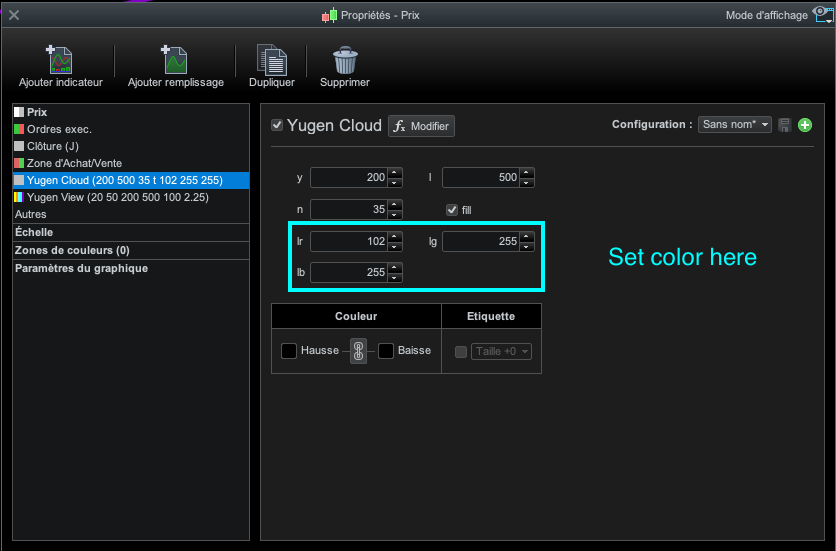
You just have to add the Yugen View and the Yugen Cloud indicator to your charts, with the default settings. You can adjust colors to your needs. Yugen Cloud, as it draws « in the future » can not use Prorealtime normal color picker. Instead, you have to set lr, lg, lb to your needs.
How to use Yugen View?
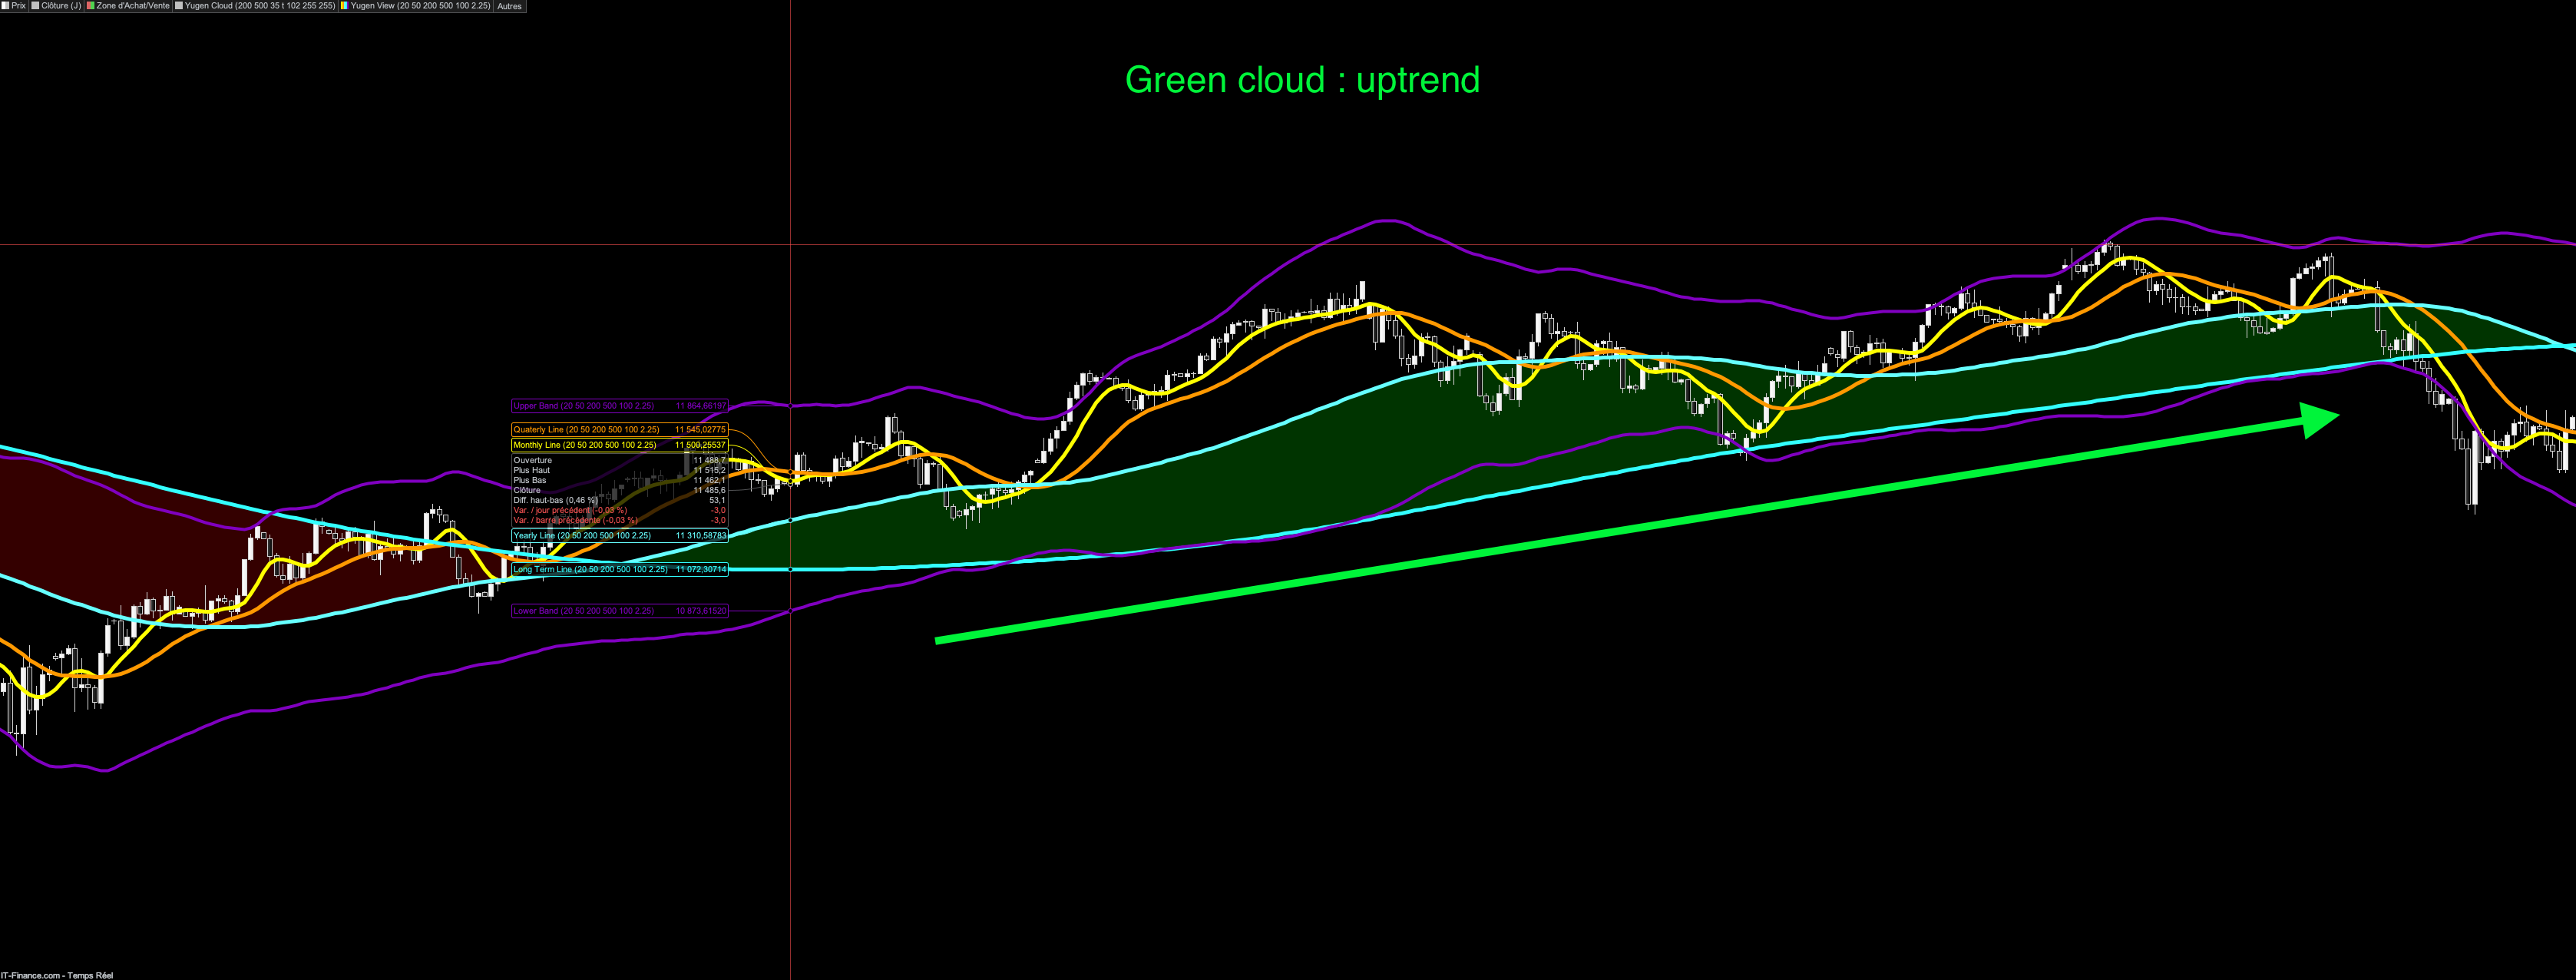
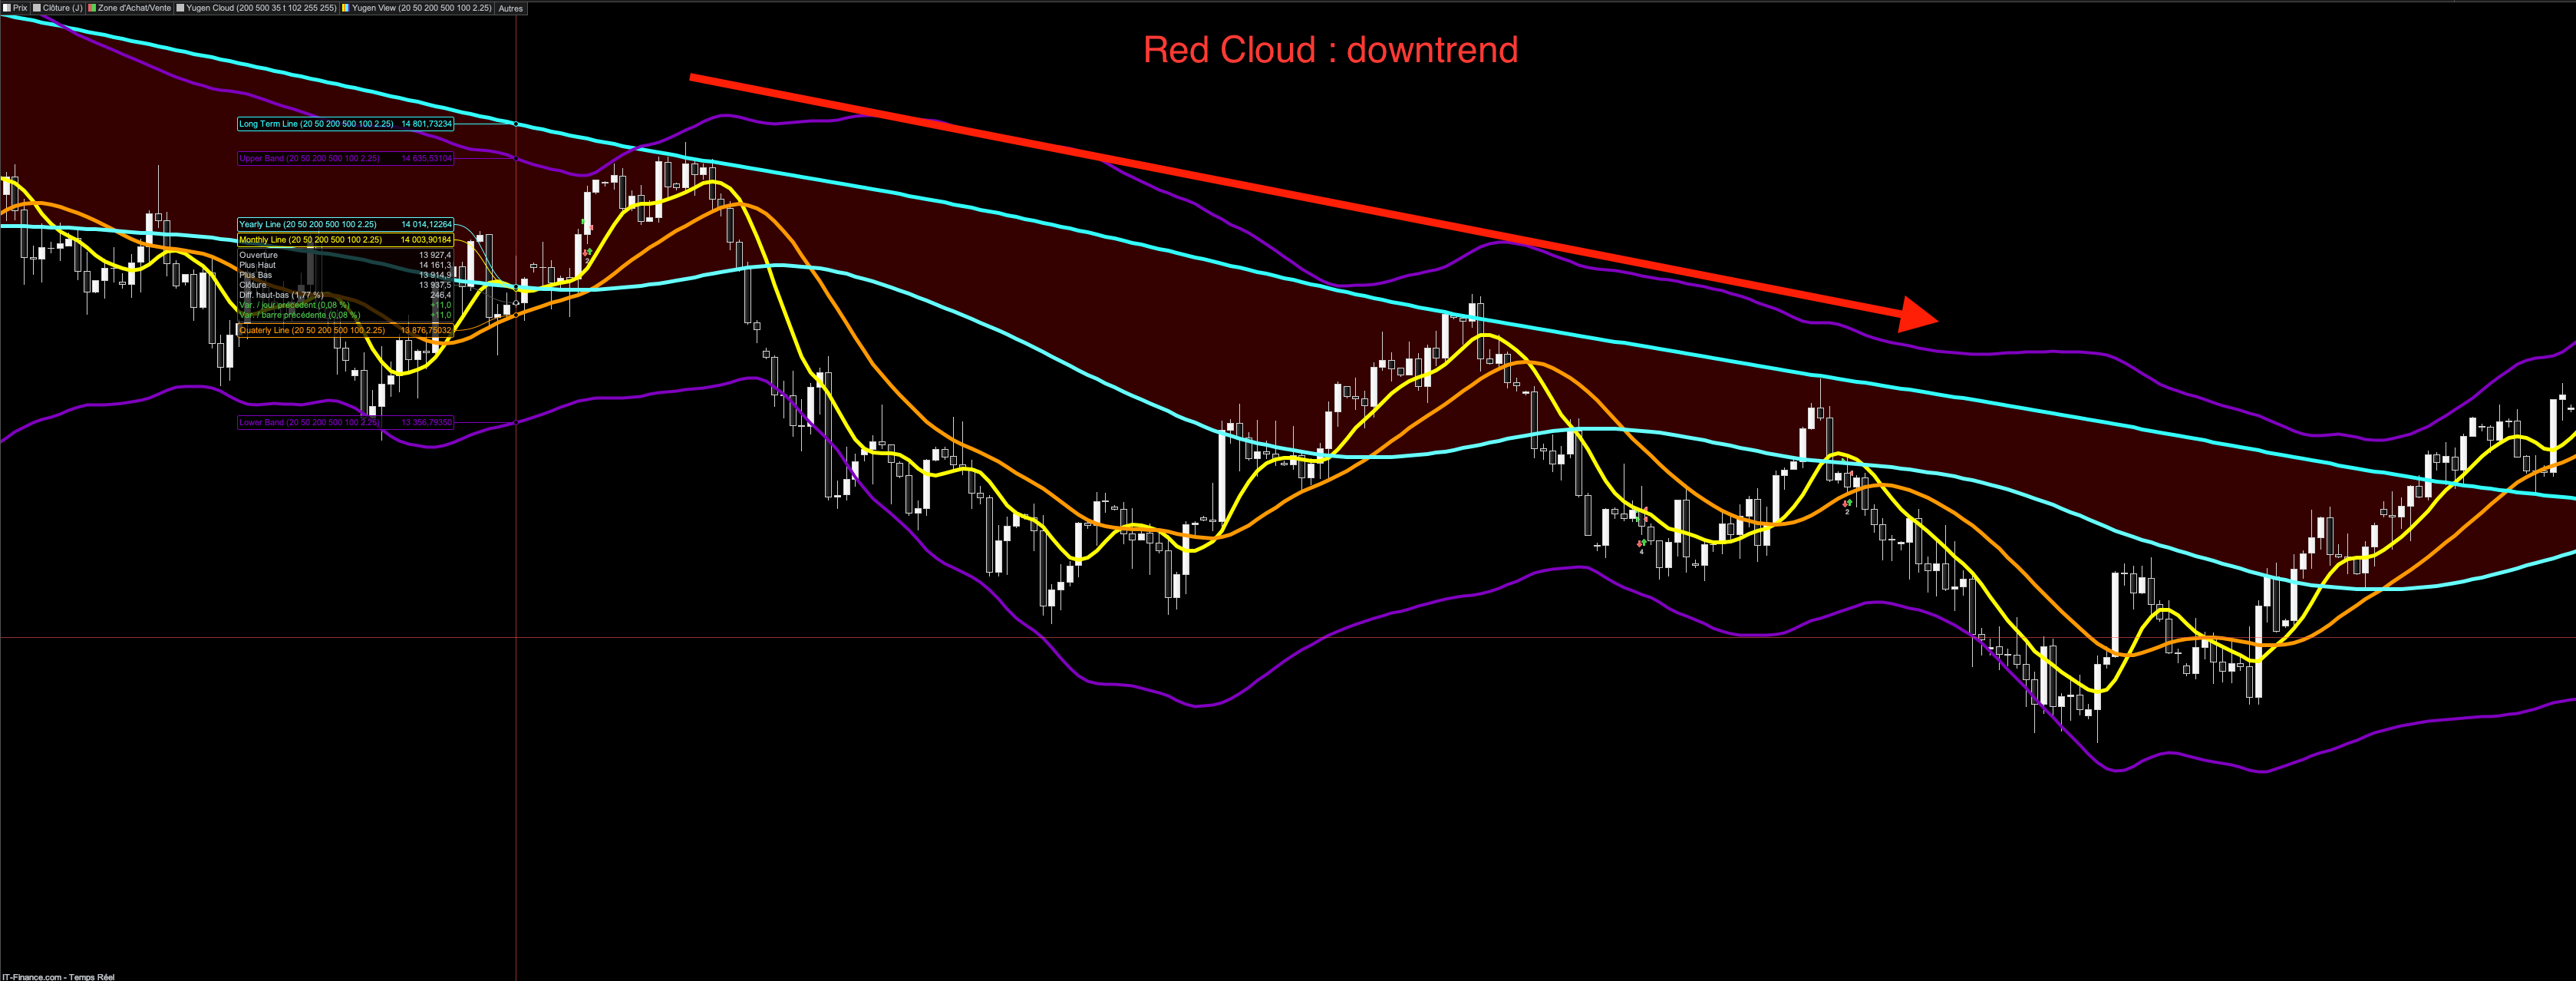
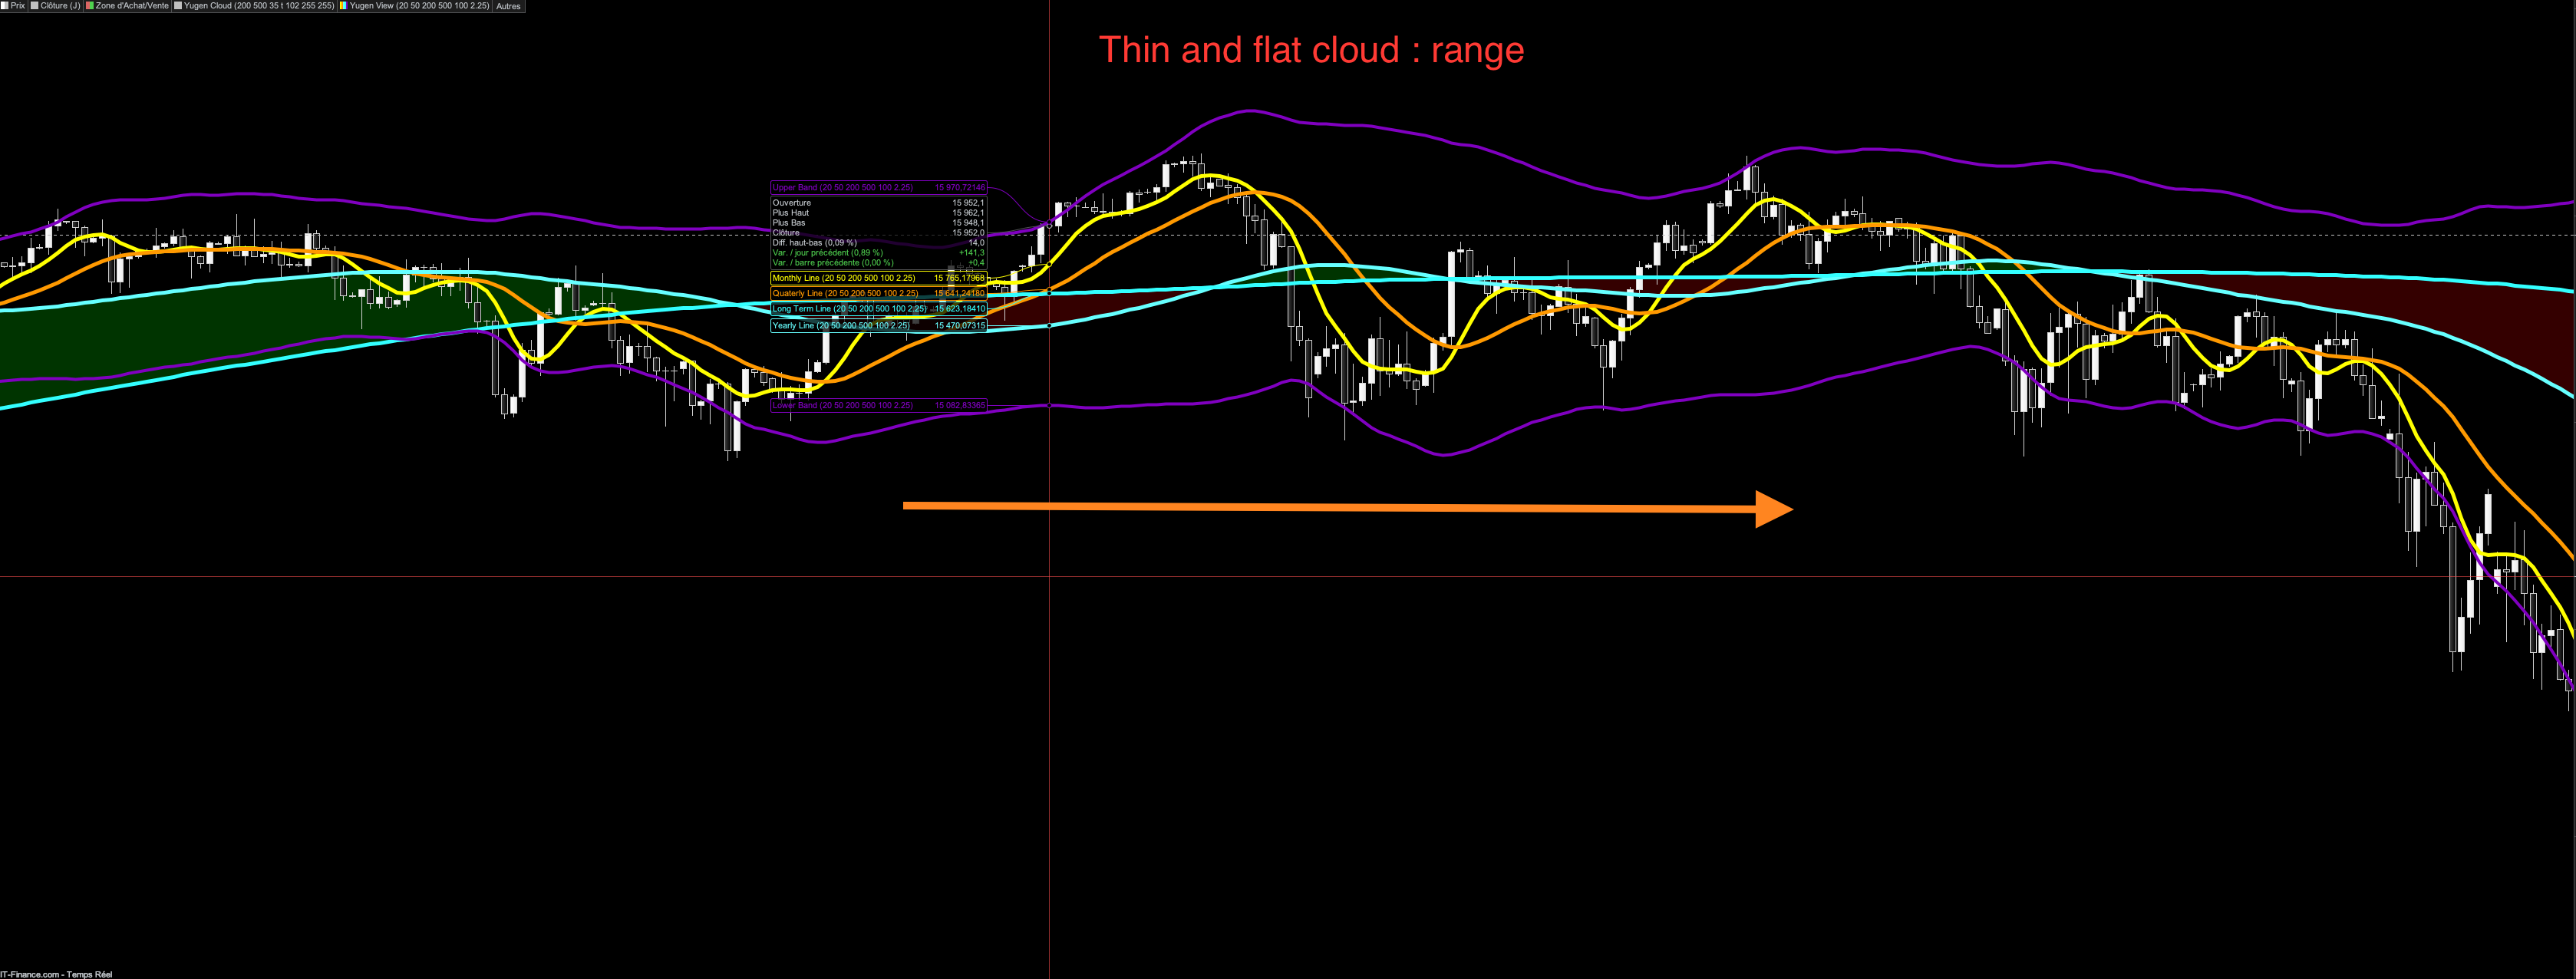
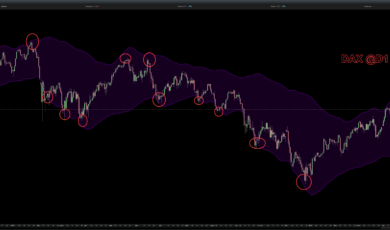
I advise you to keep the default settings, as for the Ichimoku. Indeed, most of the rules of Ichimoku are relevant to Yugen View. You can refer to the product media gallery to get an idea of the indicator behavior.
I am sure you will like this indicator as much as I do and I wish you a great trading.
Regards,
Bruno.
Avis
Il n’y a pas encore d’avis.