
With my first three indicators, we cover the first three moments of classic descriptive statistics :
- The Carnazzi Filter (CF) is a mean measure, the first order moment
- The Carnazzi Bands (CB) are measuring deviations, the second central moment
- The Carnazzi Universal Oscillator (CUO) is a skewness measure, the third central moment
The last metric we need, from a descriptive statistics poit of view, is a measure of the kurtosis.
The kurtosis is a strange beast, and its interpretation has been debated for decades. You can read on Wikipedia that
The exact interpretation of the Pearson measure of kurtosis (or excess kurtosis) used to be disputed, but is now settled. As Westfall notes in 2014[2], “…its only unambiguous interpretation is in terms of tail extremity; i.e., either existing outliers (for the sample kurtosis) or propensity to produce outliers (for the kurtosis of a probability distribution).” The logic is simple: Kurtosis is the average (or expected value) of the standardized data raised to the fourth power. Standardized values that are less than 1 (i.e., data within one standard deviation of the mean, where the “peak” would be) contribute virtually nothing to kurtosis, since raising a number that is less than 1 to the fourth power makes it closer to zero. The only data values (observed or observable) that contribute to kurtosis in any meaningful way are those outside the region of the peak; i.e., the outliers. Therefore, kurtosis measures outliers only; it measures nothing about the “peak”.
Moreover, calculating a fourth order moment is not an easy task, as the higher the moment, the harder it is to estimate, in the sense that larger samples are required in order to obtain estimates of similar quality.
For now, all we have to understand is that kurtosis measures the tails of your distribution : they can be heavy-tailed or light-tailed relative to a normal distribution. If you have a light-tailed distribution, this indicates that your points are more grouped around the peak (the mean) and vice-versa. This property is interesting for traders because, for us, fat tails means “trending” (values are far from the mean), and light tails means cycling (values are near from the mean).
But, I have said before that kurtosis is hard to interpret and we need something more intuitive for our operations.
In my quest of a better solution, I had a look at fractal dimension. While the concept is pretty interesting, its applications are not very practical : they are many definitions of the fractal dimension and many approximation algorithms. I had the same observation about the Hurst Exponent : they are many estimators : the rescaled range (R/S) analysis (on which you sometimes need to apply the Anis-Lloyd correction), the Detrended Fluctuation Analysis (DFA), and so on…
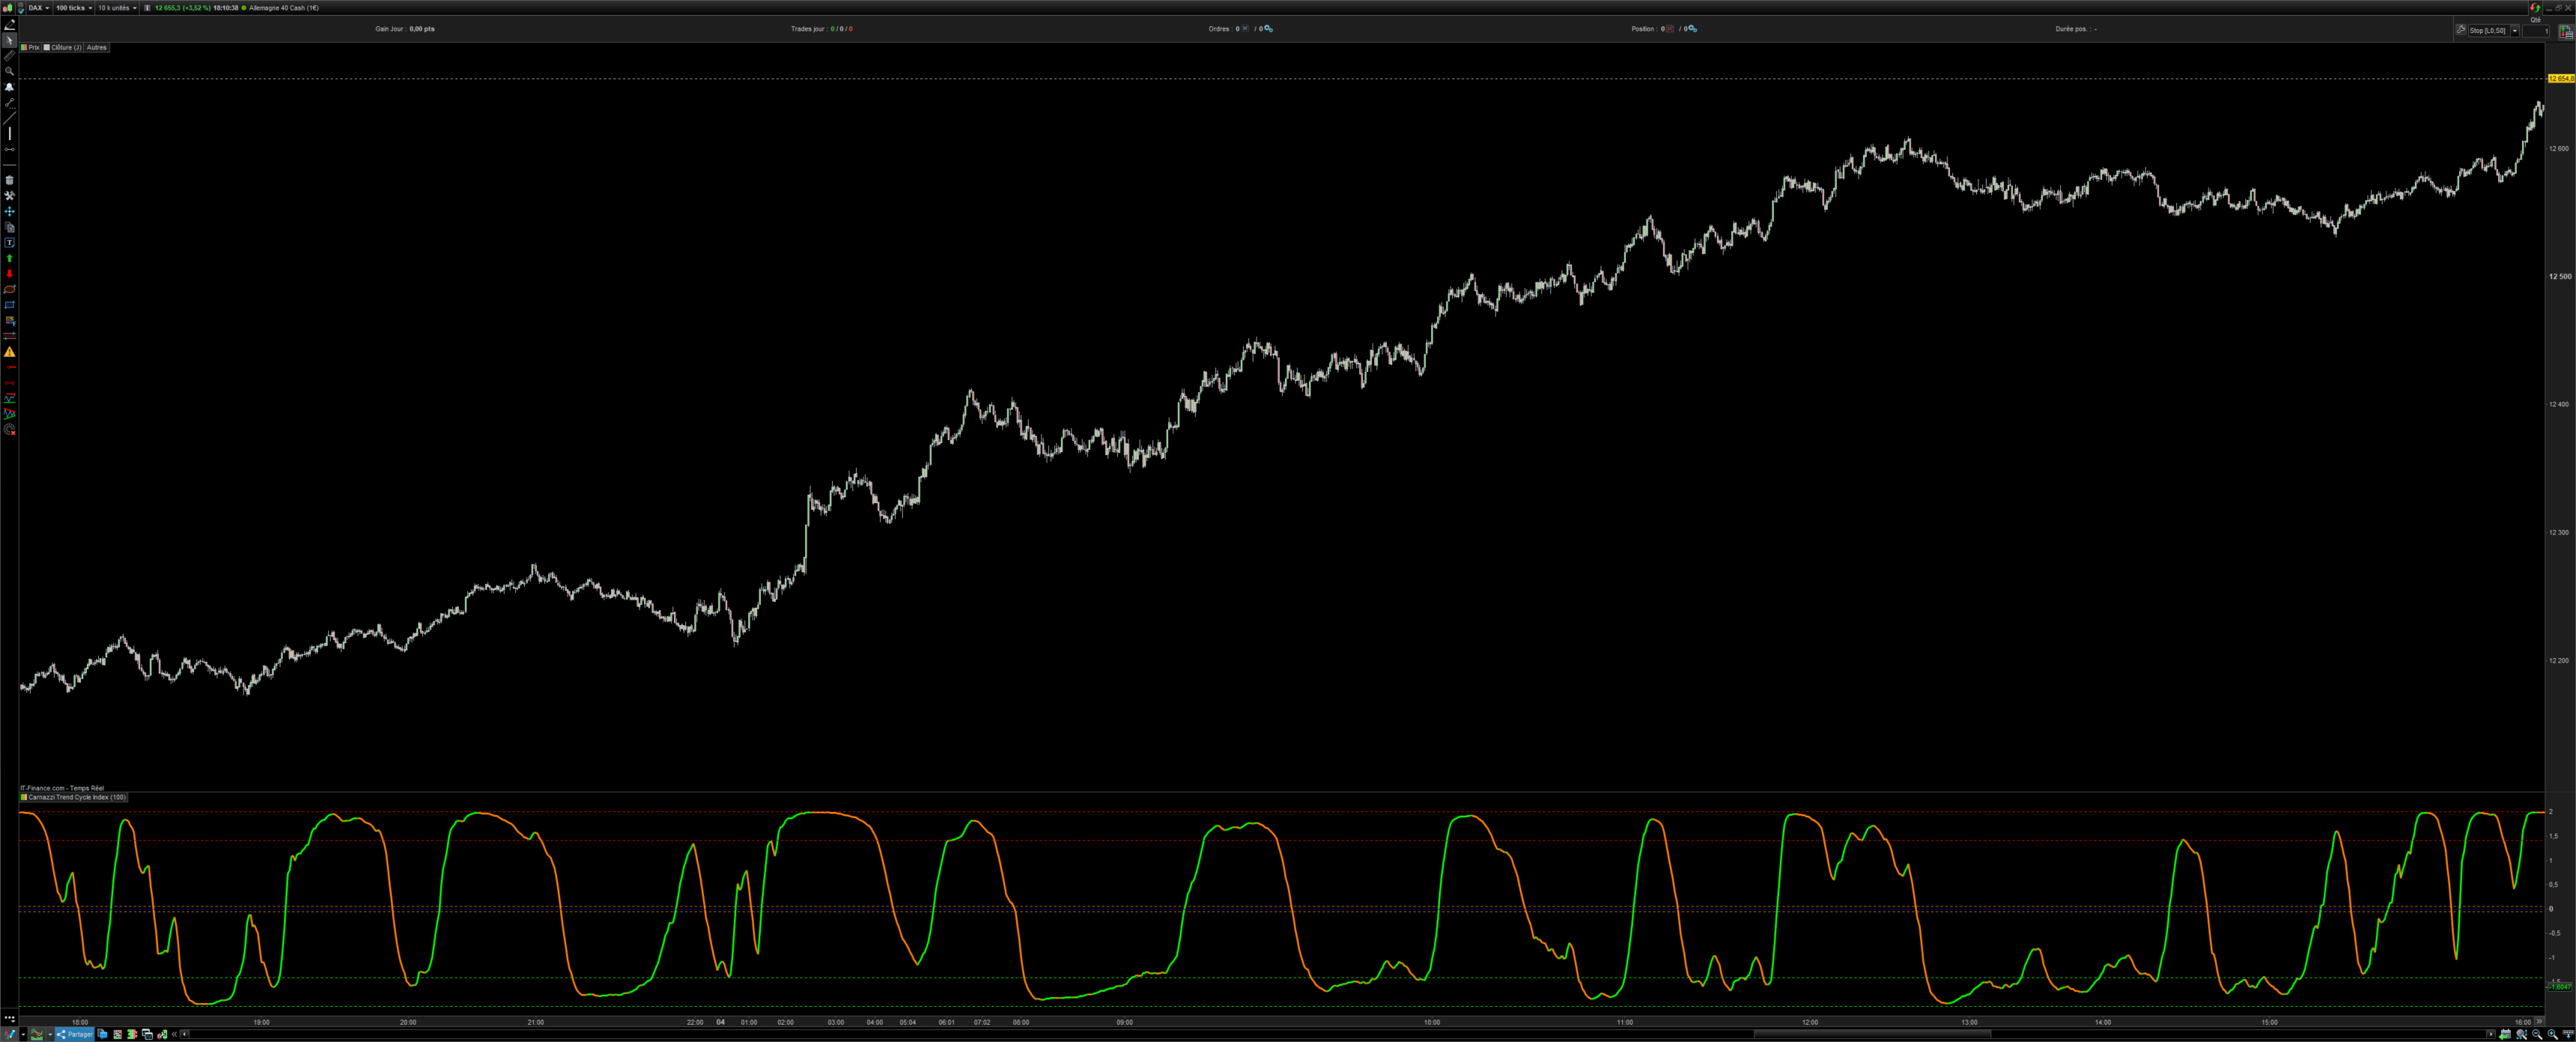
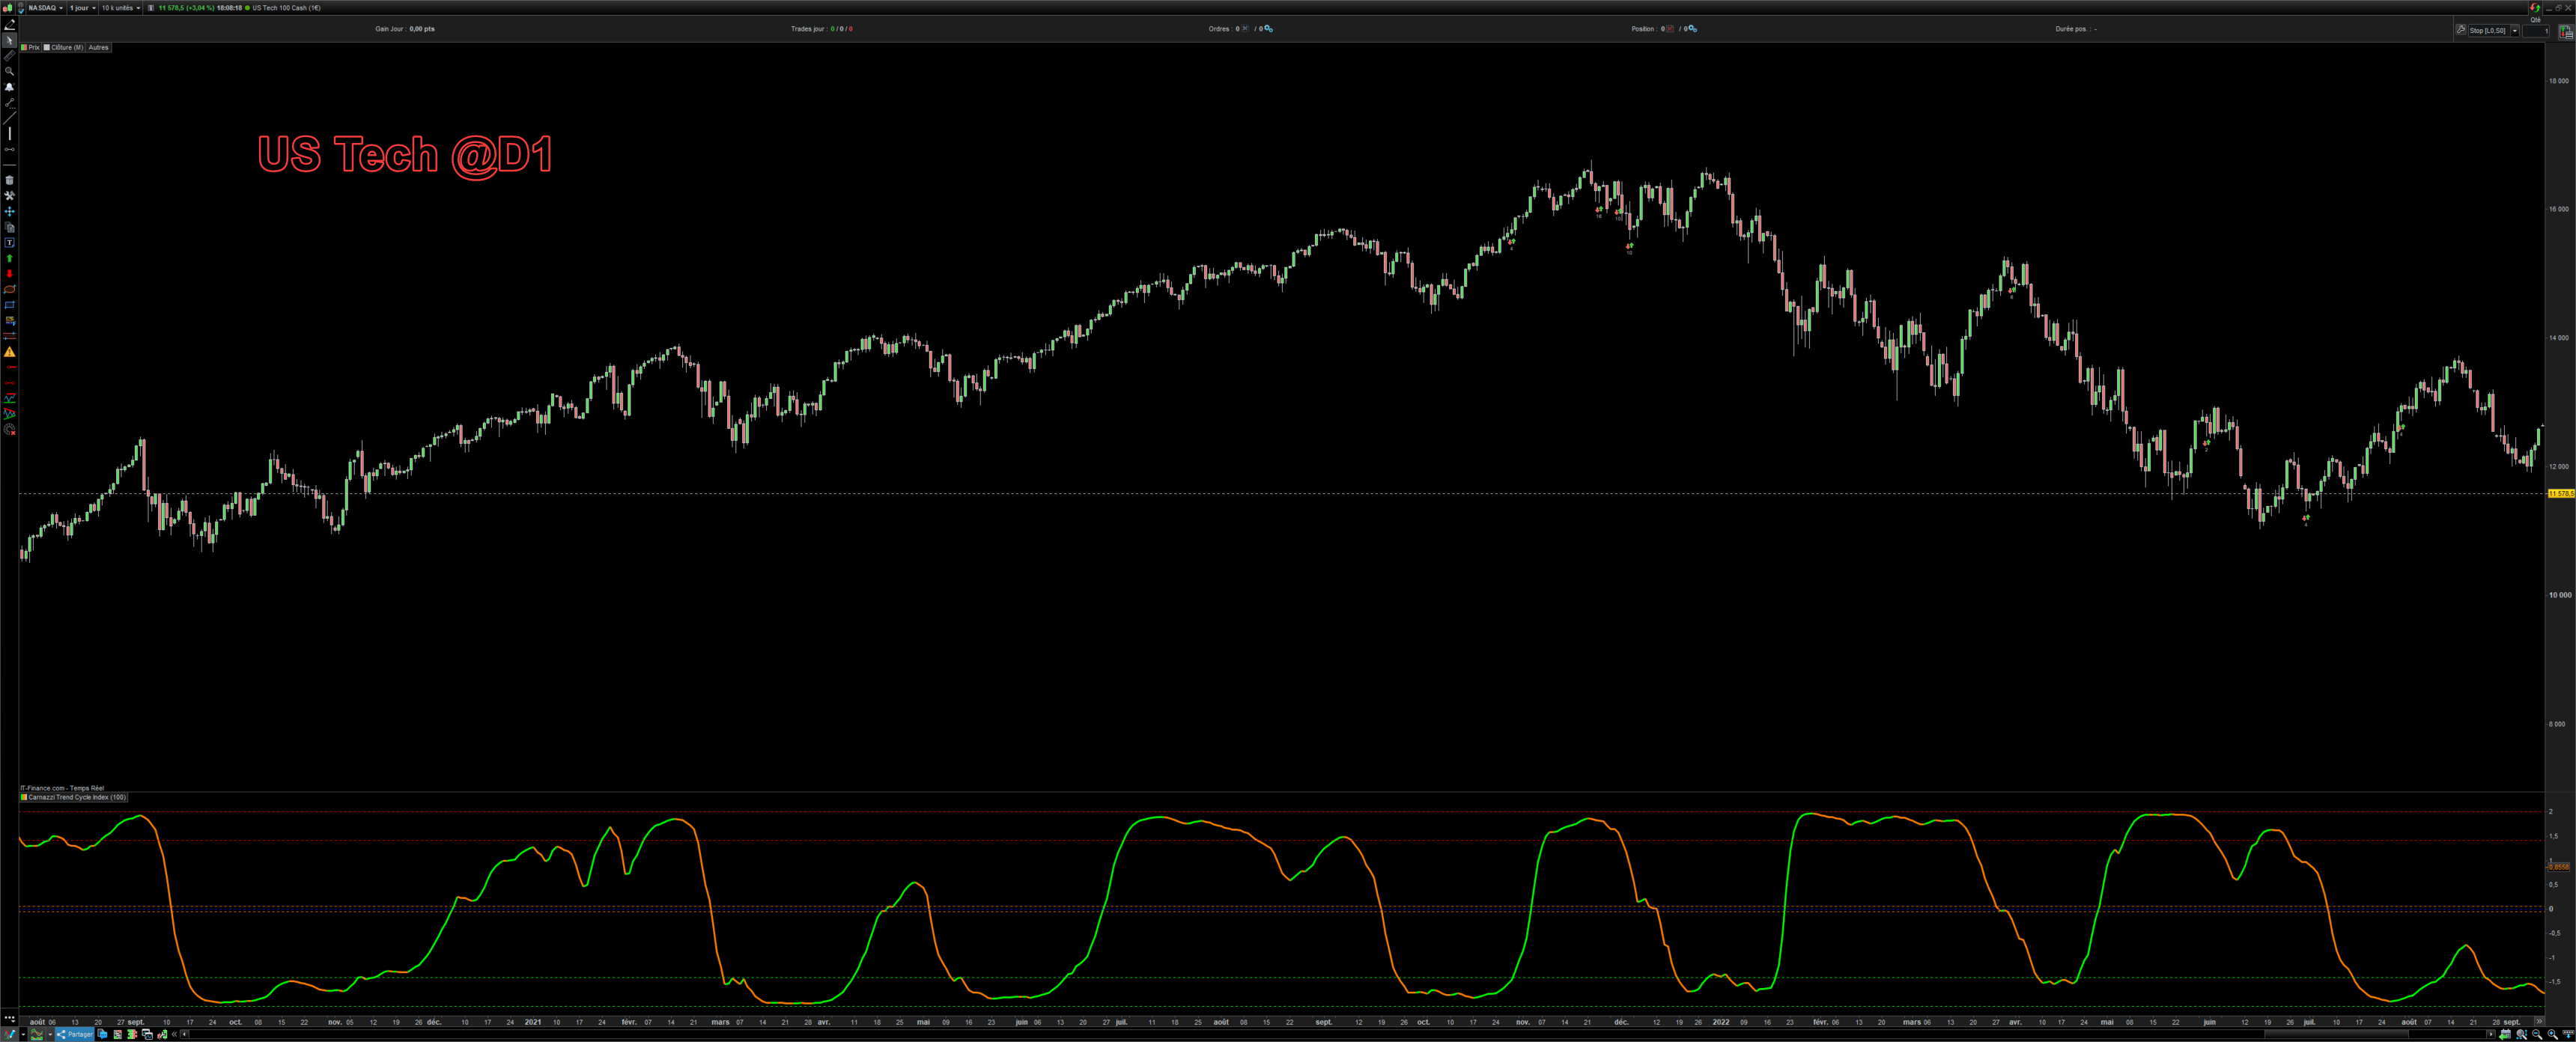
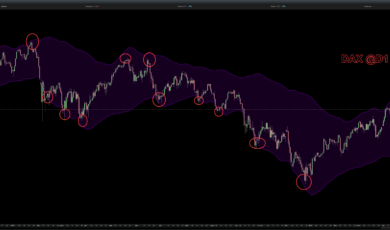
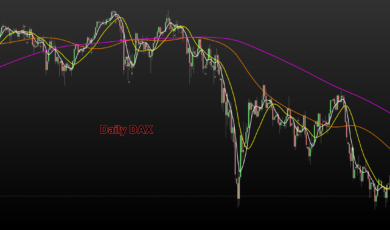
So I decided to design my own metric. The idea behind it, is if a fourth order moment indicator is hard to design, why not combine two second order moment ? This is what I have done, the CTCI measure in relatity the deviation of the deviation and the results were quite impressive, as you can see in the provided screenshots.
How to use the CTCI ?
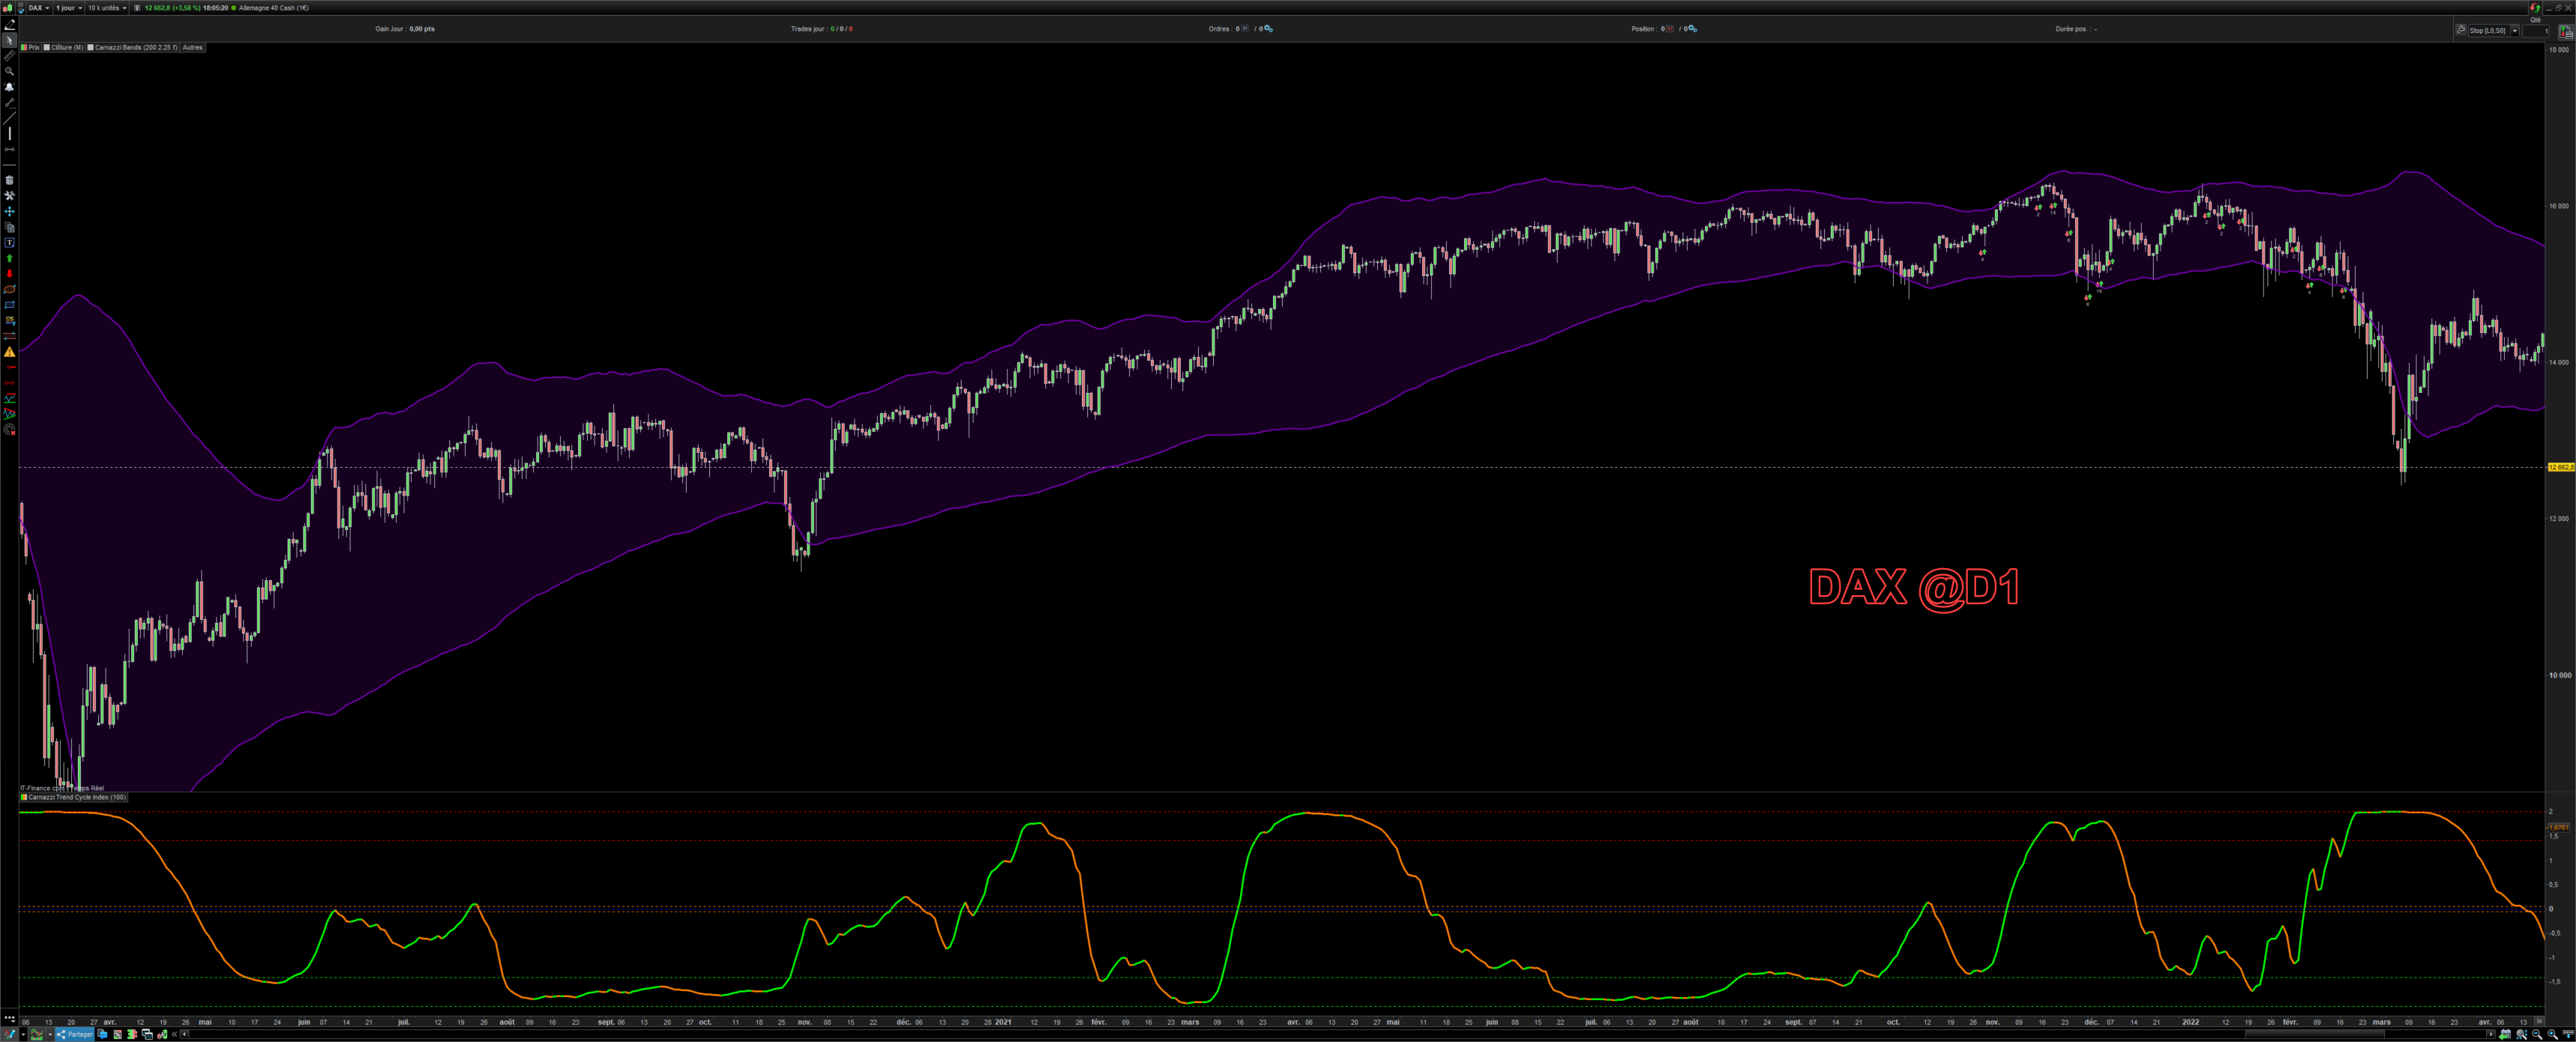
The CTCI is best used with the Carnazzi Bands (CB). I suggest you to use a period which is half of your bands period. This way, you’ll get early signal on market mode transtion, from cycling to trending or vice versa. The default setting is period=100, to be coherent with the bands defaults.
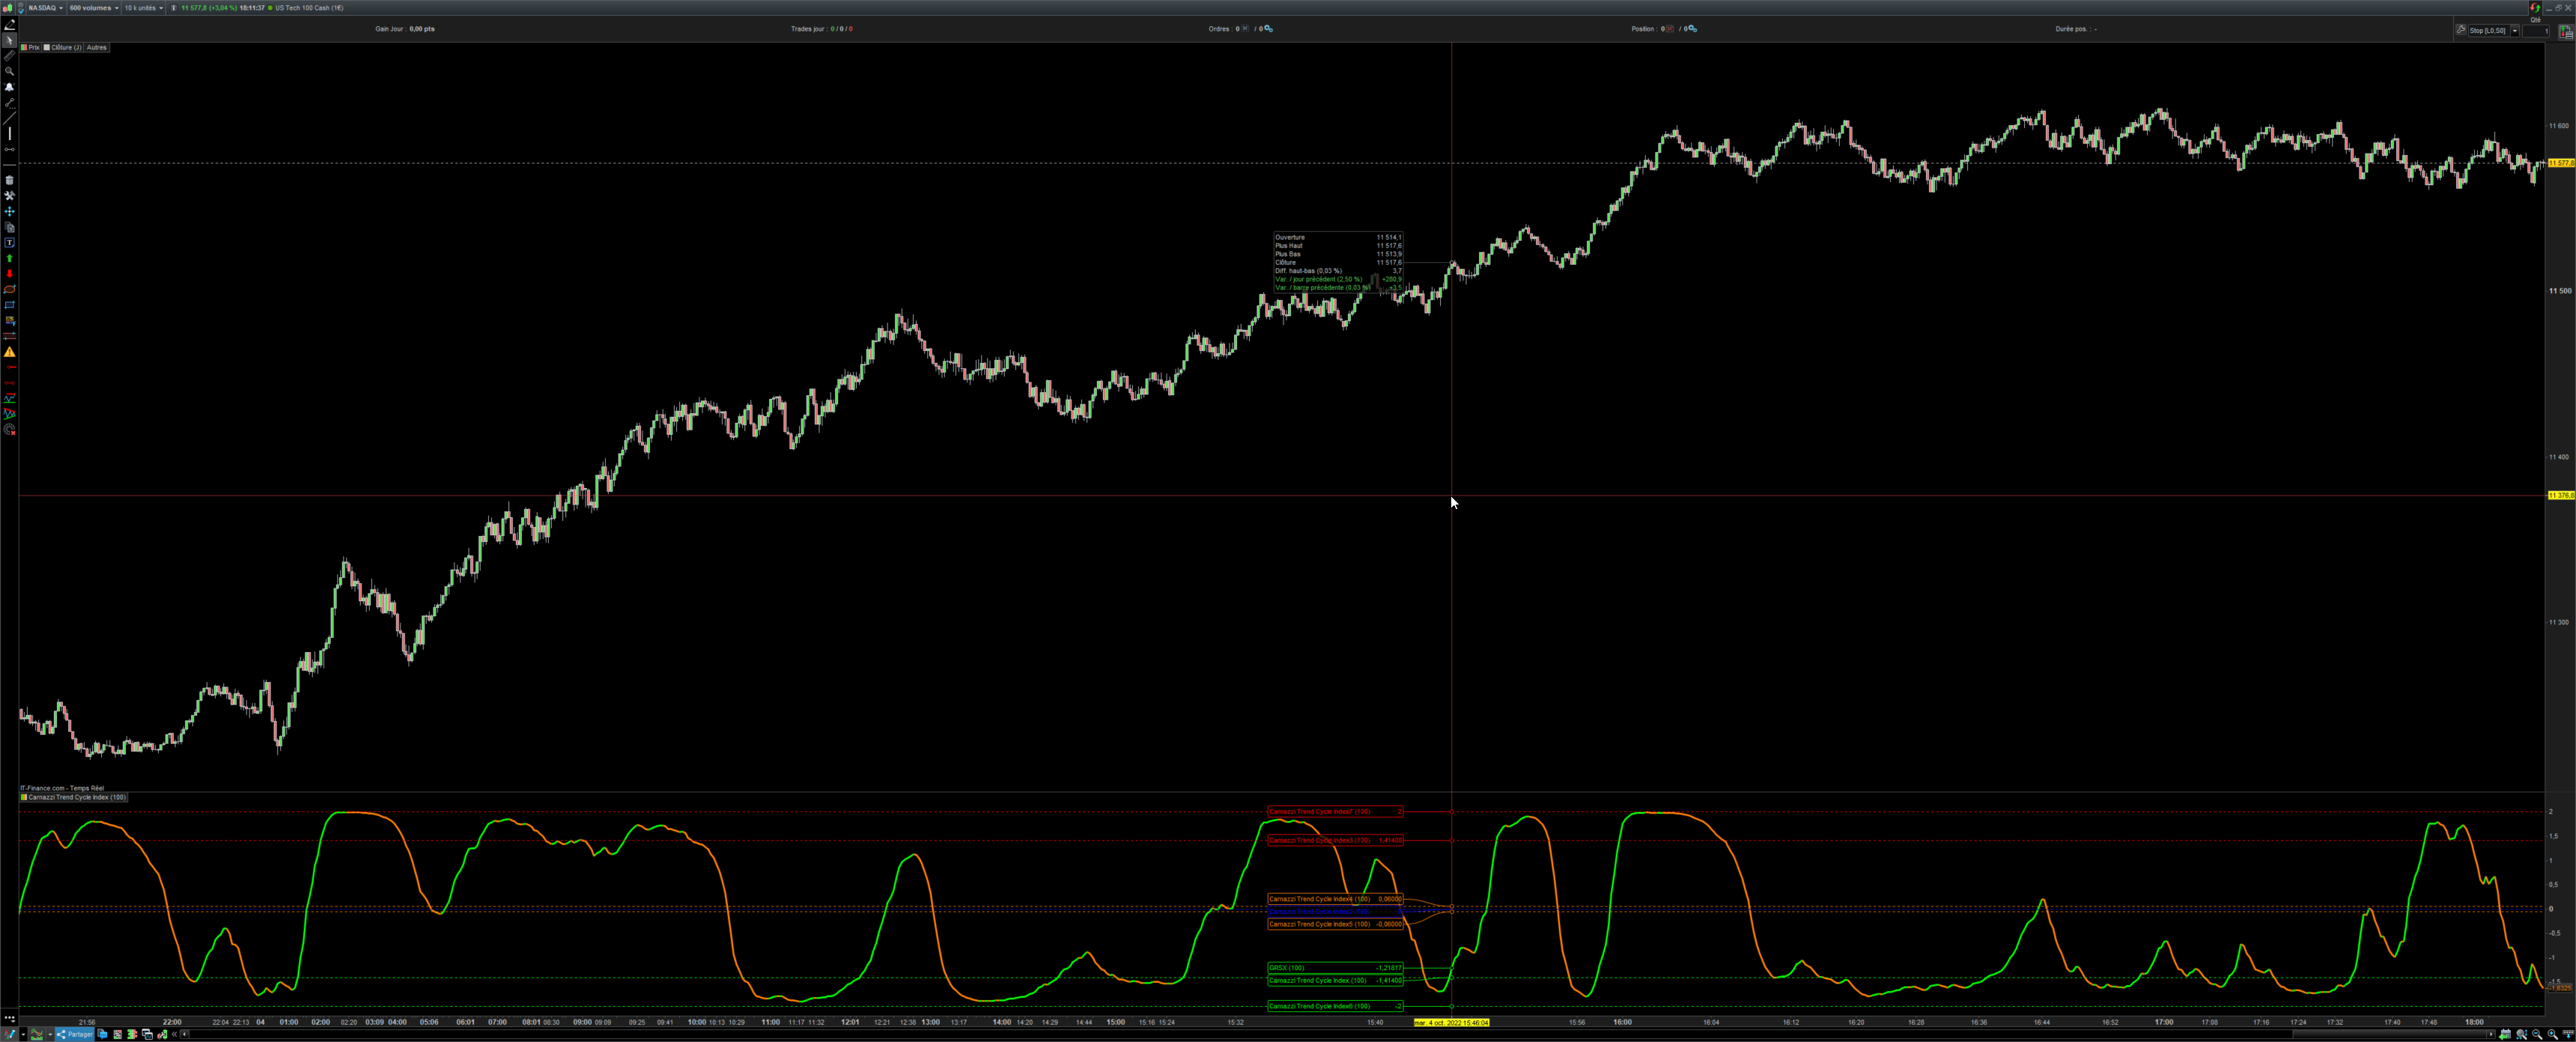
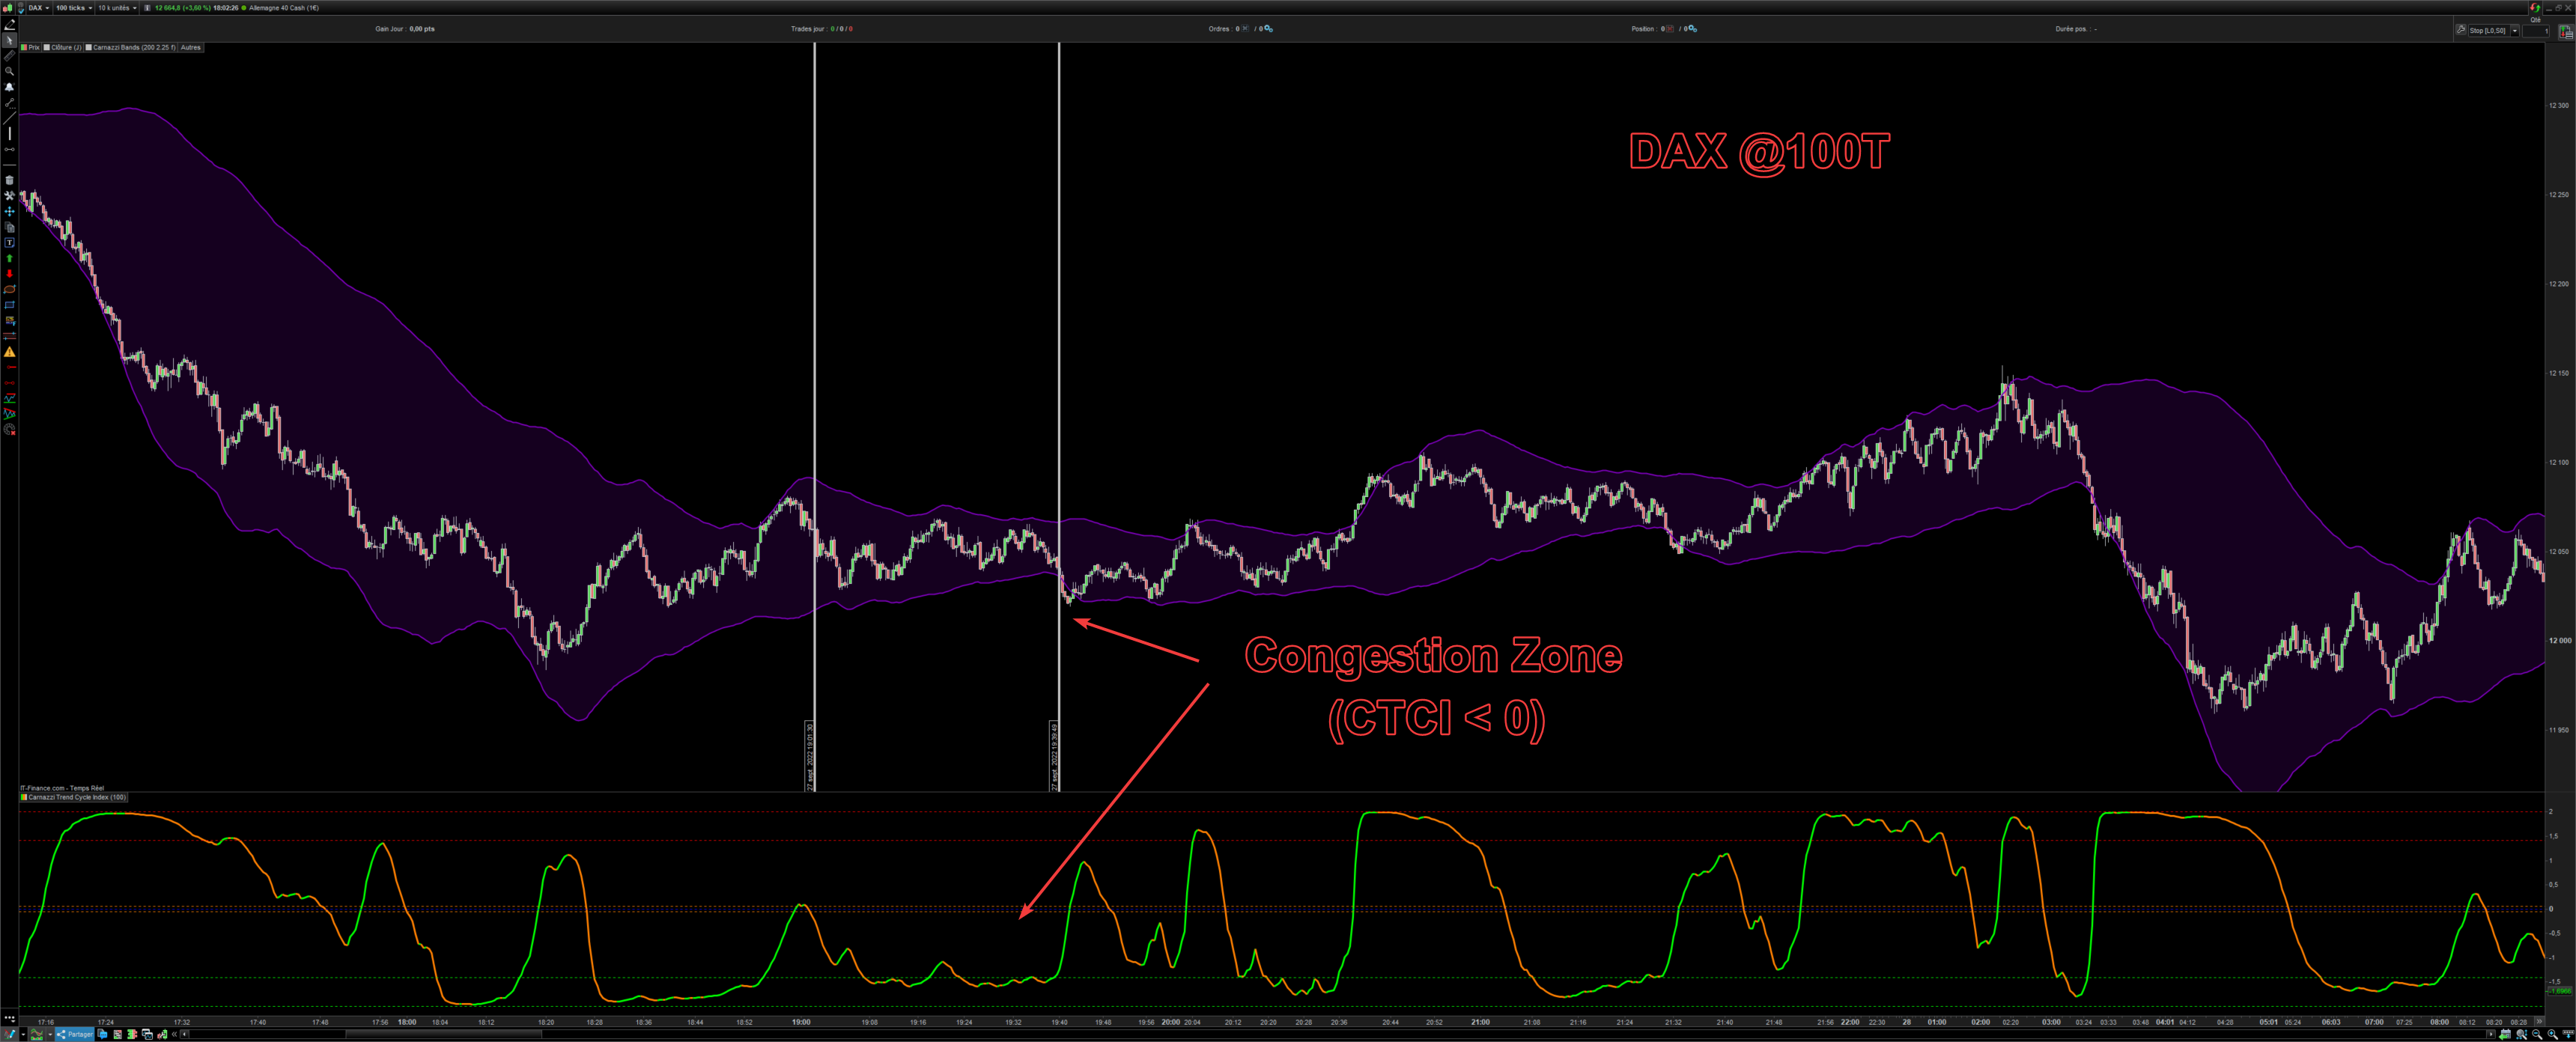
The interpretation is quite simple. When CTCI is below 0, the market is in cycling mode. It’s the best time to play with the band edges, and take advantage of small price movement. You can also track acceleration by waiting for CTCI to increase and bands to widen :
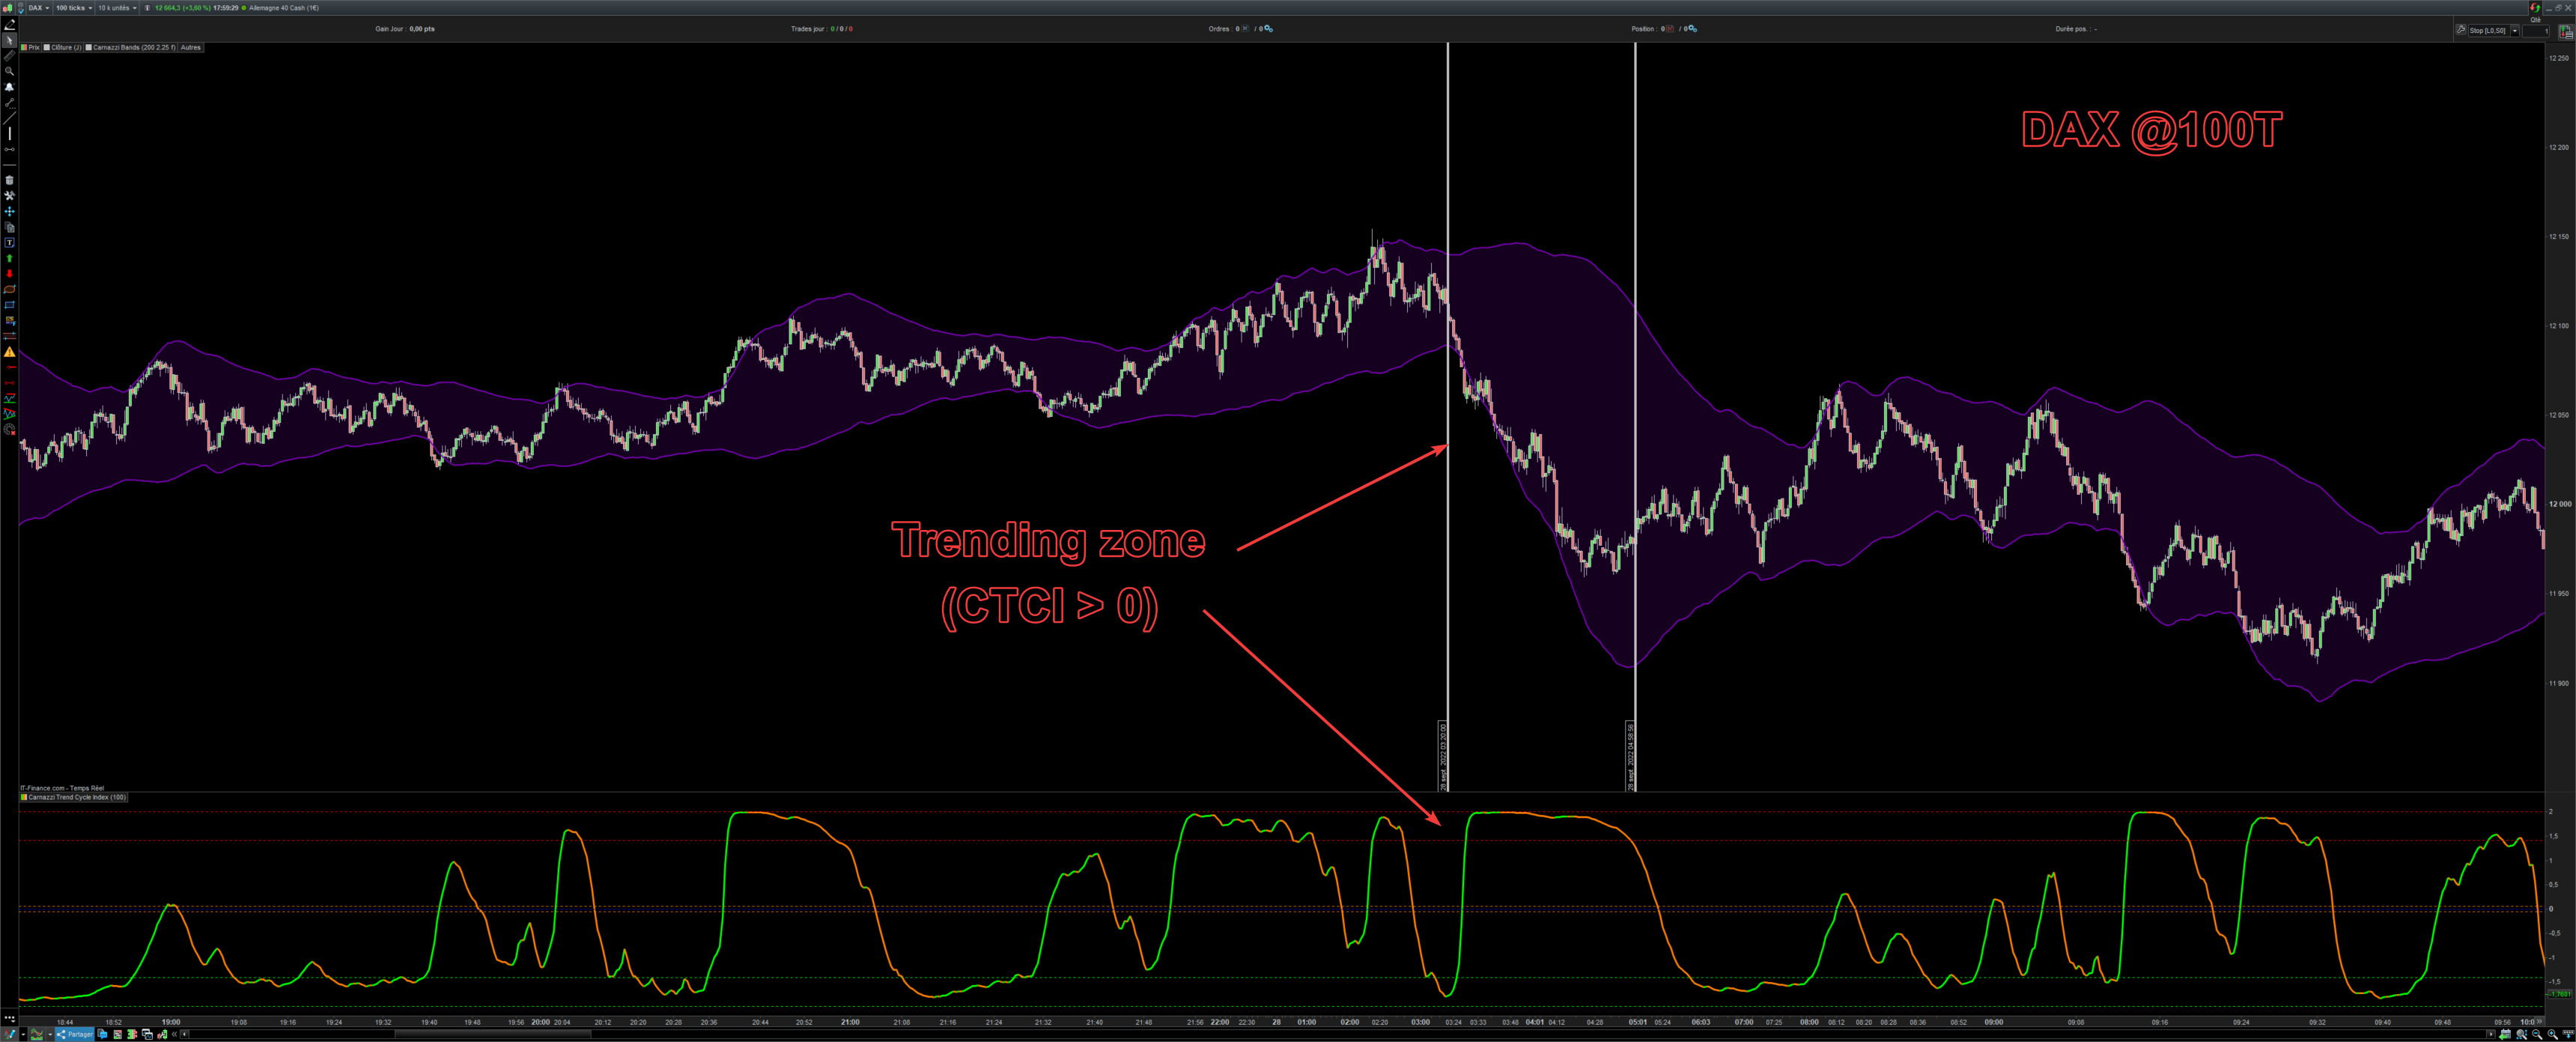
Consequently, when CTCI is above 0, the market is in trending mode. It’s best time to rely on a trend indicator, as the Carnazzi Filter. In trending mode, you have to stay in position until the trend decelerates. This event corresponds to a decrease in the CTCI and the price will tend to move away from the edges of the bands :
As you can see, the goal to produce an intuitive market mode indicator, trully computed and not estimated, has been reached.
I am sure that this tool will bring you the greatest satisfaction and I wish you an excellent trading.
Best regards,
Bruno.
Avis
Il n’y a pas encore d’avis.