TREND AND SIGNAL STRATEGY INDICATOR AND PROSCREENER
First of all the Trend and signal indicator,
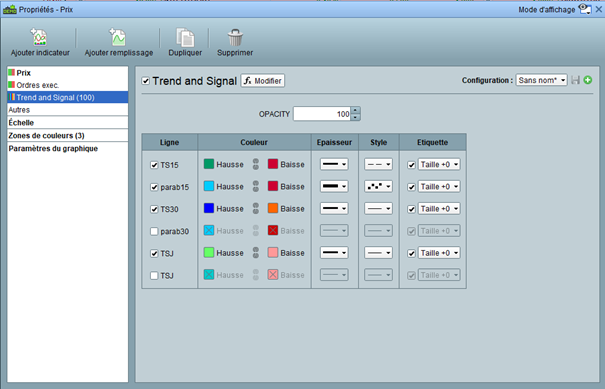
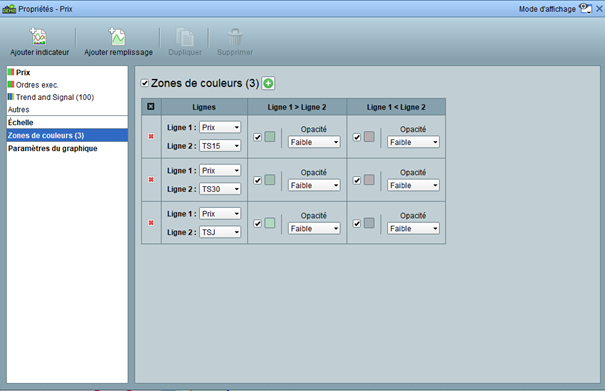
The settings must be made according to Annex 1 and must be used on a unit of time in 5min
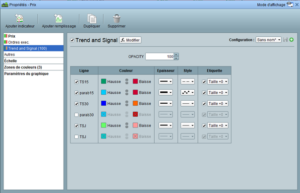
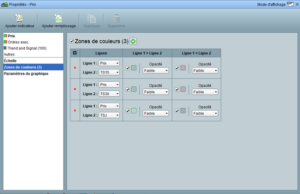
Filling as in annex 2 (the filling at the bottom right is black)
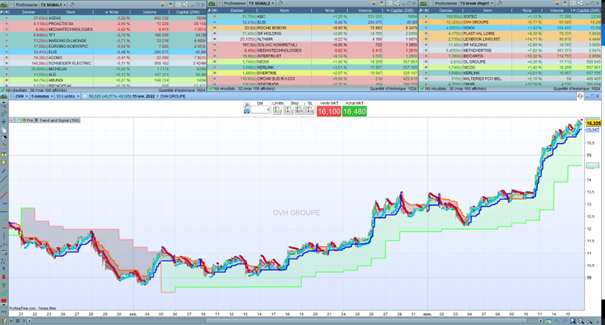
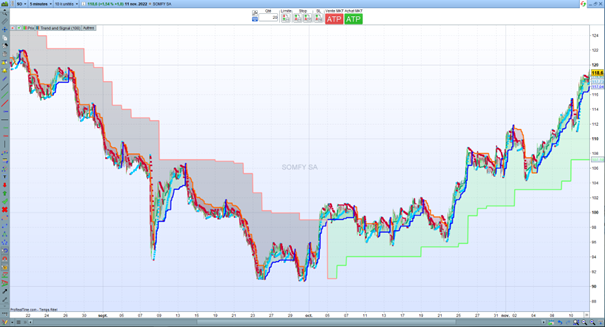
We get Annex 3
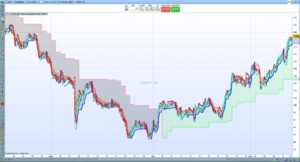
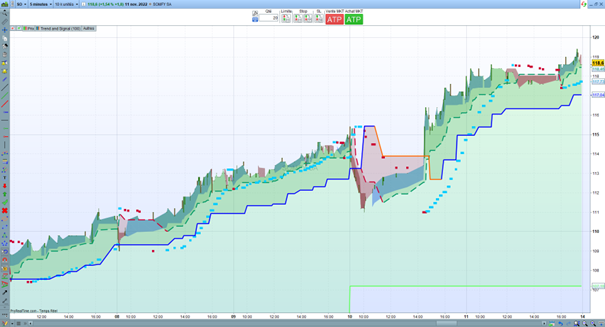
Ok it’s very colorful 😉 but already we can see some trends
The first dark and black zone is when we are under Ts in light green day above the Ts day
Annex 4
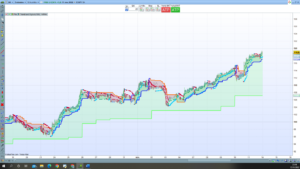
Thick line blue above the Ts in 30 min, orange below the Ts in 30 min
Annex 5
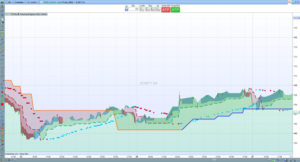
Dot red and green Ts 15min
We have our blue cloud and our red cloud
And to finish our parabolic sar in blue and red
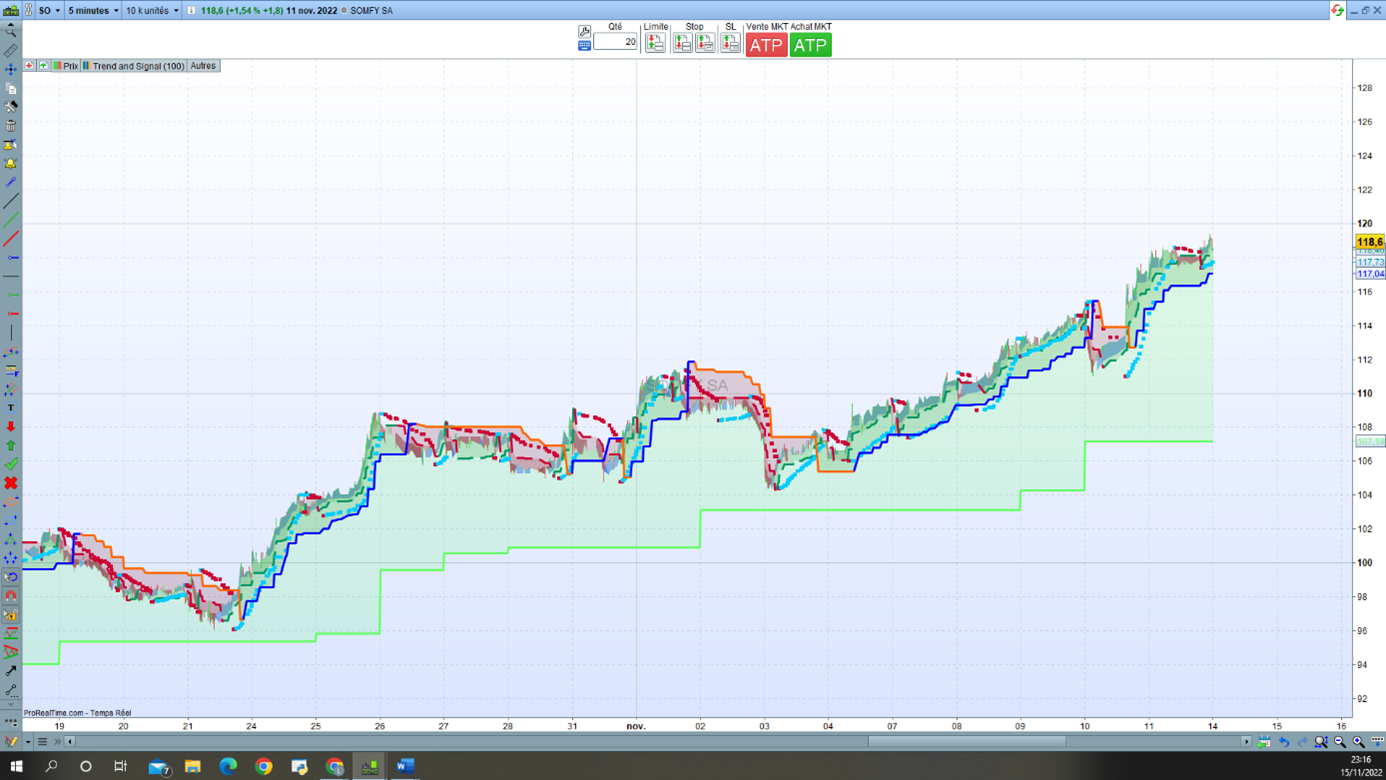
Description practical case Annex 6
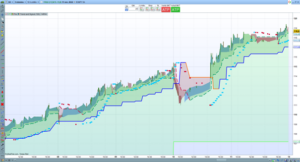
We are bullish in bullish day in 30 and 15 min
Bearish red cloud in 5 min but parabolic blue so positive for the moment
Annex 7
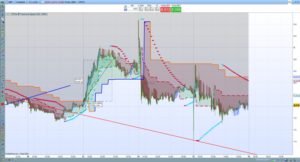
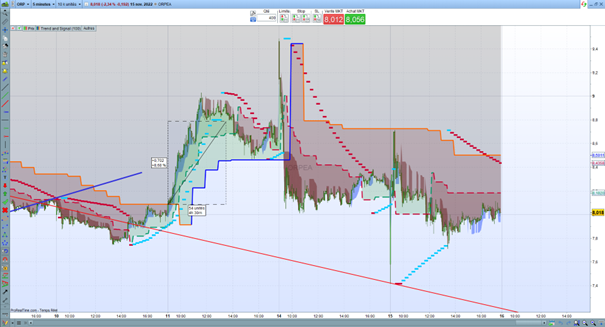
About Orpea
Bearish in day, 30min,15 min
Slightly bullish in 5 minutes
Buying signals
Annex 8
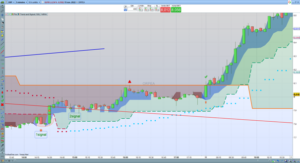
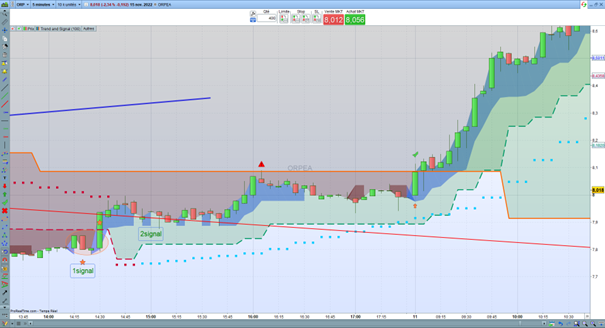
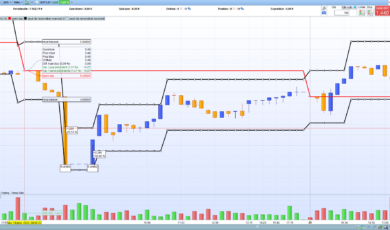
The first signal is made at the appearance of the blue cloud it will be confirmed by the 2nd signal in this example we will wait for the passage of the Ts 30 to validate and enter into position (in our strategy no position is taken on the purchase under the Ts30). The limit purchase will be on the 11th on the second candle with a limit purchase on the ts30 at 8.090 stop loss under the cloud that can be raised with the Ts 15.
For the exit of this Trade
Annex 9
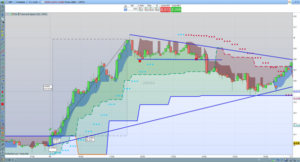
We wait
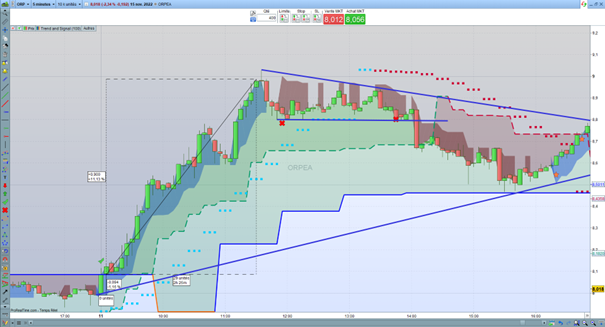
1° either the red cloud to exit part or all of the position
2 ° you stayed, a congestion forms, exit on the base
3° If you were too greedy, exit on Ts 15 knowing that the parabolic turns red and gives a first signal of a future drop
Other cases
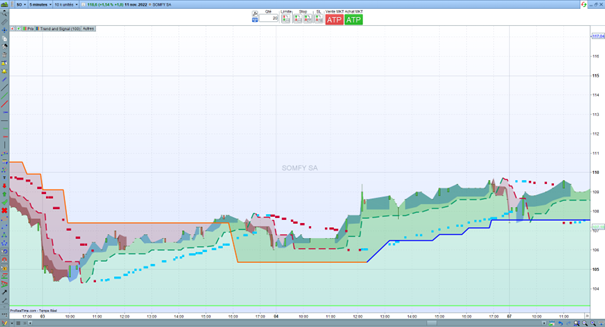
Annex 10
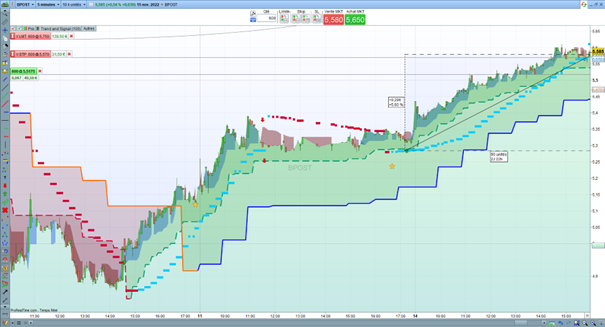
Bpost background trend bullish day 1st signal November 10 at 2:25 p.m., 2nd signal passage of the Ts15 but beware we are under the Ts30.
To return, either pay for the passage of the Ts30 (trigger threshold or pay the return on Ts 30 at the stop loss close on Ts15 that we will go up following the Ts 15
To go out either go out on red cloud at 11:30 a.m.
Either stop loss at 5.255 on Ts15
Then we have an upside recovery all timeframes are bullish GREEN cloud but parabolic blue small interesting buy.
Output on red parabolic, red cloud or st15
How to find the values
Either newS, high volatility, bearish or bullish excess, our other screeners when buying Bollinger bubbles, or 3 screeners included in the pack
Ts Signal 1 will give the appearance of the blue cloud only
Ts signal2 gives the values that have just passed the ts30
Ts break dhigh1 gives the values in bullish dynamics
This presentation is not investment advice and only gives an example of the possibilities of use, it is therefore intended for informed people.
Trend Analytica cannot be held responsible for any financial loss due to misuse or non-use of its products.

Avis
Il n’y a pas encore d’avis.