
For which strategies?
StratSENTINEL #1 & #2 are universal and work on all strategies backtests of all assets.
Why we made these innovations?
👉 On the macro side of the equity curve
How many losses have you endured from strategies that worked perfectly but, for some reason, linked to the market structure itself, started continuously losing?
You want to stop that at the earliest.
For other mysterious reasons, it starts performing again.
You want to visualize exactly when and if it is statistically relevant.
👉 On the micro side of the equity curve (the current trade)
Sometimes you feel that this trade of your algo is either exceptionally good or bad right?
Should you let the trade go and let it come back to the average or worse?
Or get an overprofit (or cut this announced loss) to optimize the equity curve?
Now you can see how good/bad this trade is vs. the distribution of all the previous trades. Statistically.
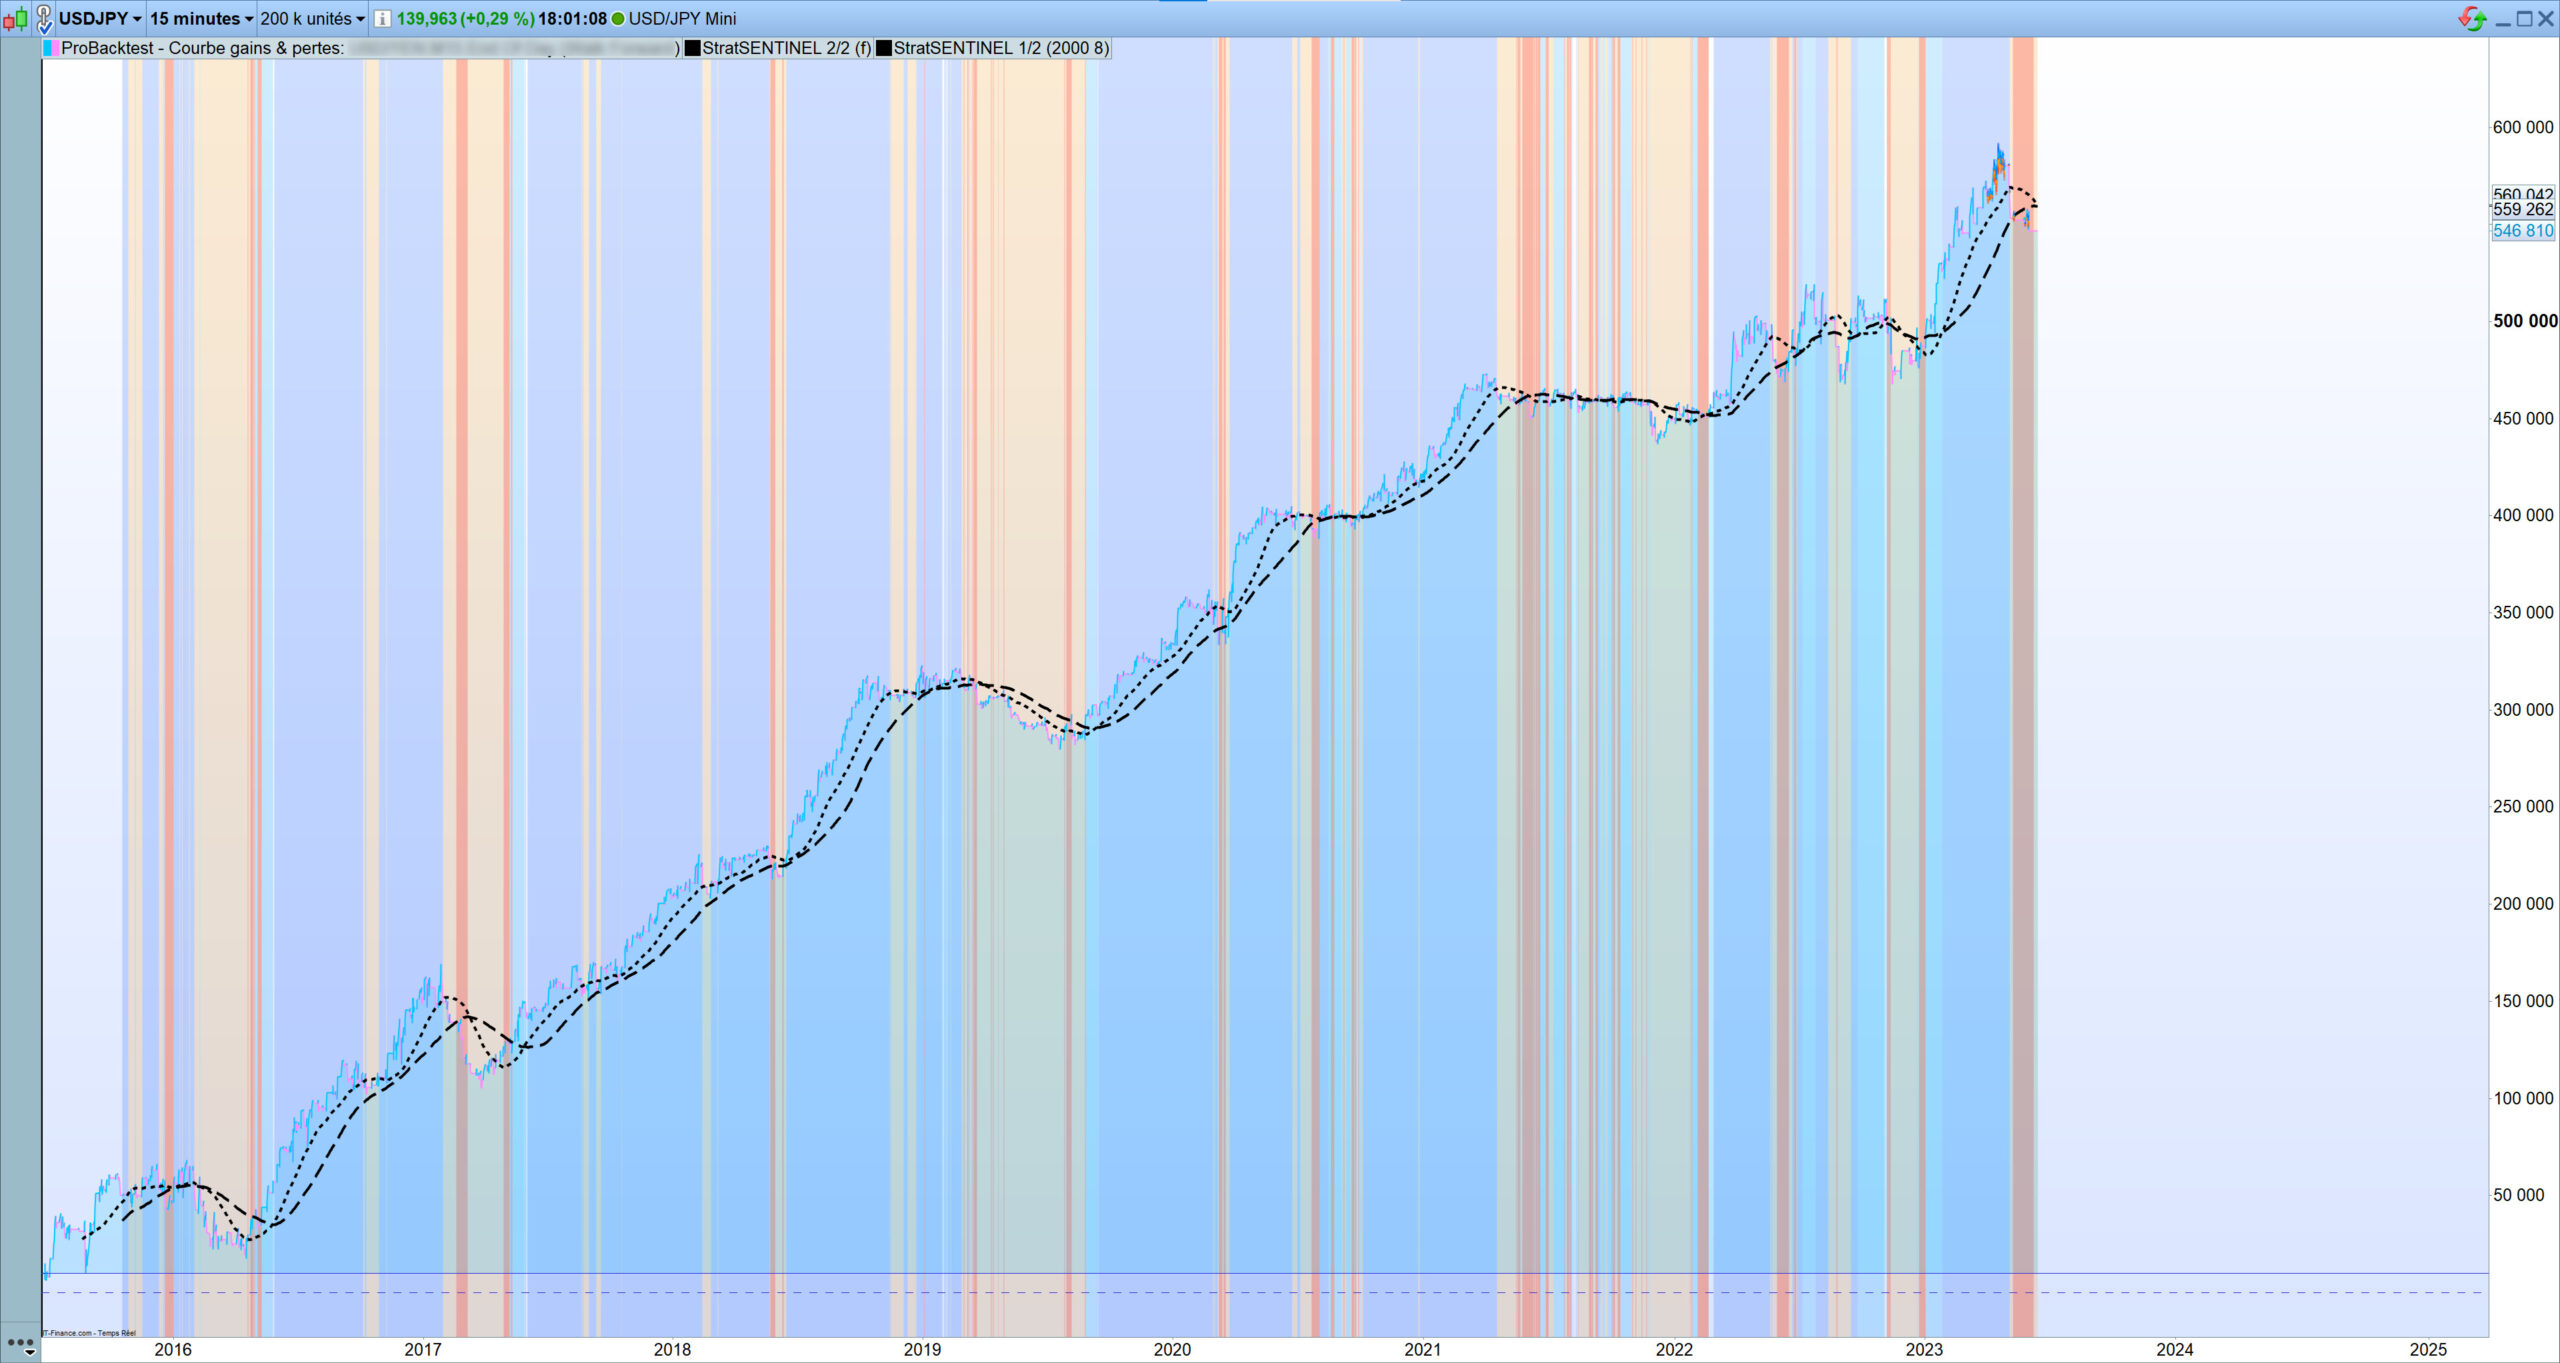
Our key innovation is to handle an equity curve like an asset.
How does it work?
StratSENTINEL #1
✔️ Applies a zero-lag indicator to statistically anticipate when the strategy does not respond well to market conditions
✔️ Gives an intuitive sense of the equity performance
Light blue: the strategy responds positively again to the market configuration with its entry conditions
👉 consider launching the first half (1/2) of your position at this point
Dark blue: the market configuration is favorable
👉 consider launching the second half (2/2) of your position
Light red: the strategy efficiency starts declining vs. the market configuration
👉 consider exiting the first half (1/2) of your position at this point
👉 do not launch the strategy at this stage
Dark red: the strategy fails vs the market configuration
👉 consider exiting second half (2/2) of your position
👉 do not launch the strategy at this stage
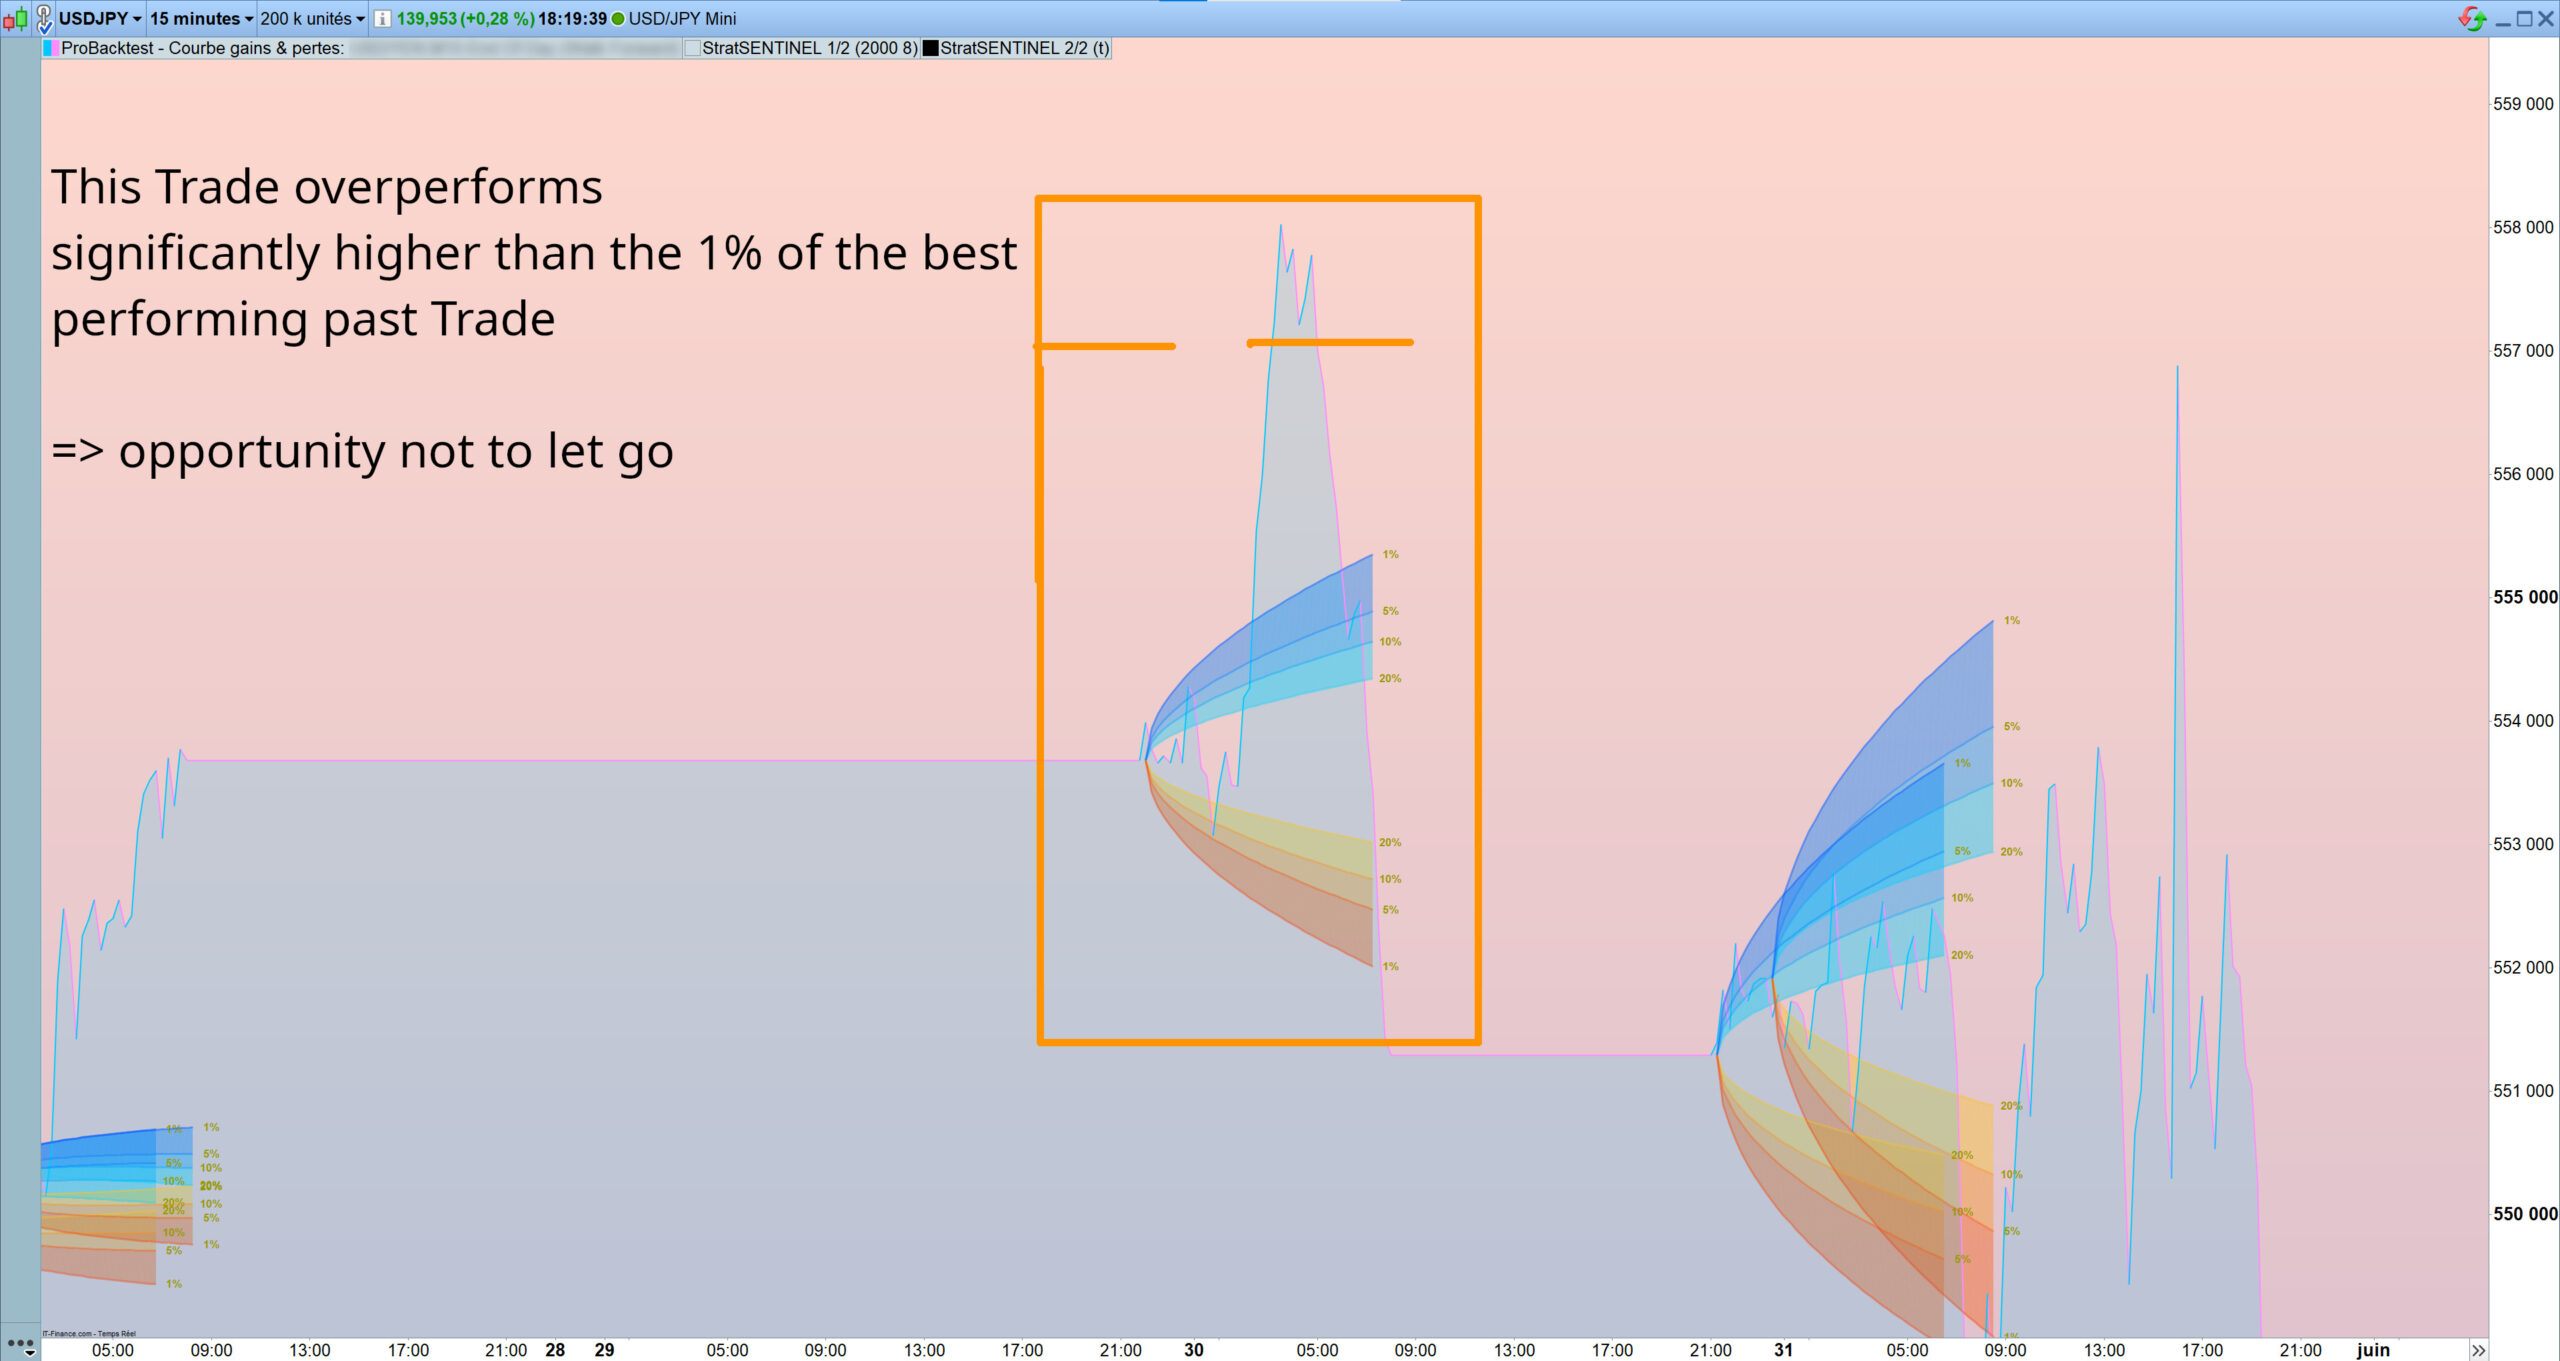
StratSENTINEL #2
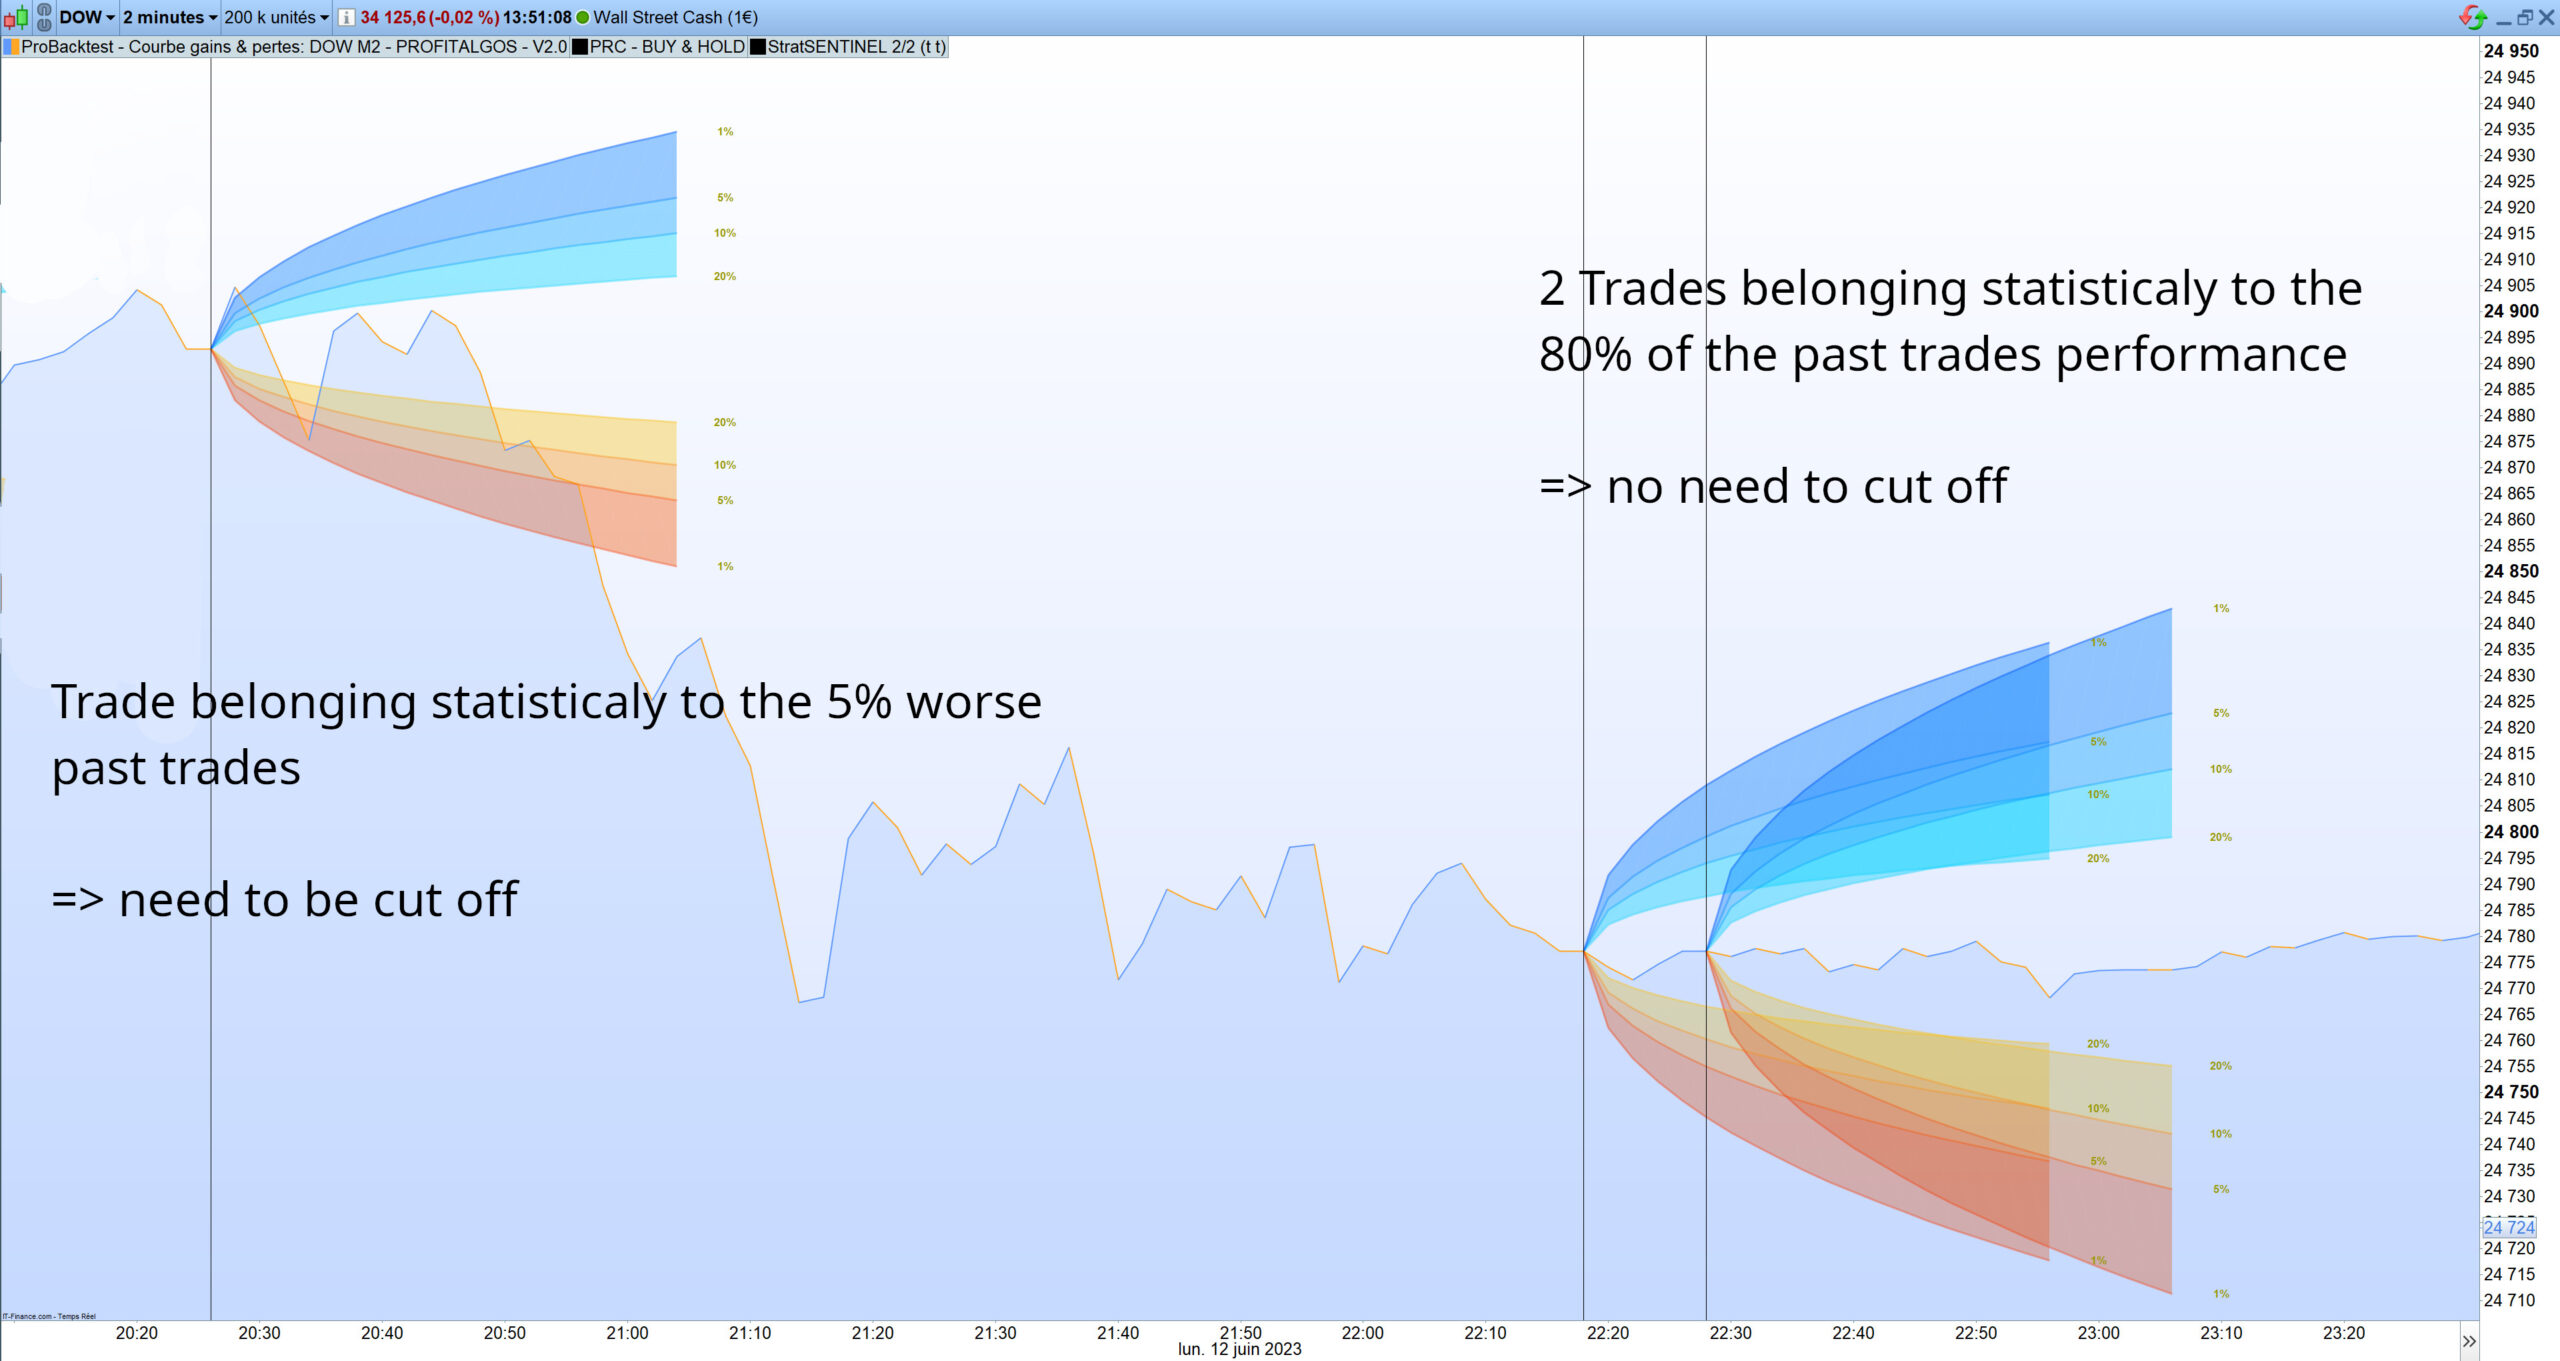
✔️ Creates a probability cone based on statistics, to compare the current trade to past ones
✔️ Tells you if this trade belongs to the 20%, 10%, 5% or the 1% of the best trades of the batch
✔️ You can now “evaluate” each trade to get an additional over profit vs. the equity backtest
—————————————————————————————————
Configuration
📍 Step 1: create your strategy and backtest it
👉 use a 200 000 units backtest
👉 tick by tick
📍 Step 2: apply the indicators directly in the Backtest chart
Here are the different options you can switch ON or OFF to make your StratSENTINEL totally yours:
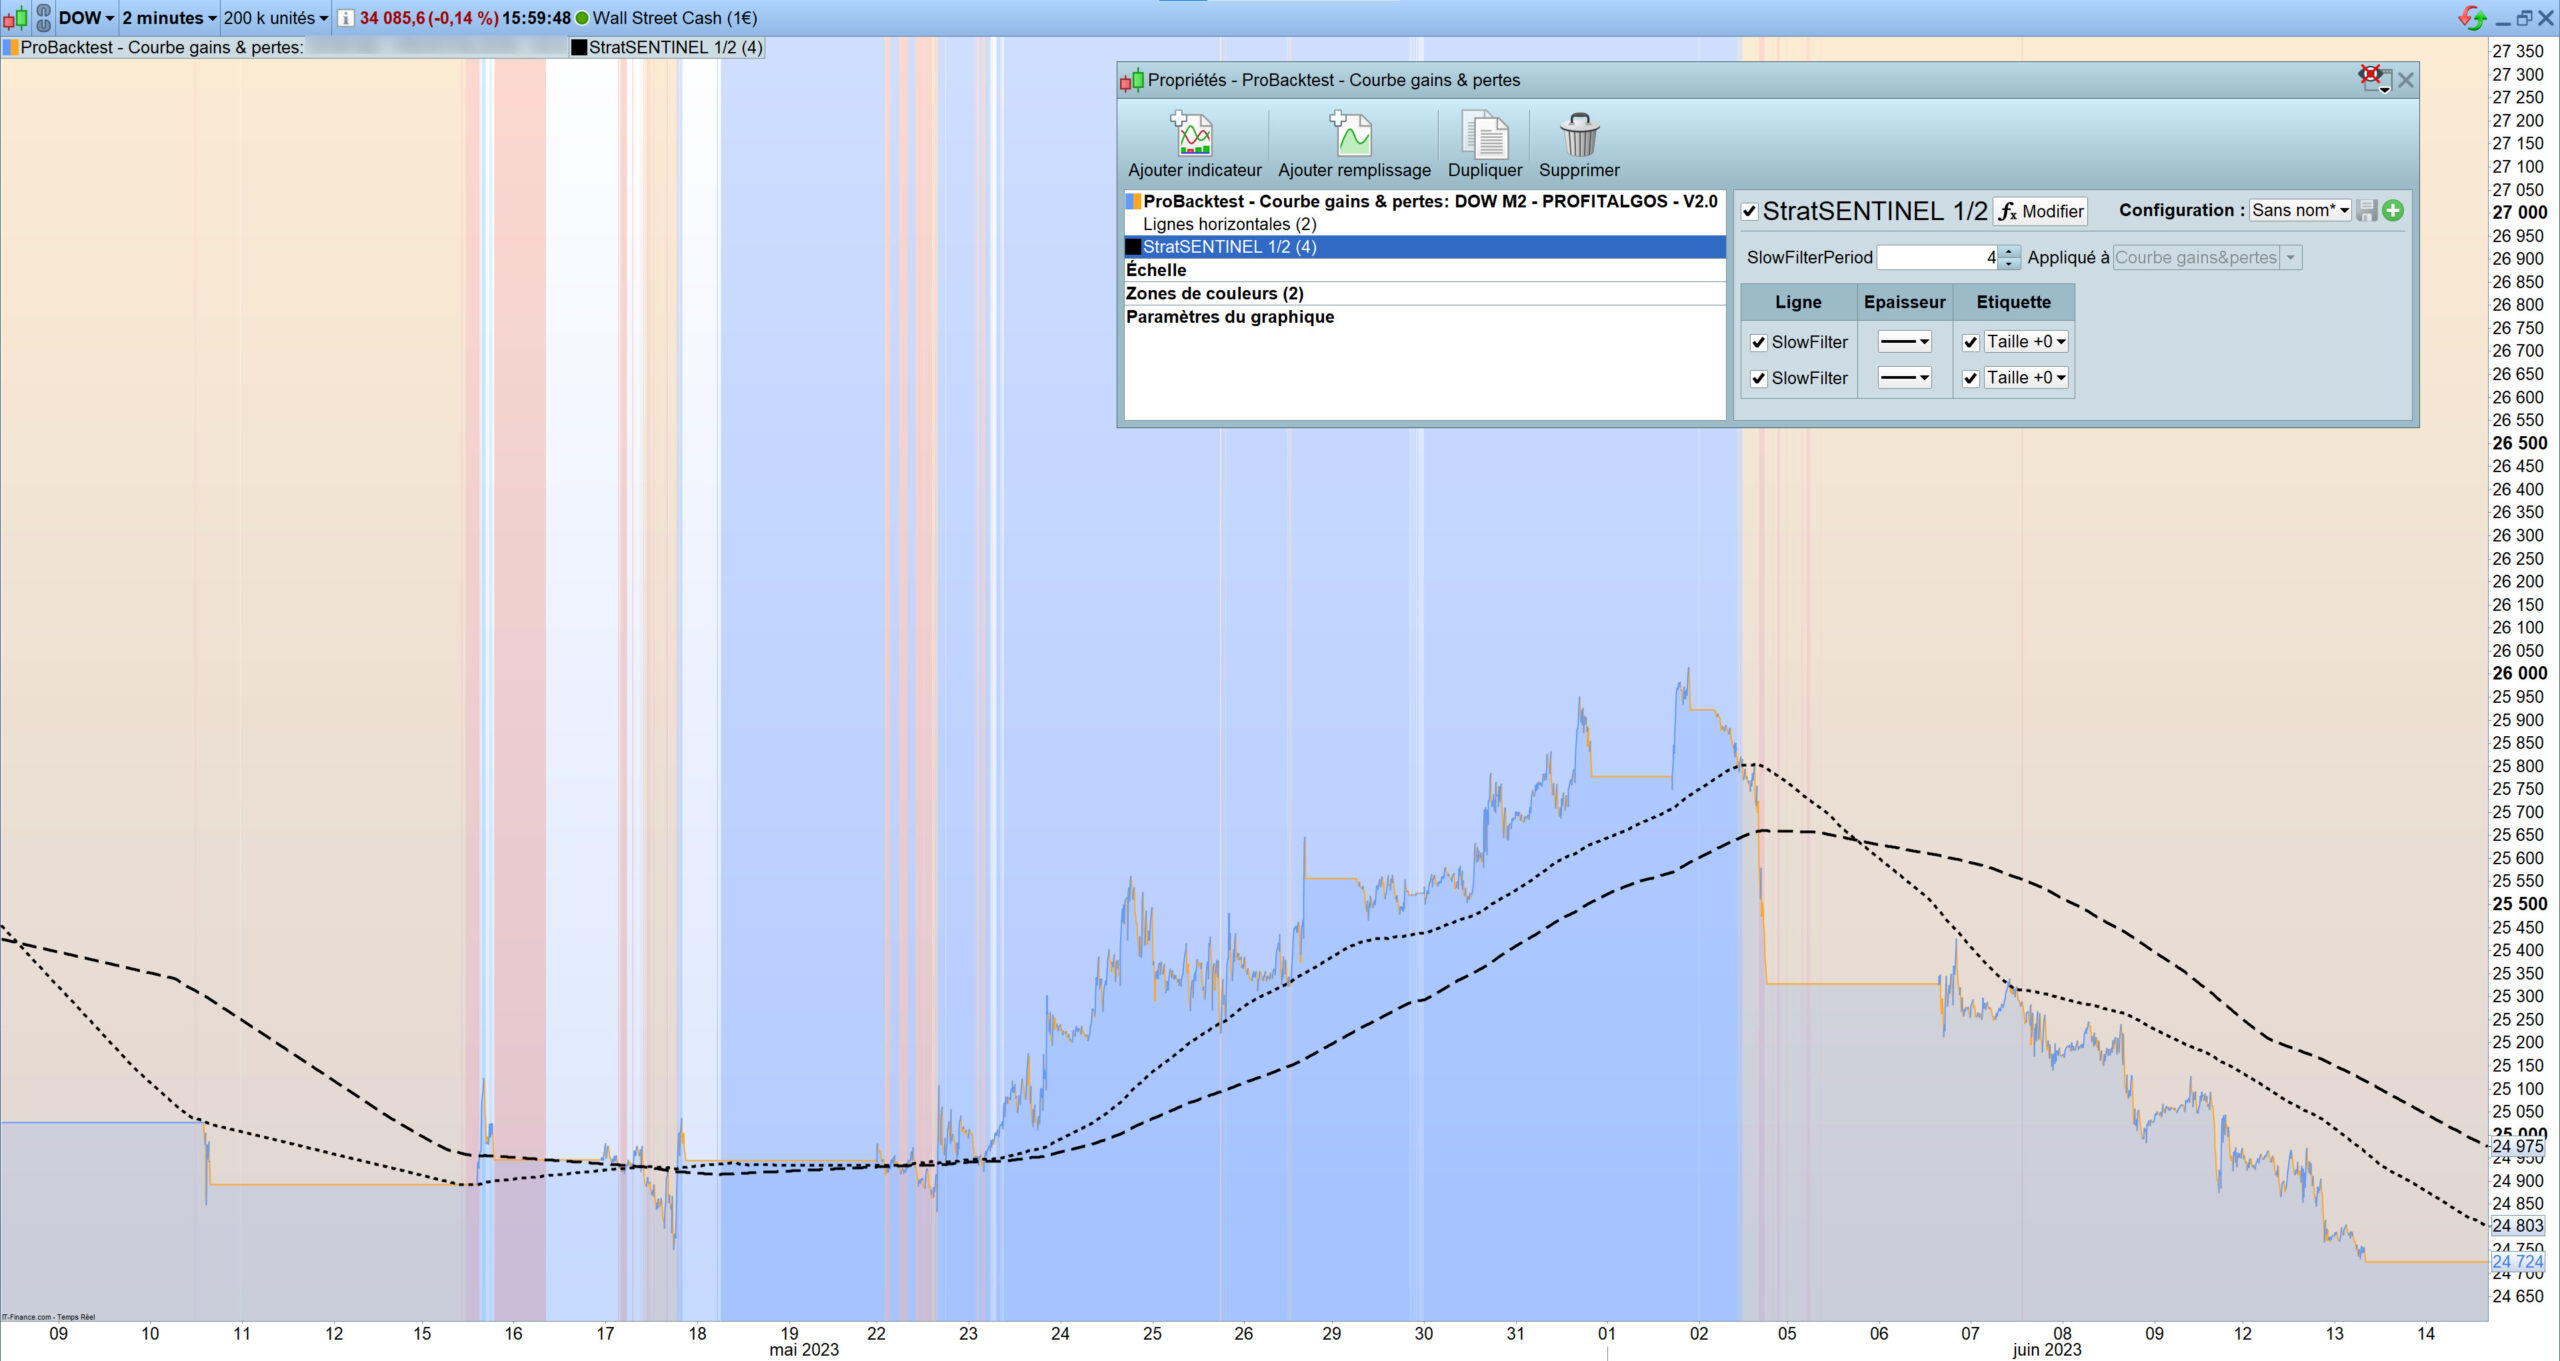
📍 SlowFilterPeriod:
👉 increase the number if the TimeFrame is low (M1, M2, M5, M10) to flatten the curve (> 4)
👉 decrease the number if the TimeFrame is high (H1, H2, H4) to curve the filter (< 4)
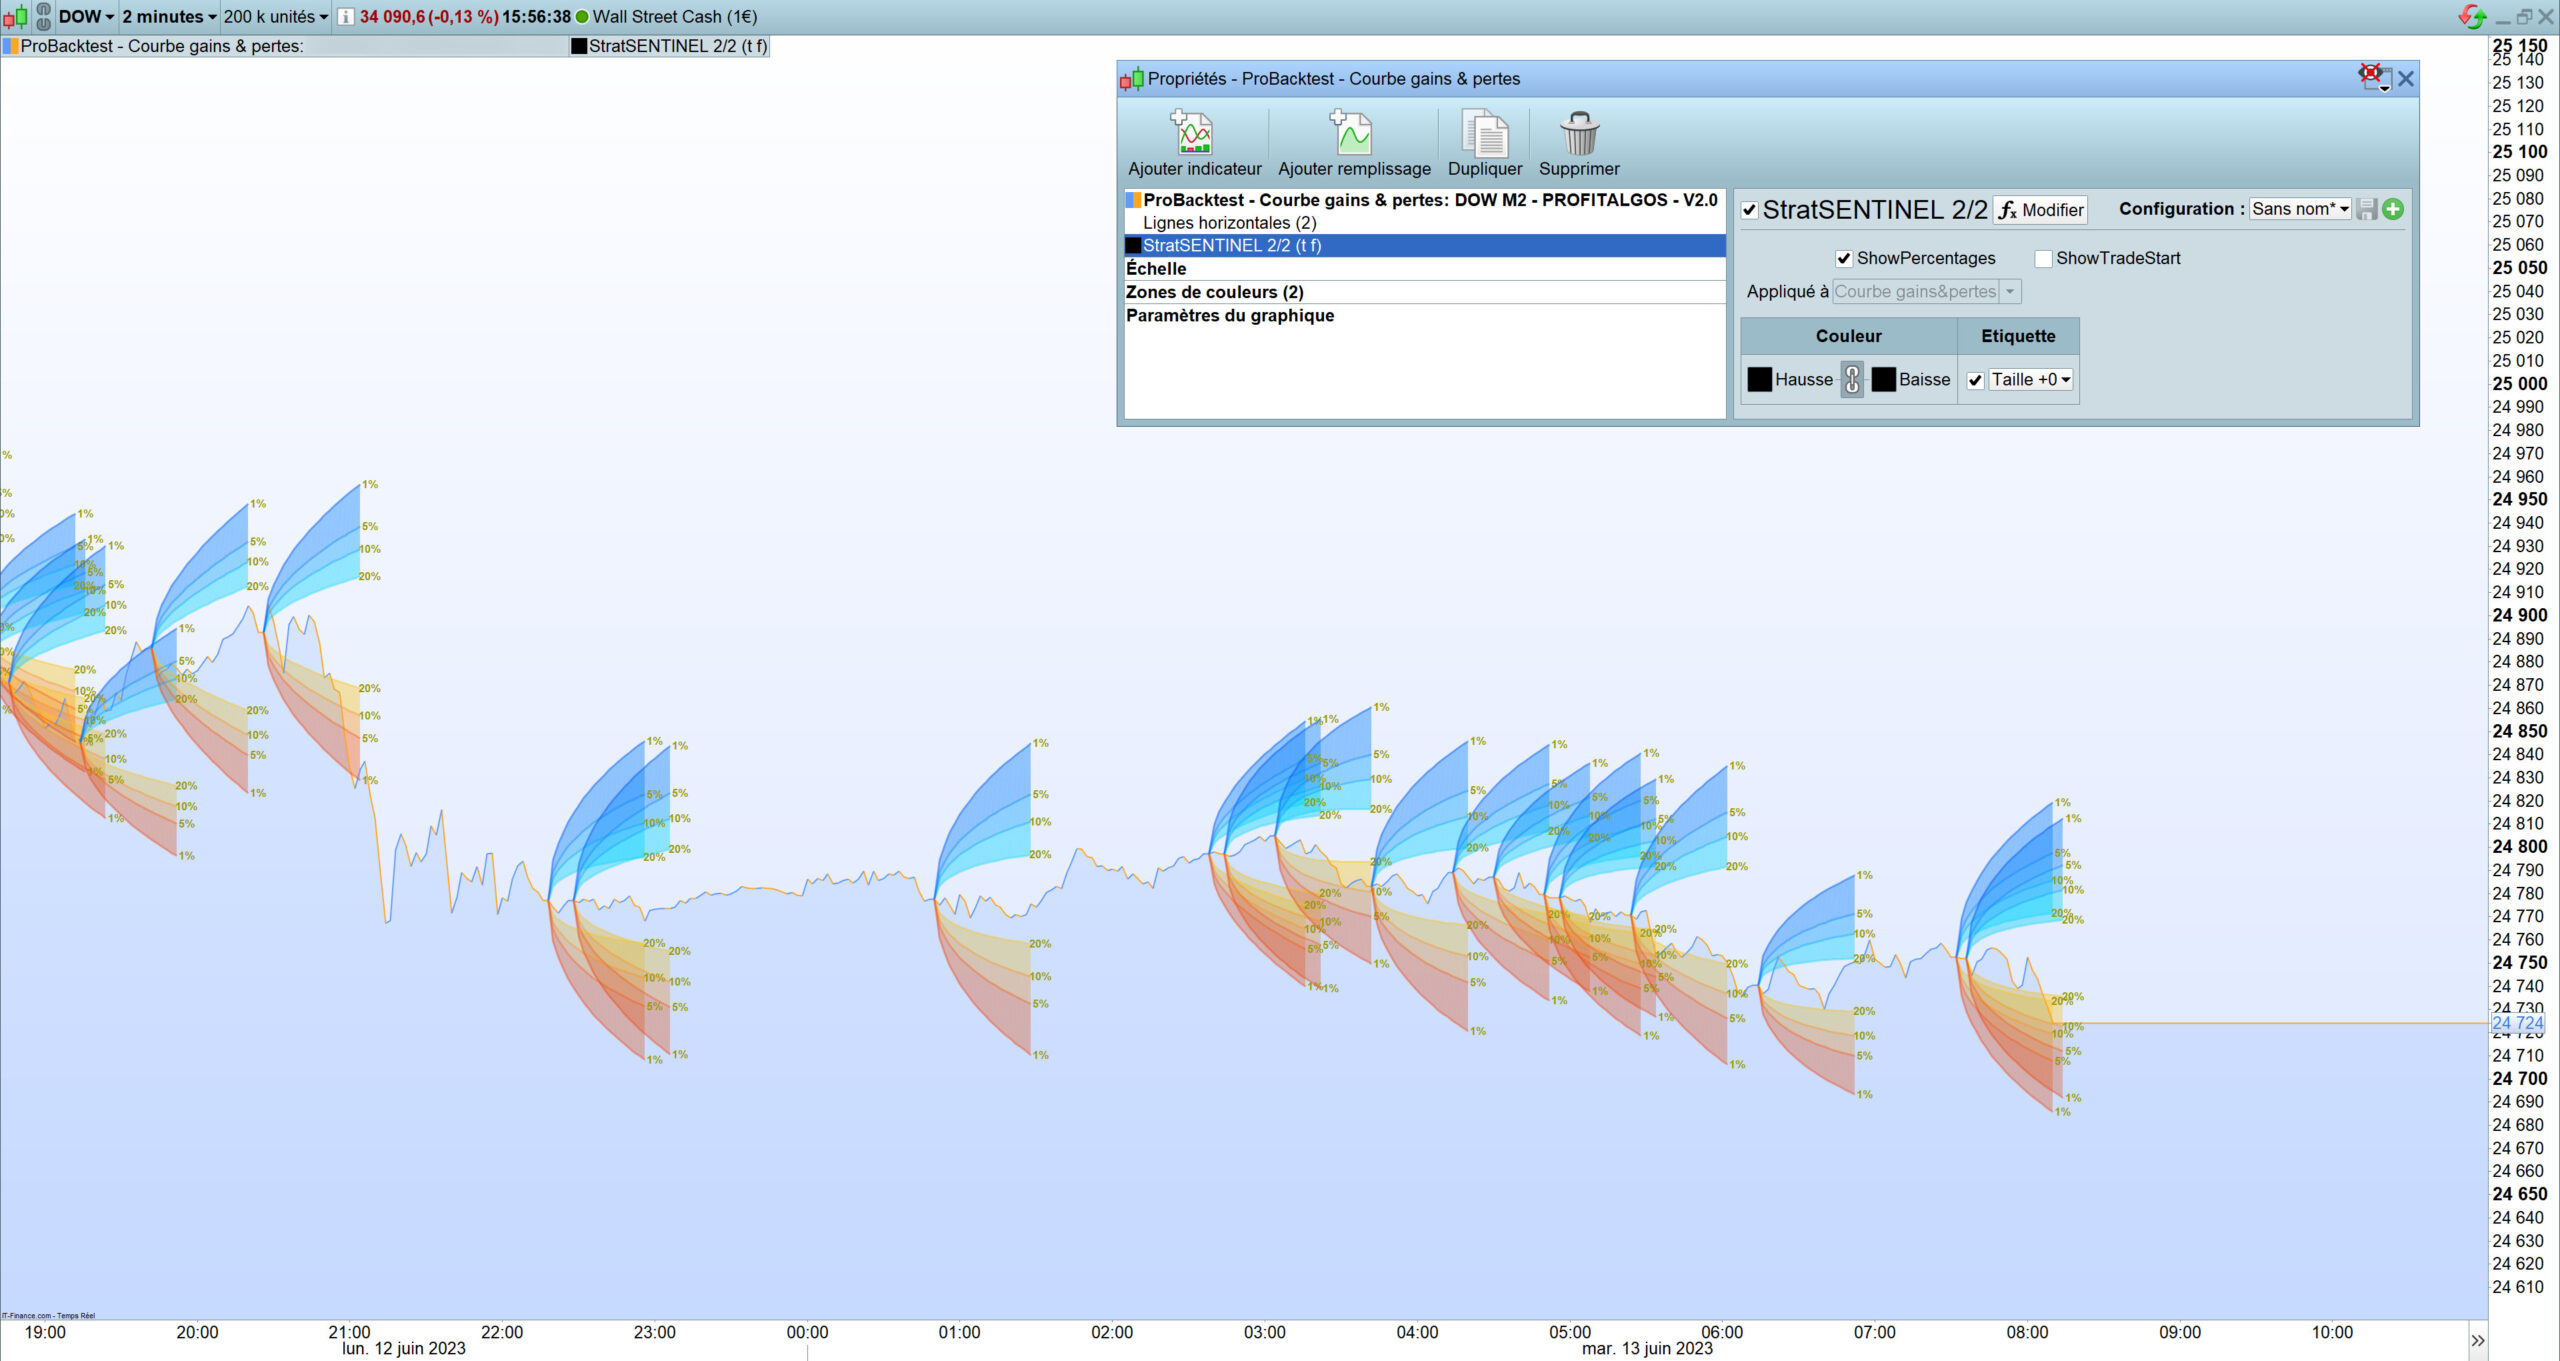
📍 ShowPercentage:
👉 For ex: 5% (in the blue spectrum) gives you level of performance reach by only 5% of the positive trades
👉 Under this line, 85% of the past trades are under this level
👉 Consider the 5% line as highly significant statistically = it is a very rare event among the sample
📍 ShowTradeStart:
👉 Indicates even more clearly the start of the trade

Reviews
There are no reviews yet.