

Stop the guess work! You don’t have to be a statistic like ~90% of retail traders out there. Start to think like the smart money and know when to get involved.
Large market players make a joke out of most retail traders by creating large order blocks and then taking price back to these zones just as the majority of retail traders start thinking the market is going into a new direction. Taking out your stops to create more liquidity for themselves and forcing the market back into the original direction. If this sounds familiar then stop what you have been doing and start playing the game the way they do.
Using this indicator you will be able to identify major Supply and Demand Zones as well as past and future areas of market imbalance typically referred to as fair value gaps. These gap zones typically end up getting filled due to the fact that as the market accelerate out of areas of accumulation and distribution with lot’s of liquidity in play not all market participants get’s equal chances to participate. This creates ‘imbalances’ or ‘fair value gaps’ in the market and price will eventually head back to these areas to give all markets participants a chance to explore fair-price. To understand more about this concept go read up or watch a few videos on ‘Fair Value Gaps’ and ‘Imbalance created by institutional trading’
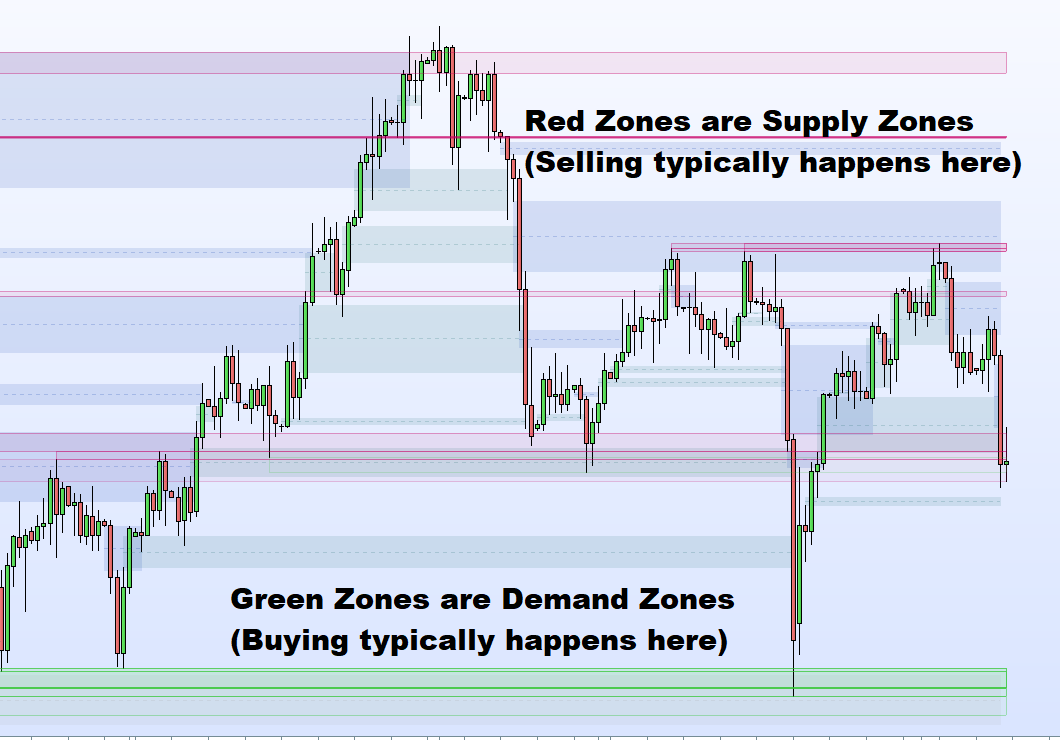
Indicator Interpretation:
The red and green zones are areas of liquidity (stops, orders etc.) and smart money will push price back through these areas to grab the liquidity before making a new move.
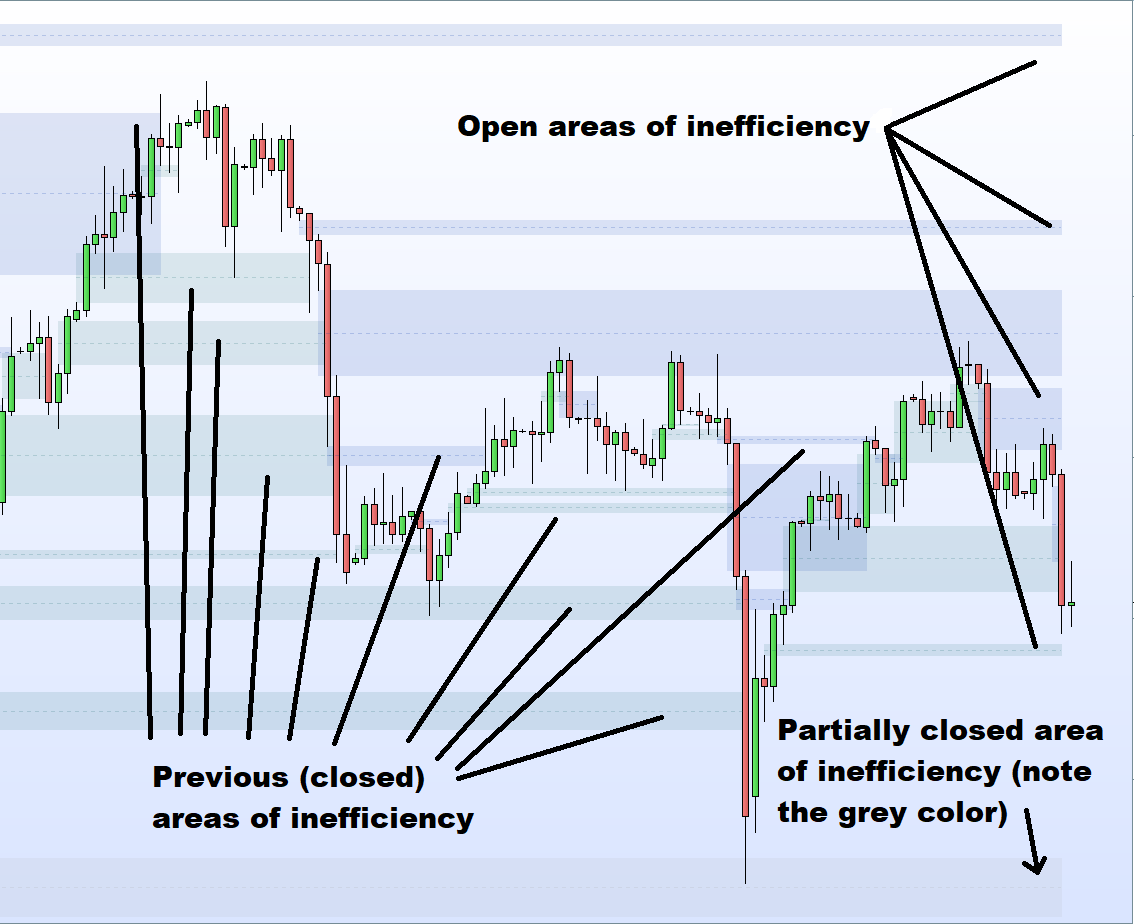
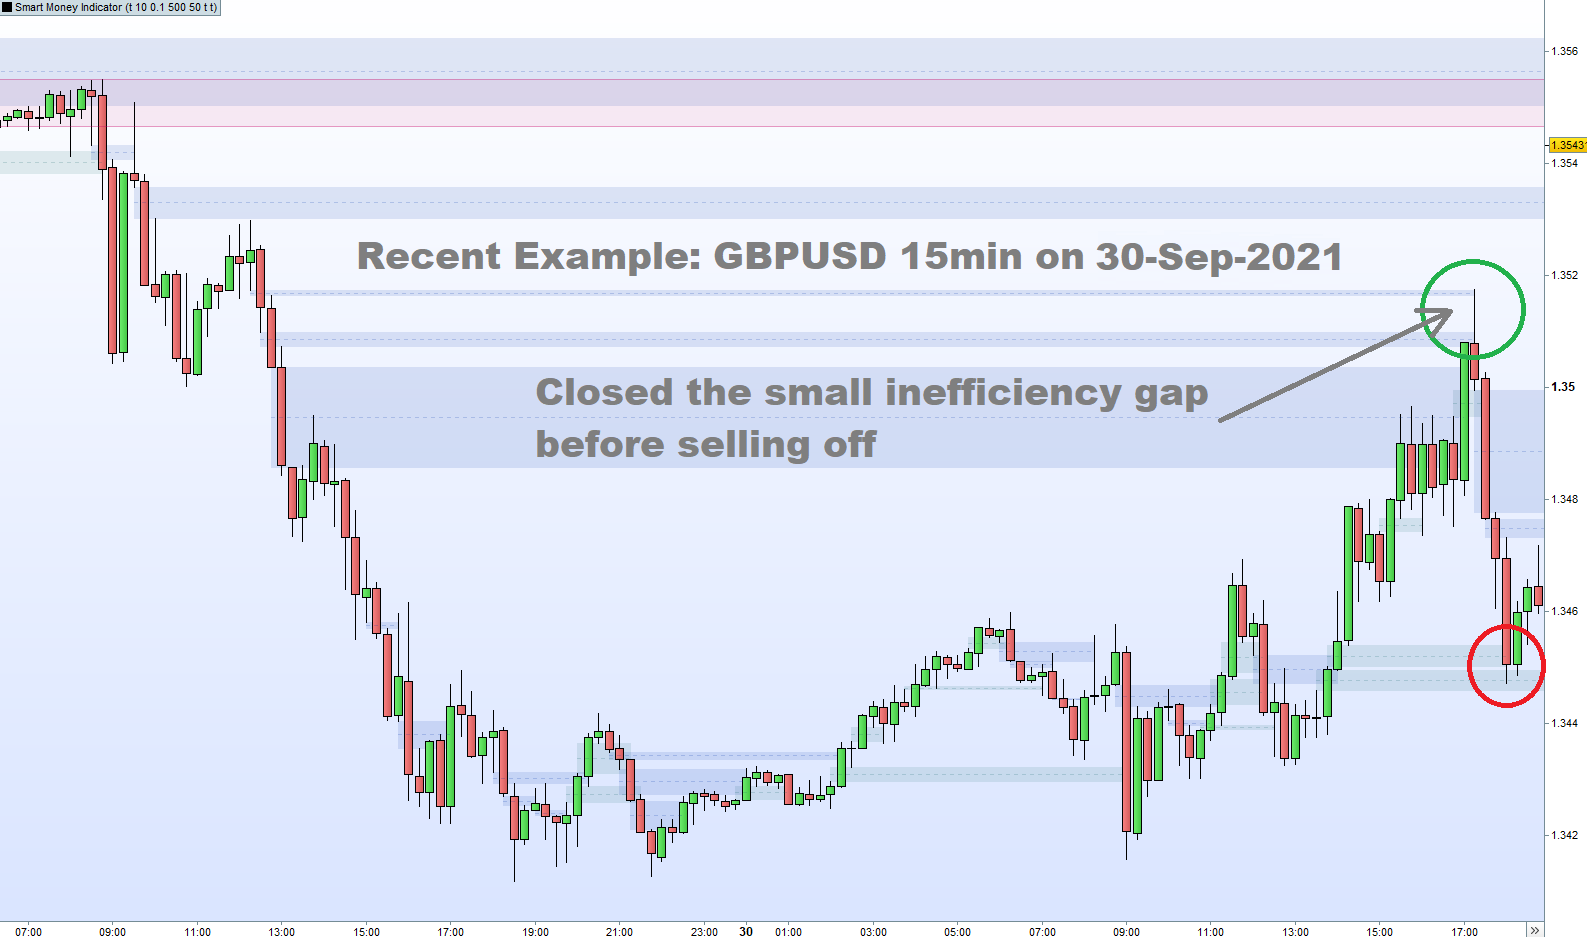
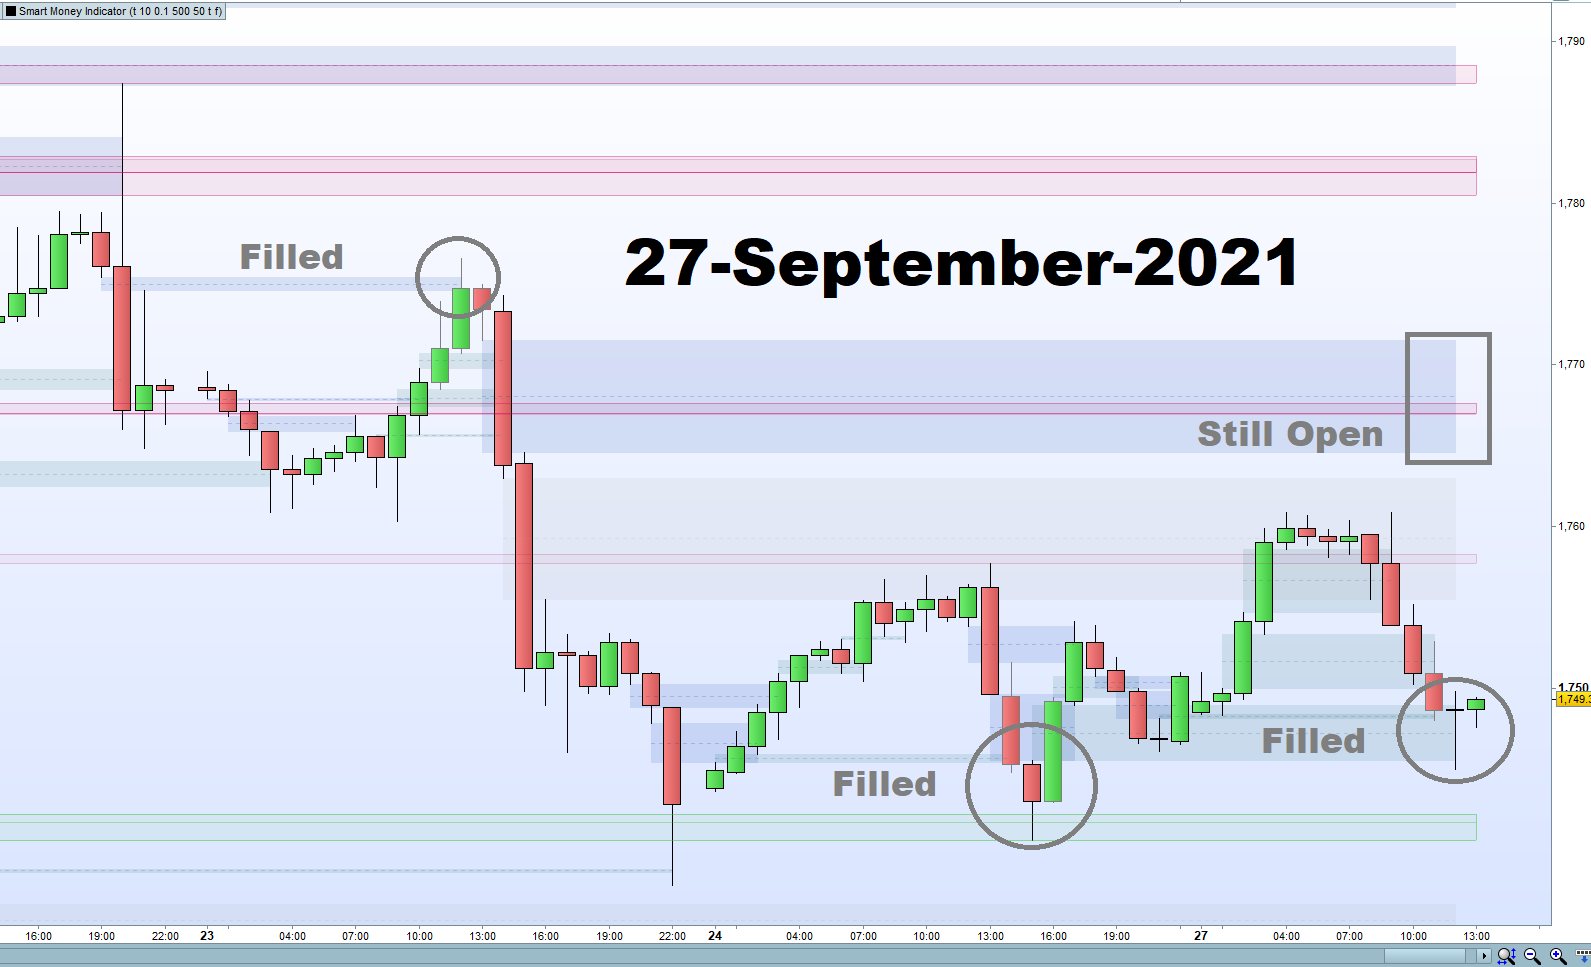
The areas of inefficiency is where unequal buying or selling occurred and will very often be filled at some point in the future.
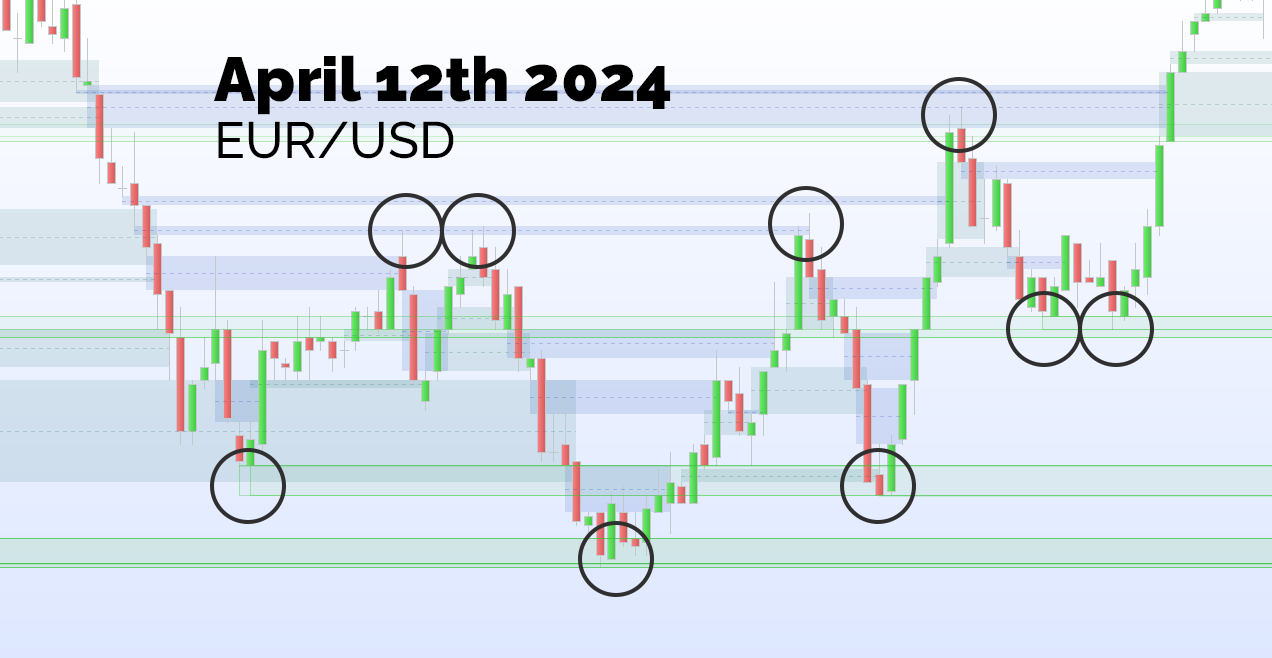
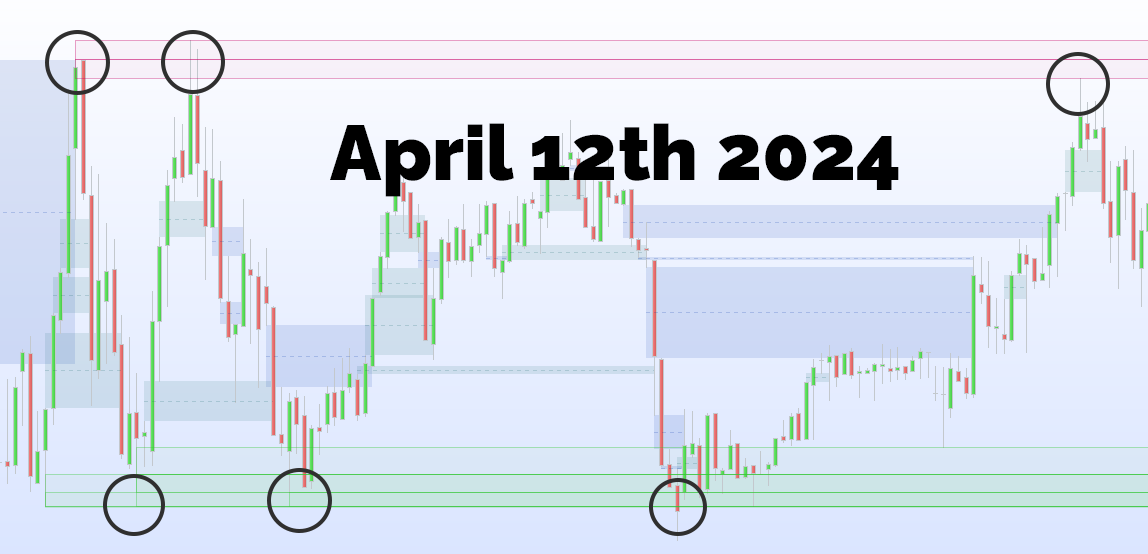
Recent Example from EURUSD 1M Chart:
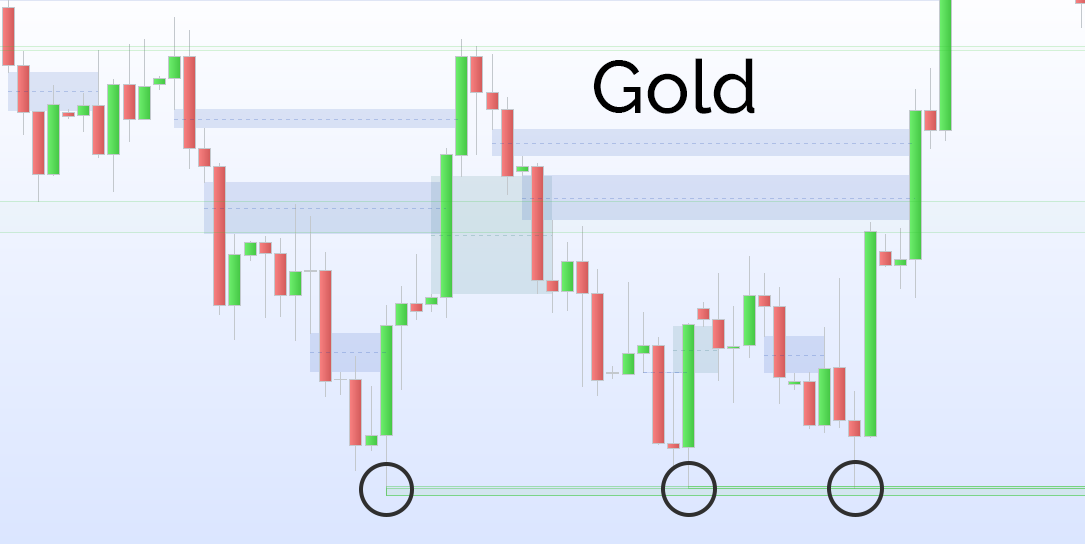
Recent Example from GOLD 30second Chart:
Daily Gold chart:
Recent Example from GBPUSD 15m Chart:
Recent Example from Gold 1H Chart:
Indicator Configuration:
Apply to the chart directly (Add the indicator under price).

- Enable or Disable Supply and Demand zones (Enabled by default)
- SnDSensitivity – Supply and Demand zone Sensitivity (Higher equals less sensitive – Default: 5)
- SnDZoneSize – Adjusts the Supply and Demand zone area to highlight (Higher is larger – Default: 0.5)
- SnDLookback – How far to look back when determining supply and demand (Default: 500)
- PartialImbalancePercent – What percentage is determined as a partial imbalance close (Default: 50)
- DrawPartialLine – Enabled or Disables drawing a dotted line at the partial imbalance level within the Imbalance Zone (Default: Enabled)
- WeekendAnalysisMode – Disable in order for the indicator to load quicker but must be enabled on Weekends (Or after-hours for shares) to show currently open Imbalance Zones to be visible.
Important Troubleshooting Notes:
- If the indicator fails to load reduce the price history to below 1000 units and re-load indicator.
- If the Supply and Demand Zones appear to overshadow the chart reduce the SnDZoneSize
- If there appears to be too many zones in general increase SnDSensitivity
This indicator works really well with my RSI PoweSignal v3 to help you really fine tune those entries and exits.
All indicators includes free access to my Ultimate and Complete Course on High-Probability Trading (follow link for course content). You will find the link to the course content in the purchase note upon completion of payment.
About me:
I am a professional ProRealTime developer with 4+ years experience in creating and coding ProRealTime strategies.
You can view my PRC profile here: https://www.prorealcode.com/user/juanj/

berlin77 (proprietario verificato) –
Very helpful, a must-have indicator. It gives precise easy to read zones compared to other products on the market. Perfect ! Five Stars! The free trading course included with the product is a gem for beginners, don’t overlook it.
marino bernacchi (proprietario verificato) –
Trovo l’indicatore utile, messo all’interno di una strategia già consolidata disegna in maniera ottima i livelli e le aree che possono essere di interesse. I vari campi di configurazione sono molto utili per personalizzare l’indicatore. Juan è persona fantastica e disponibilissima. Ho condiviso con lui alcune necessità e le ha integrate subito. Ottimo
bpater79 (proprietario verificato) –
Semplicemente fantastico.
Susana (proprietario verificato) –
Indicatore molto preciso. Fornisce zone precise di domanda e offerta e si può vedere subito dove si trovano gli scarti del valore equo. Ho contattato lo sviluppatore che mi ha fornito ulteriori informazioni in merito. Molto utile. Grazie
Chloe.D (proprietario verificato) –
Trovo questo indicatore molto utile e funziona piuttosto bene nel trading sugli indici. Questo indicatore fornisce una direzione piuttosto precisa su dove si muoverà il prezzo. Ho recuperato subito i miei soldi! Ho inviato alcune richieste allo sviluppatore e sono entrato in contatto con lui. È stato molto disponibile e generoso nel condividere con me il suo setup di trading intraday. Consiglio vivamente questo sviluppatore e l’indicatore smart money ad altri.