

 QUICK &
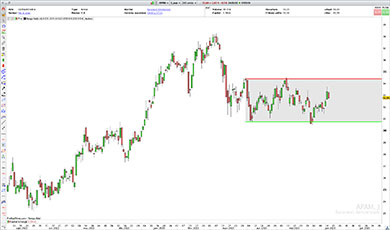



Range Indicator for ProRealTime
The Range Indicator automatically detects potential Trading Range formations and displays them directly on your ProRealTime charts, based on customizable detection criteria.
The Indicator analyzes the last 150 candles to identify ranges where prices move between an upper resistance boundary and a lower support boundary.
When a Range is detected, its upper and lower boundaries and the corresponding price zone can be displayed directly on the chart.
You can customize the detection criteria, activate specific filters and adjust the display options to suit your trading preferences.

Customizable Settings
Adjust the Indicator directly from ProRealTime’s Configuration menu, without modifying the code.
Adjustable validation criteria:
- Minimum Range height
- Minimum Range length
- Maximum allowed price excursions outside the Range
Available filters:
- Current price within the Range
- Current price breaking above the Range’s upper boundary
- Current price breaking below the Range’s lower boundary
- At least 2 alternating contacts with the upper boundary and 2 with the lower boundary
Display options:
- Upper resistance and lower support lines
- Rectangle highlighting the Range area
- Customizable support and resistance line colors
- Adjustable rectangle color and transparency
- Optional bullish and bearish theoretical price targets
These settings allow you to adapt both Range detection and chart visualization to your own criteria.
Characteristics
- Automatic detection and display of Trading Ranges
- Analysis of the last 150 candles
- Customizable detection criteria and filters
- Adjustable Range boundaries, rectangle and theoretical price targets
- Works on all timeframes (4 hours and higher recommended)
- Compatible with ProRealTime V11 and later
- Compatible with the free version of ProRealTime (daily closing prices)
- Settings adjustable without modifying the code
- Free automatic updates
Video Presentation
Video in French – English subtitles available.
Looking for Trading Ranges Across the Markets?
Discover our Range Screener to automatically scan financial markets for instruments trading within a Range or breaking above or below its boundaries.
The Range Indicator is included with the Range Screener.
Reviews
There are no reviews yet.