Original price was: 120€.Current price is: 79€.
Compatible desde

Favoritos:6   Vistas:1737   Reseñas:0  

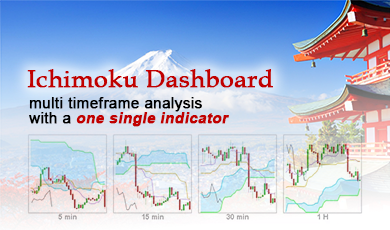
Ichimoku is a technical analysis tool for stock market charts that allows you to define support and resistance levels, the trend (bearish, bullish) or the non-trend (trading range) on several timeframes simultaneously.

Ichimoku adapts to each trading profile (scalping, intraday, swing trading). It allows you to analyze the price action on charts representing all types of assets (Forex, stocks, futures, crypto-currencies)

Ichimoku kinko hyo is a complete analysis system that is self sufficient.

What is Ichimoku multi timeframe Dashboard and how can it help you?

  • Dashboard of current ichimoku configuration and on any timeframe available
  • You can keep track of the Ichimoku configuration on the higher timeframes
  • The ichimoku indicators visible on all timeframes thanks to the minicharts ©
  • Buy and sell signals for bullish and bearish trends.
  • Scalping, intraday, swing trading – short or long term traders can take advantage of this approach
  • This dashboard is the most comprehensive indicator available for ProRealTime, to use Ichimoku signals
  • Compatible with all tools and all times available in ProRealTime
  • It works in real time!

*** LICENSE INCLUDES: LIFETIME USE AND ALL UPDATES ***

Category: Etiquetas: , ,
Report Abuse

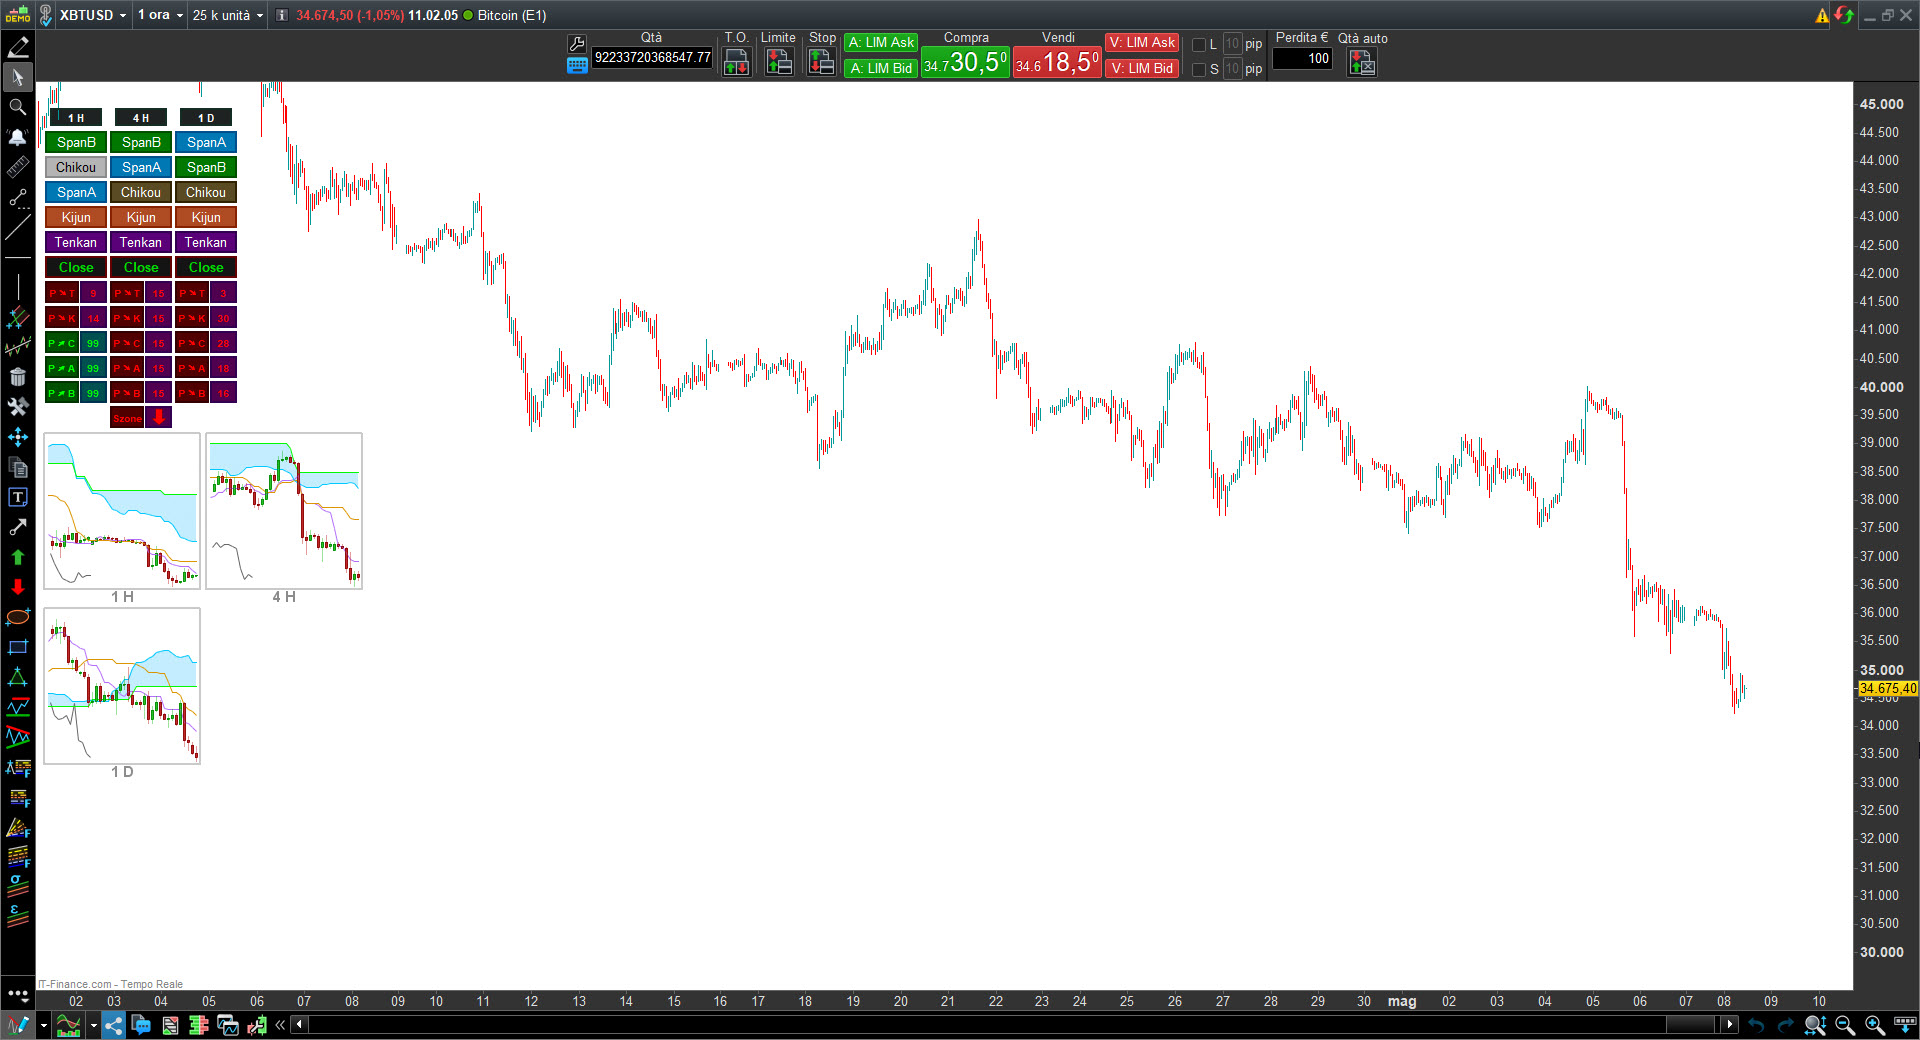
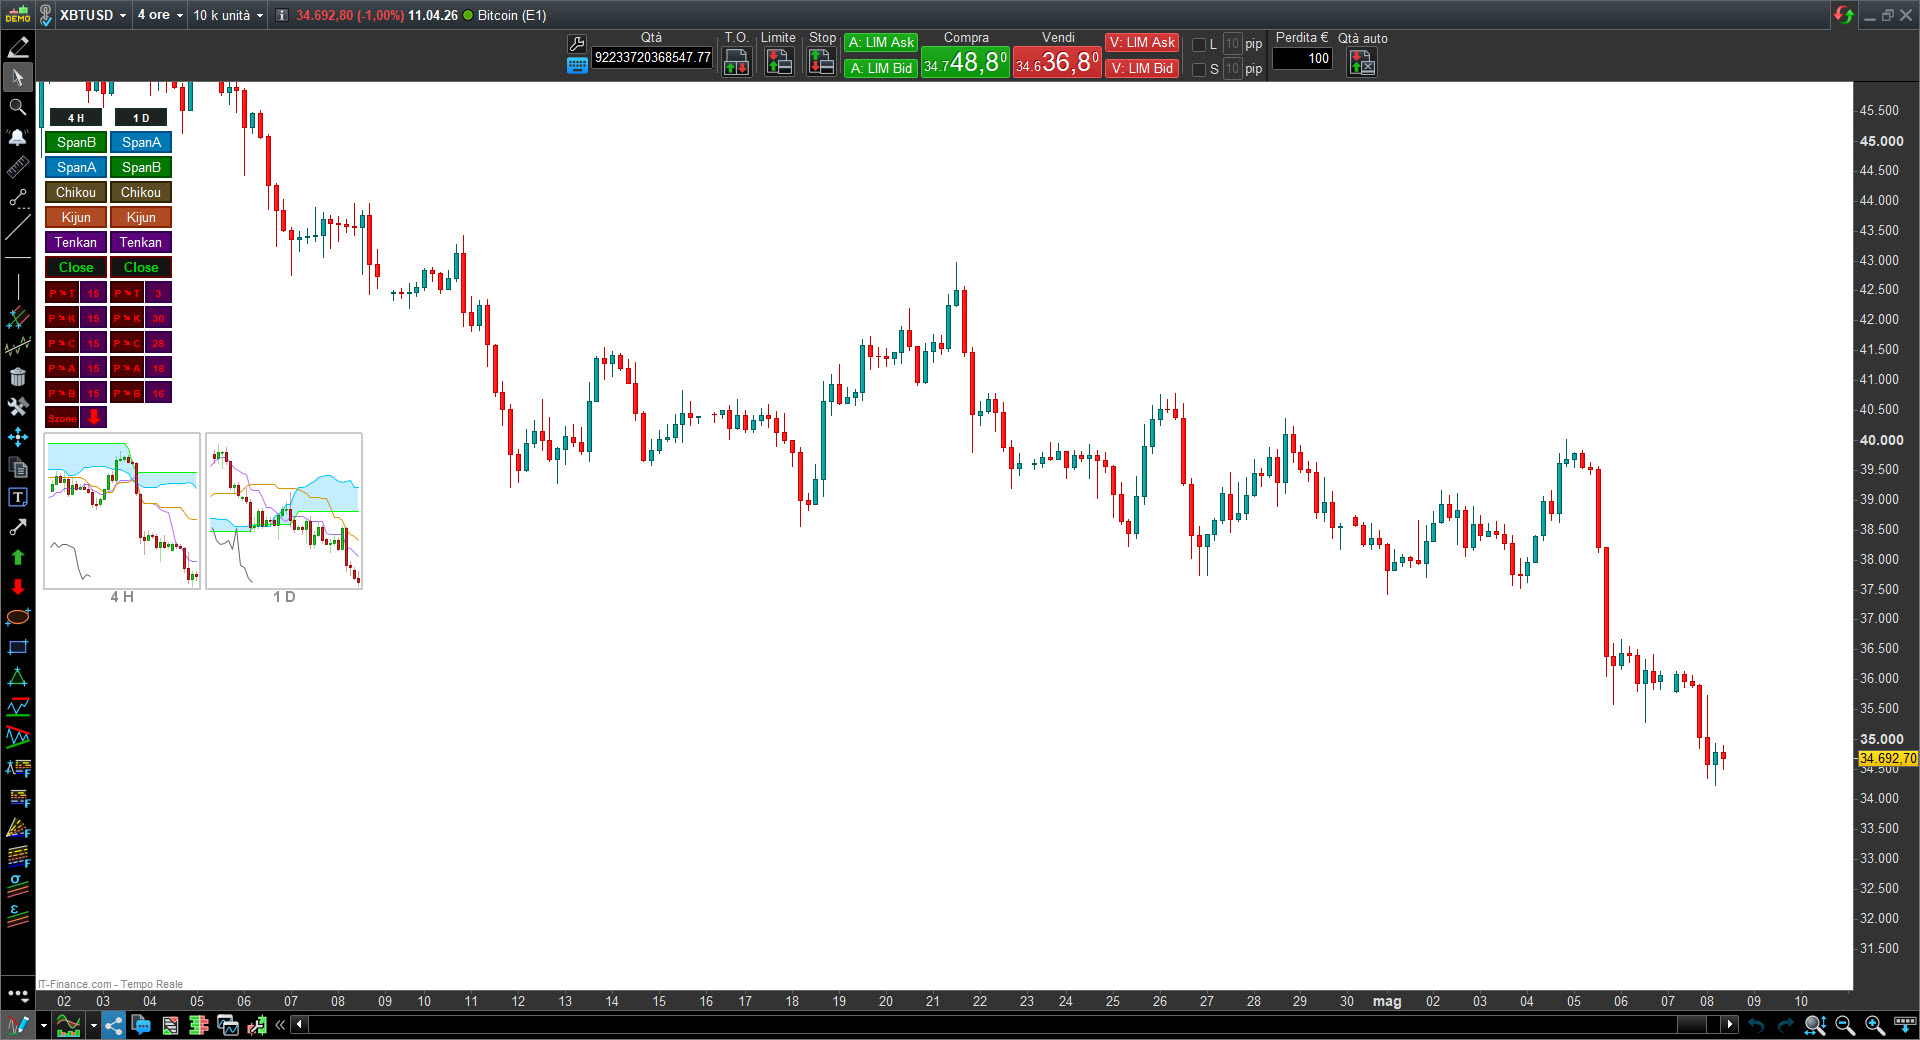
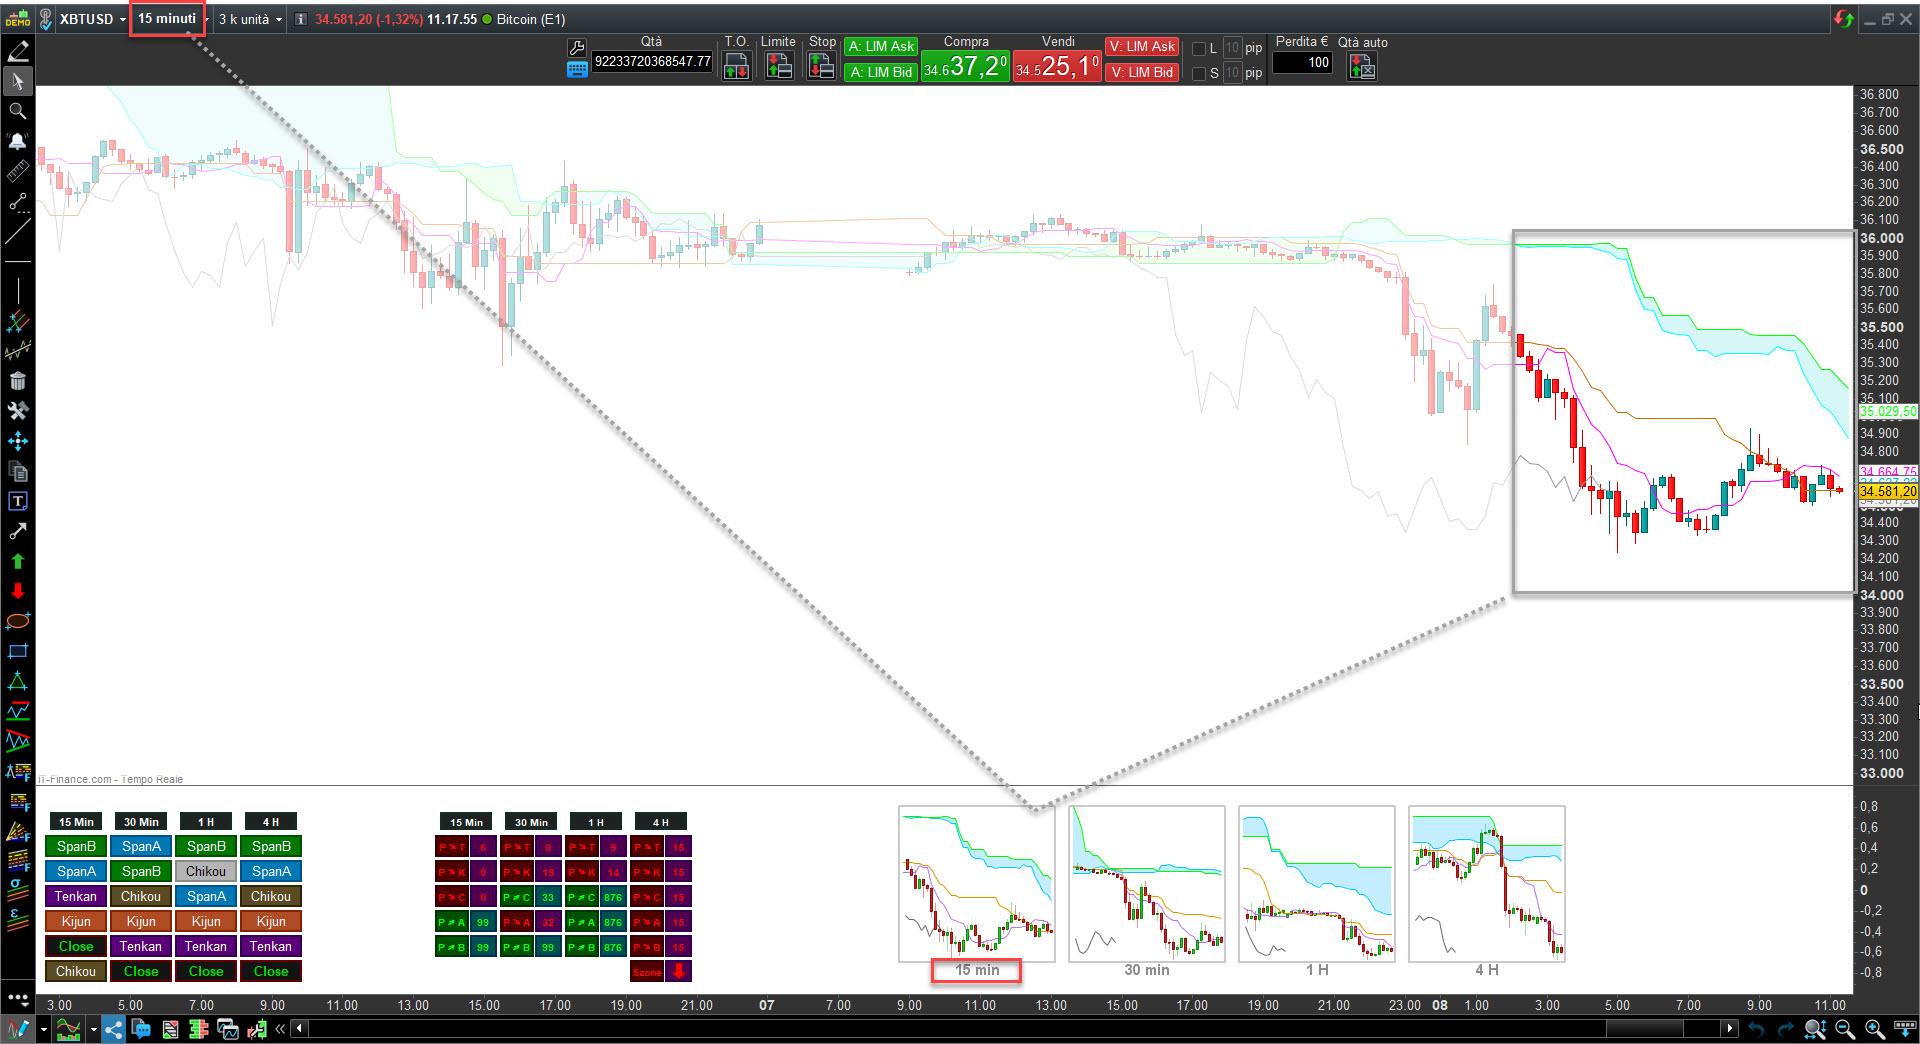
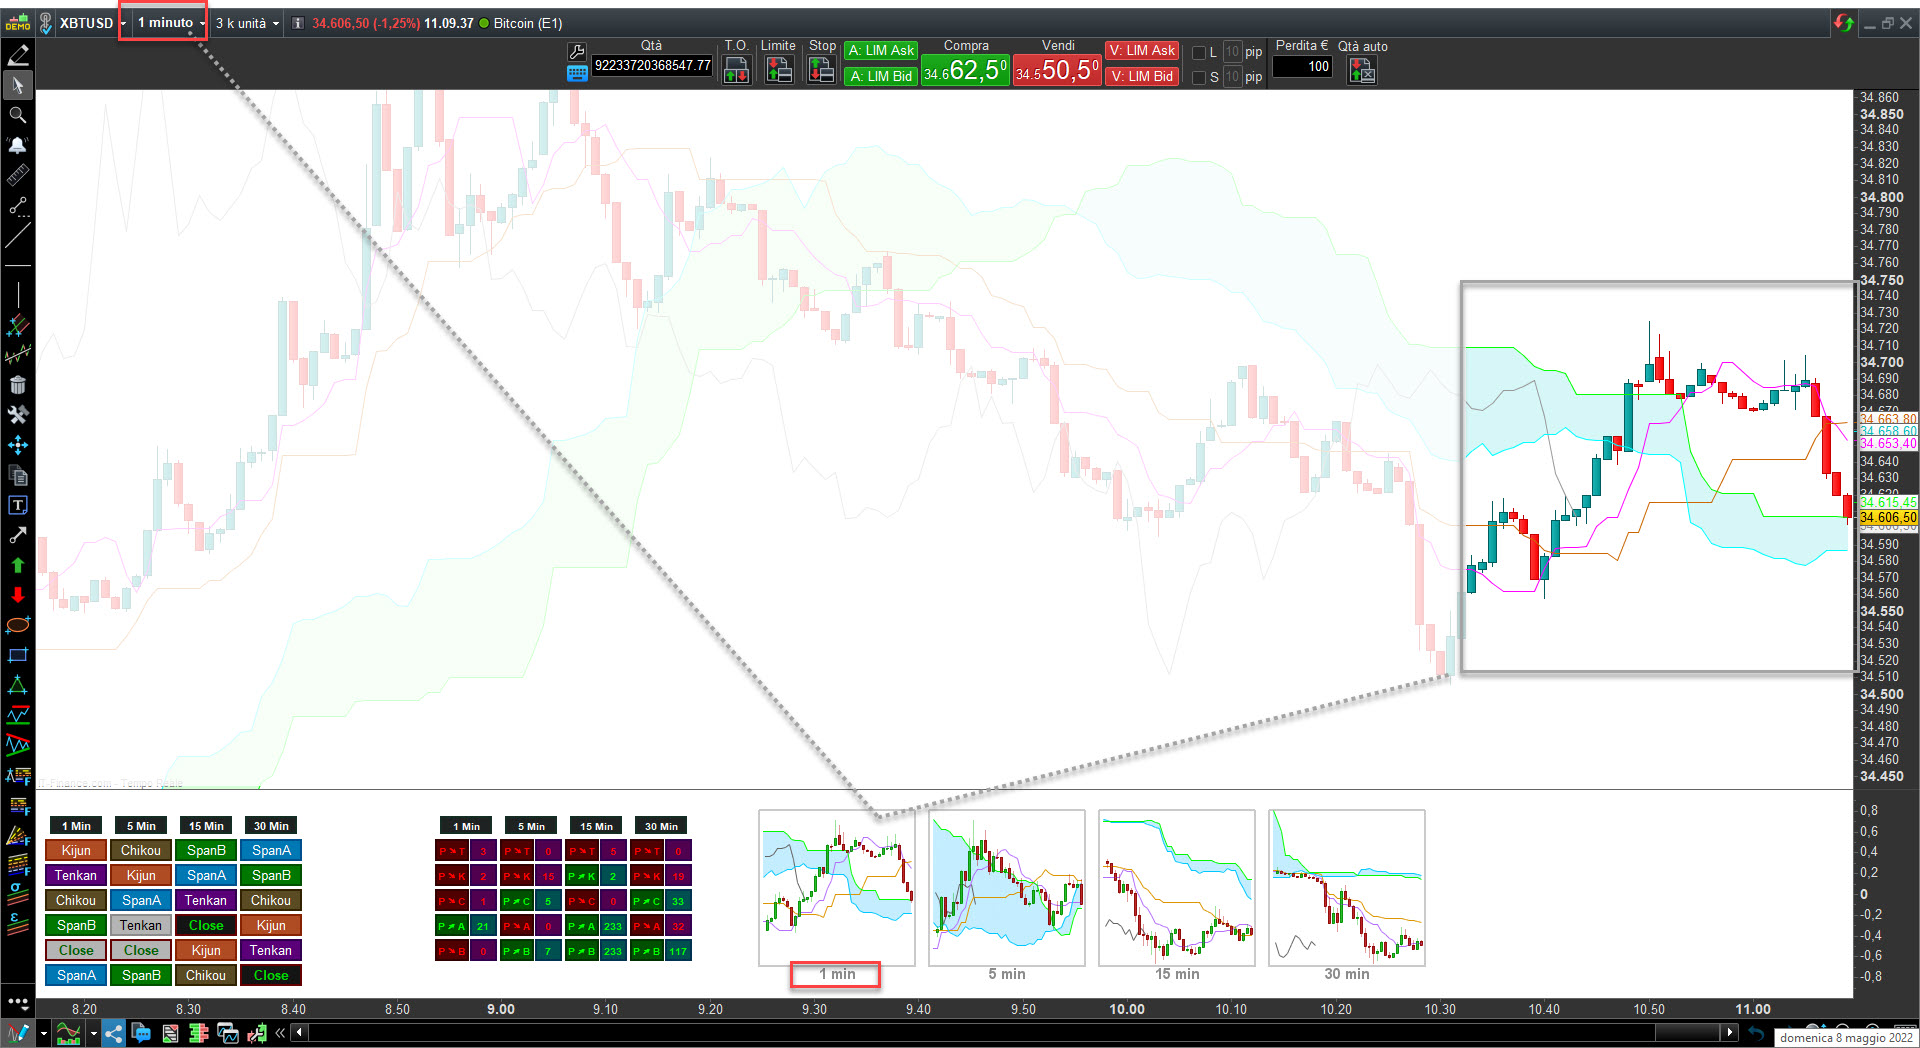
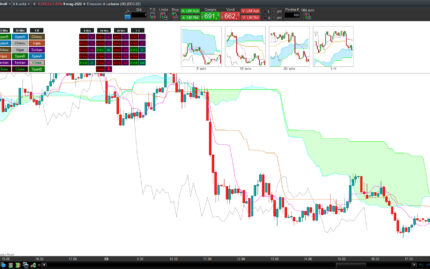
The Ichimoku Multi timeframe dashboard for ProRealTime provides the traders with a visual representation of the Ichimoku indicator of all timeframes.

  • The dashboard supply an immediate comprehension of the configuration of ichimoku in all timeframes.
  • The data of lines crossed by price give immediately information of the timing.
  • The new minicharts © allow to display every pattern of ichimoku, in higher timeframes.

Ichimoku Automatictrading.it

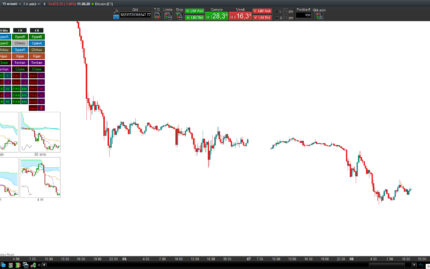
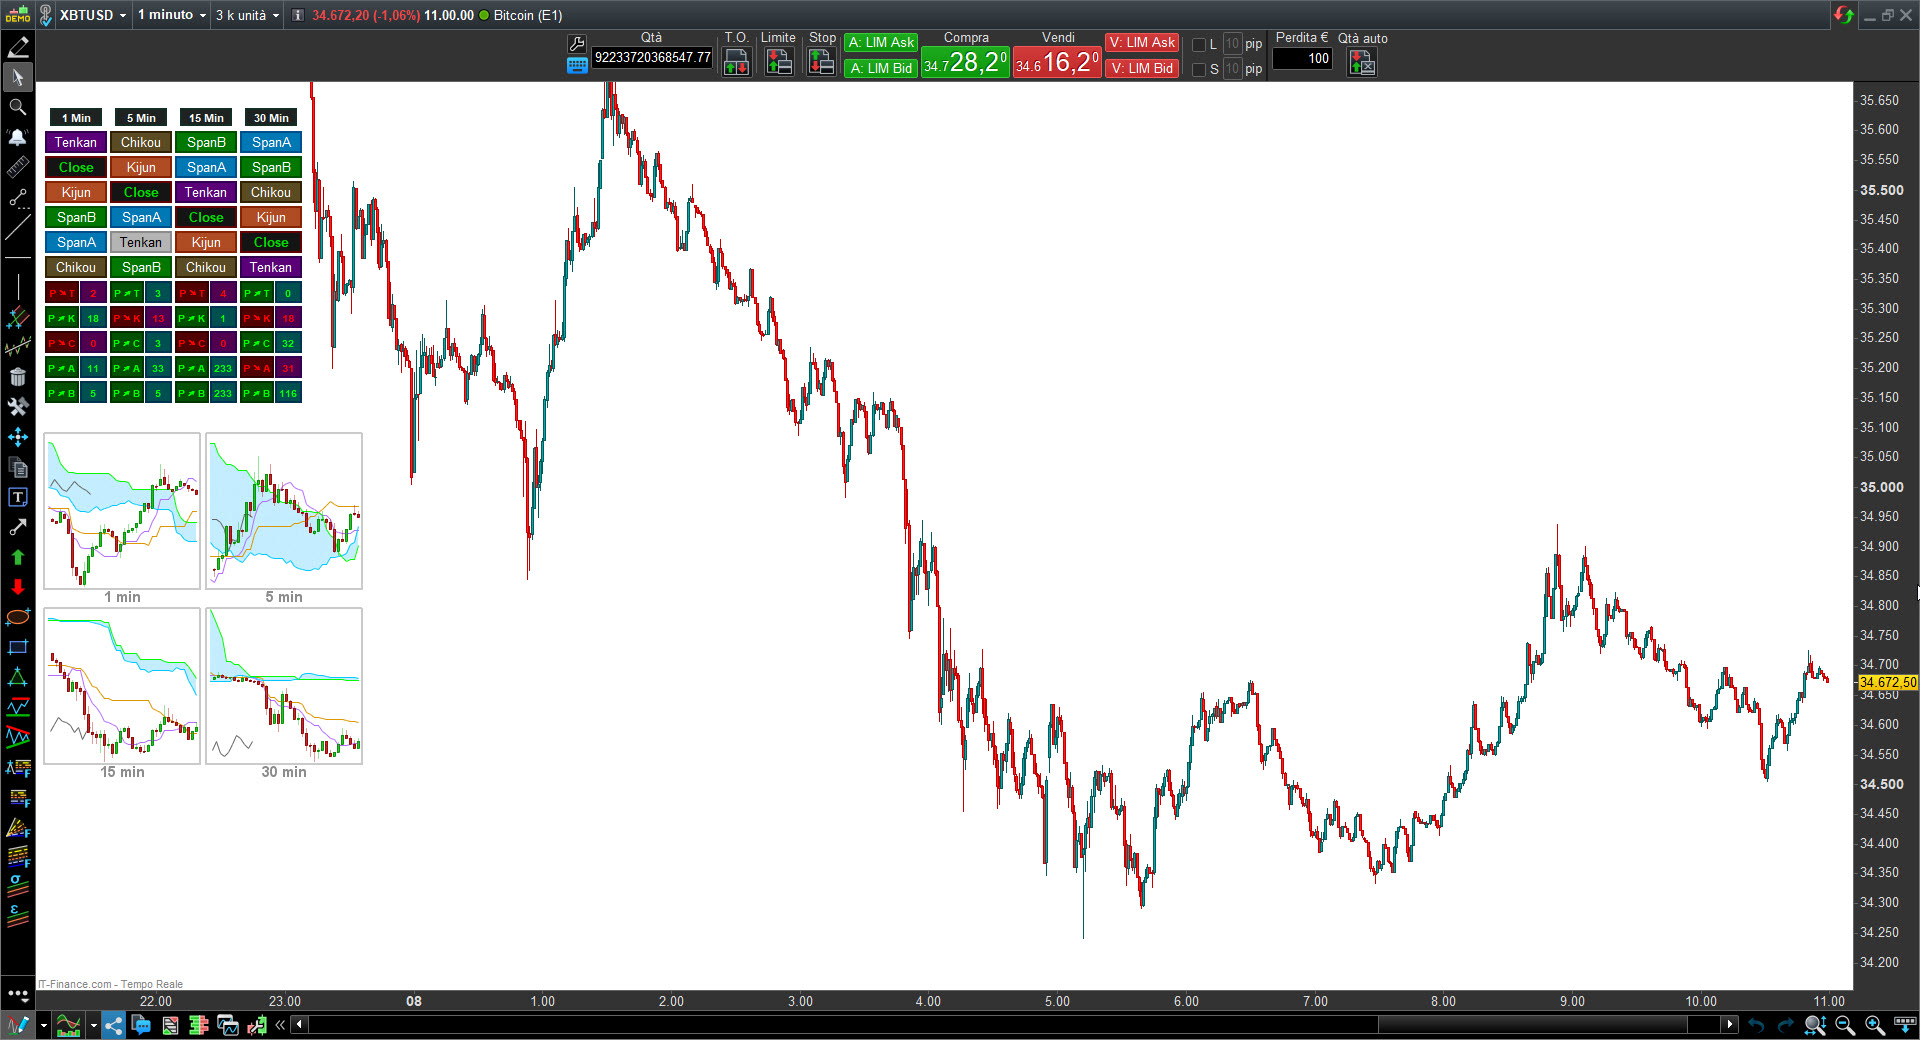
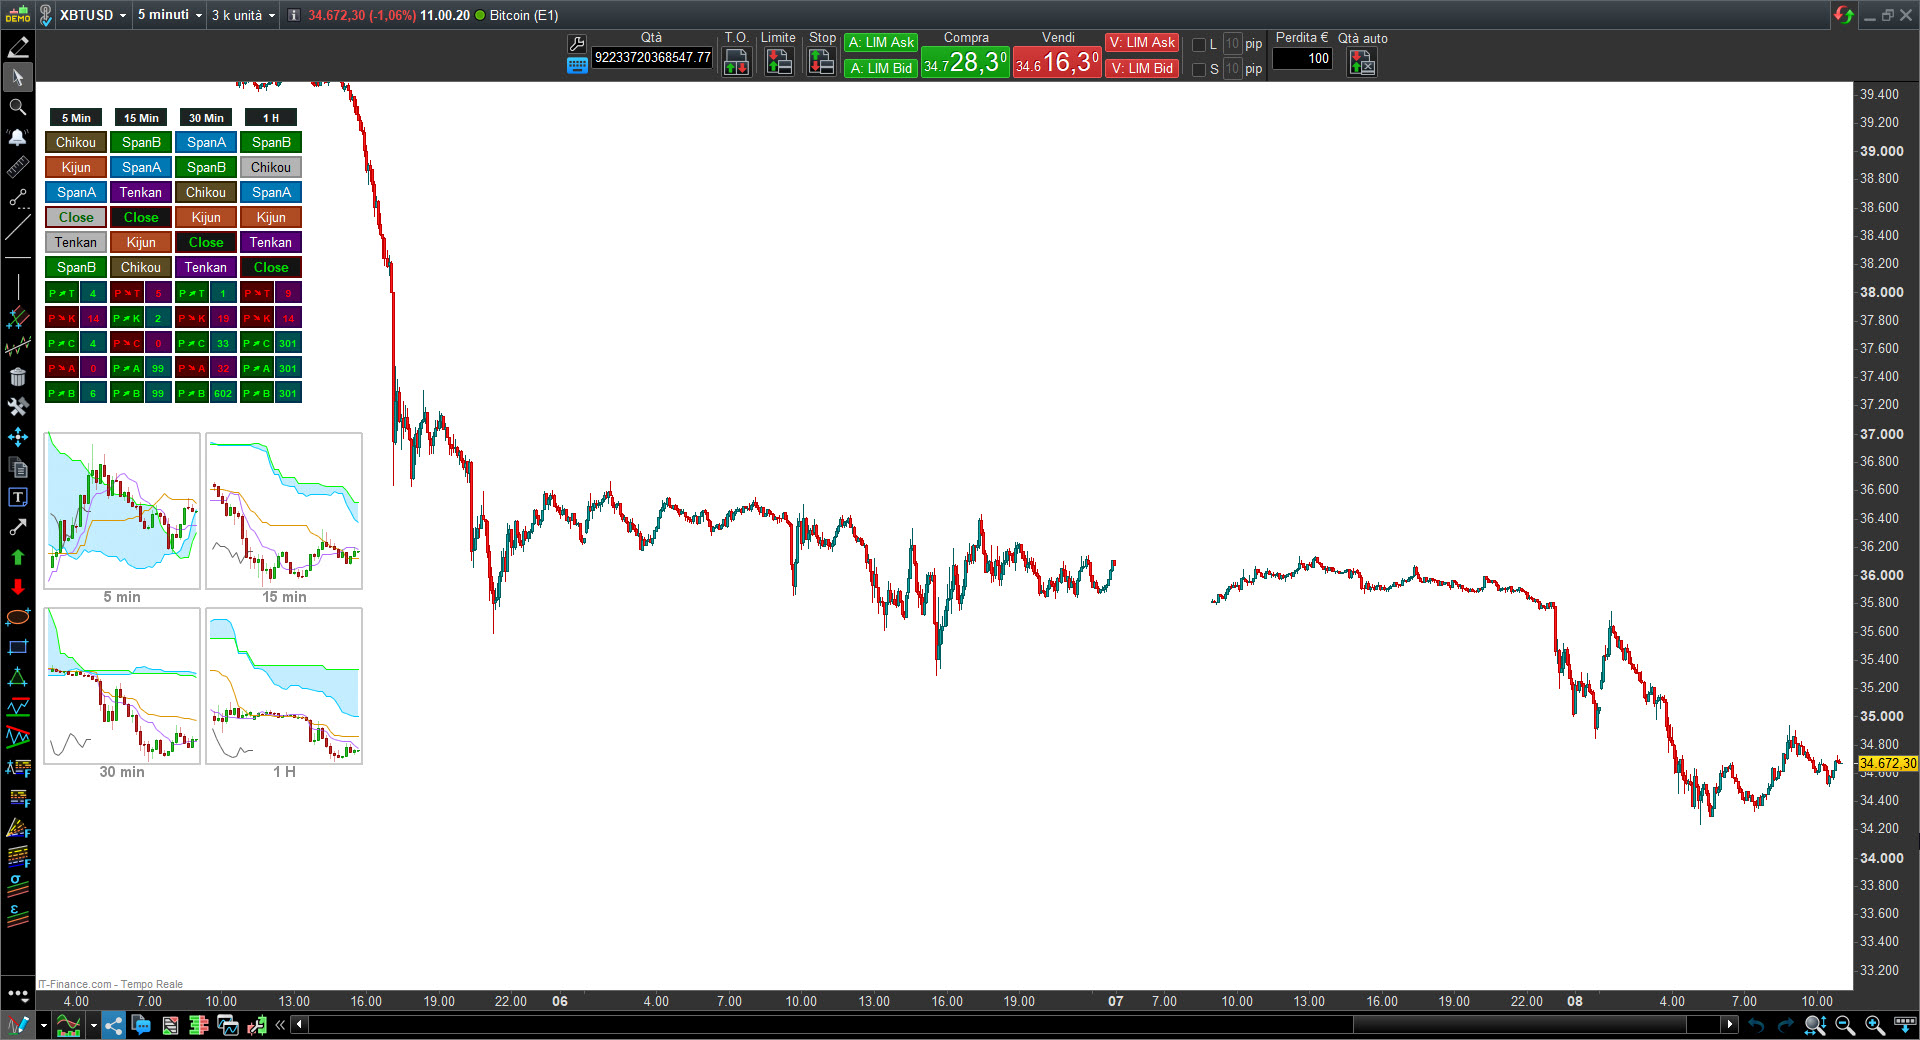
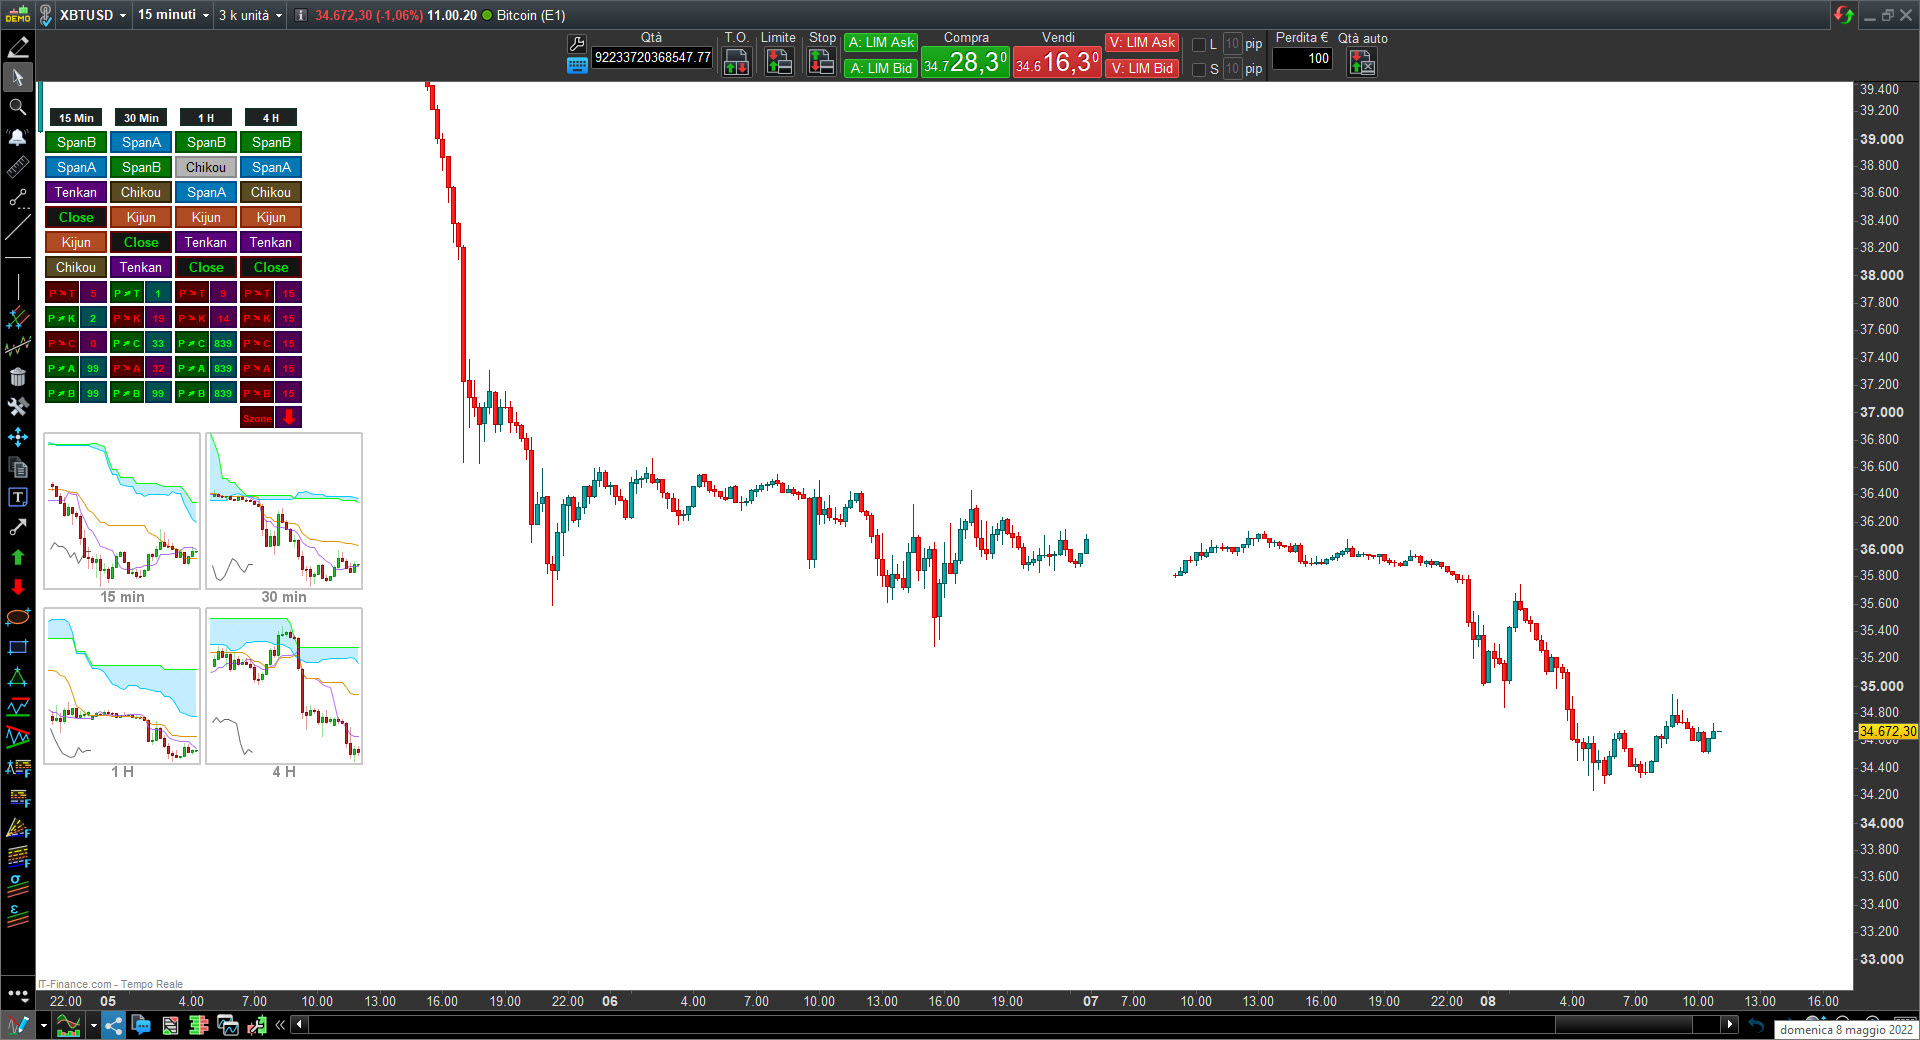
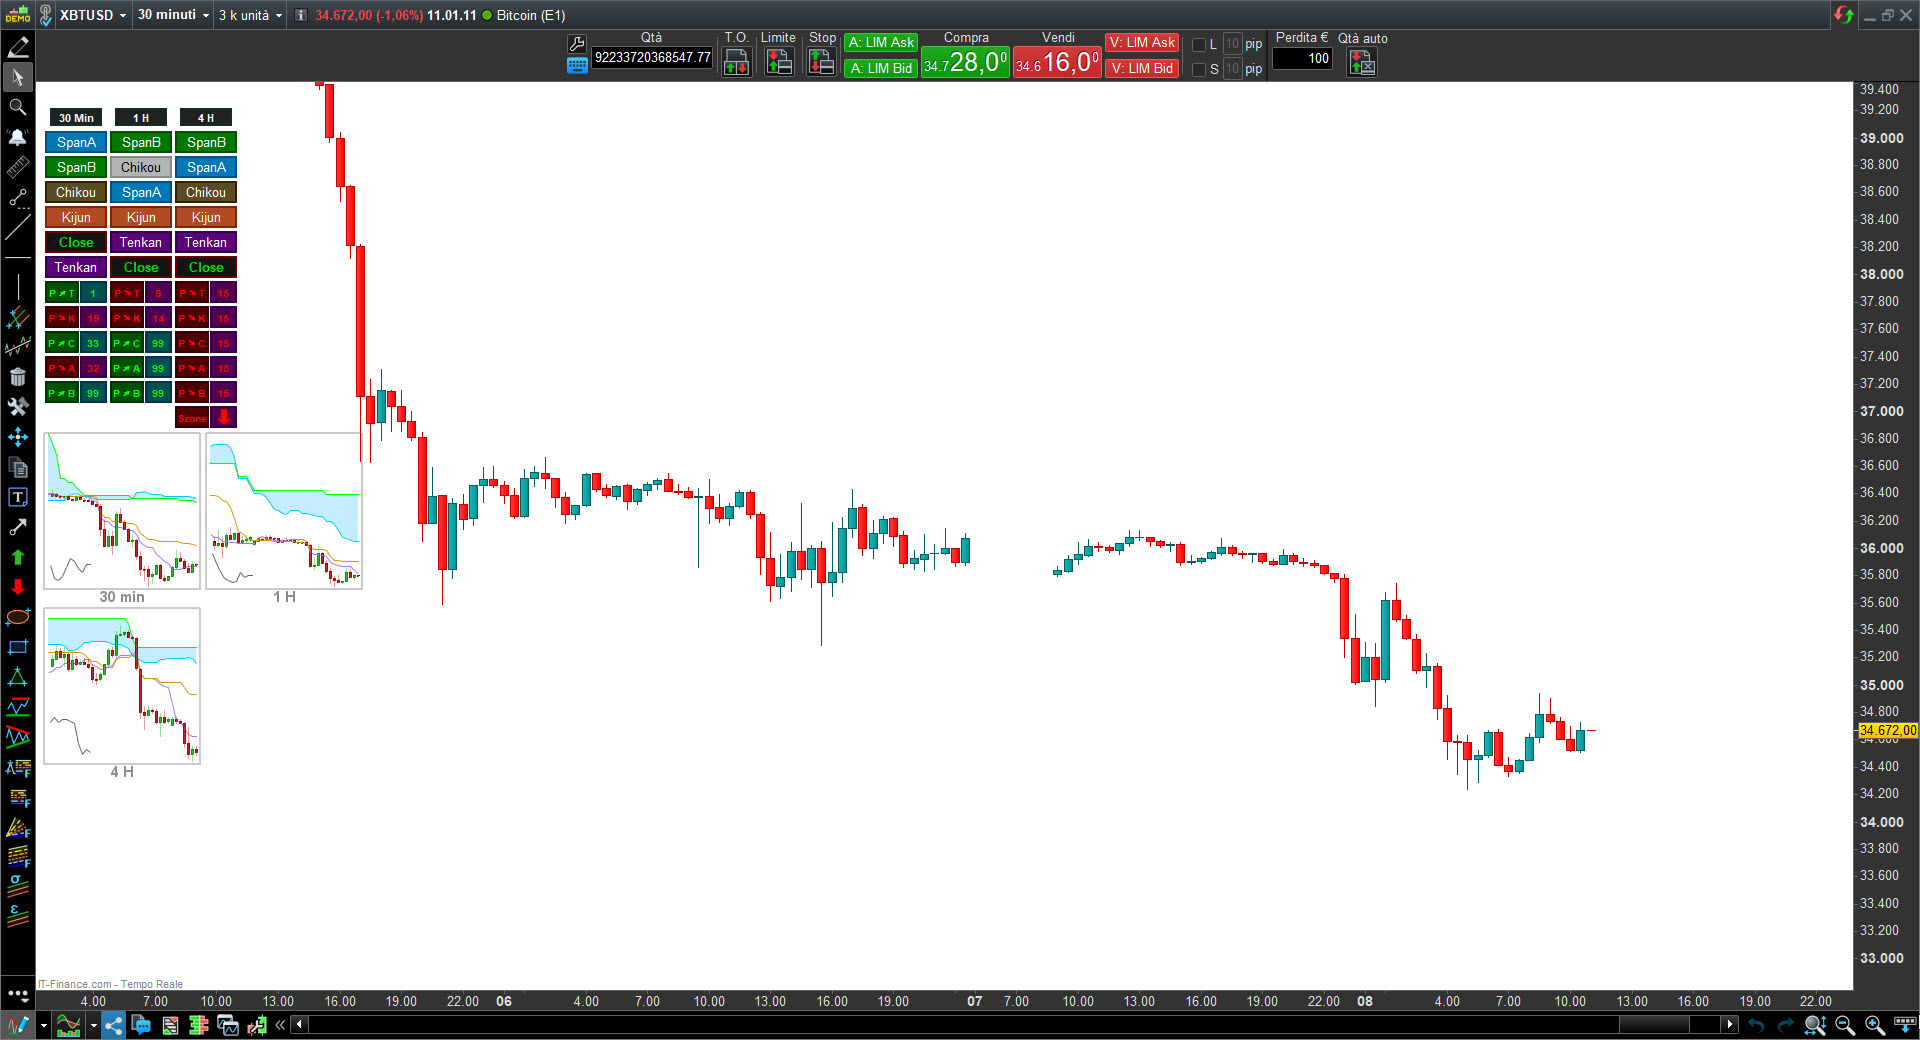
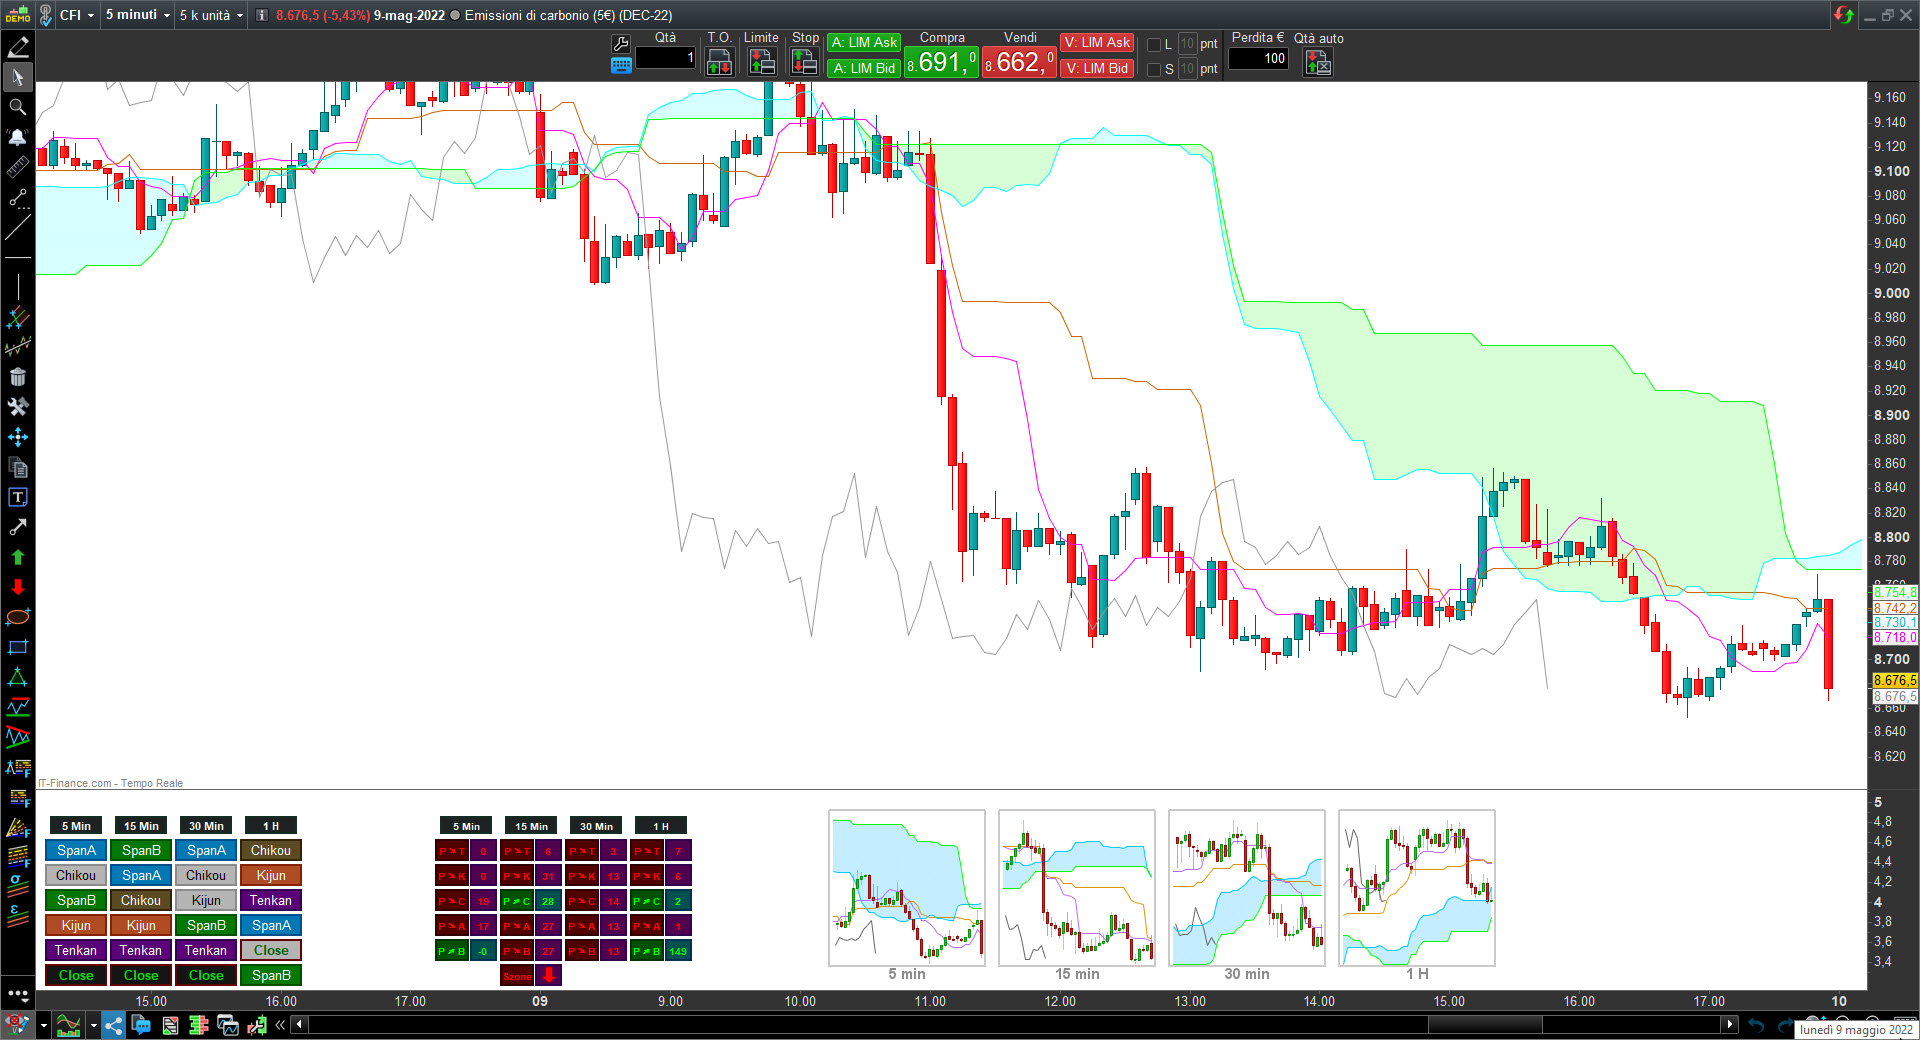
Dashboard could be applied on price chart:

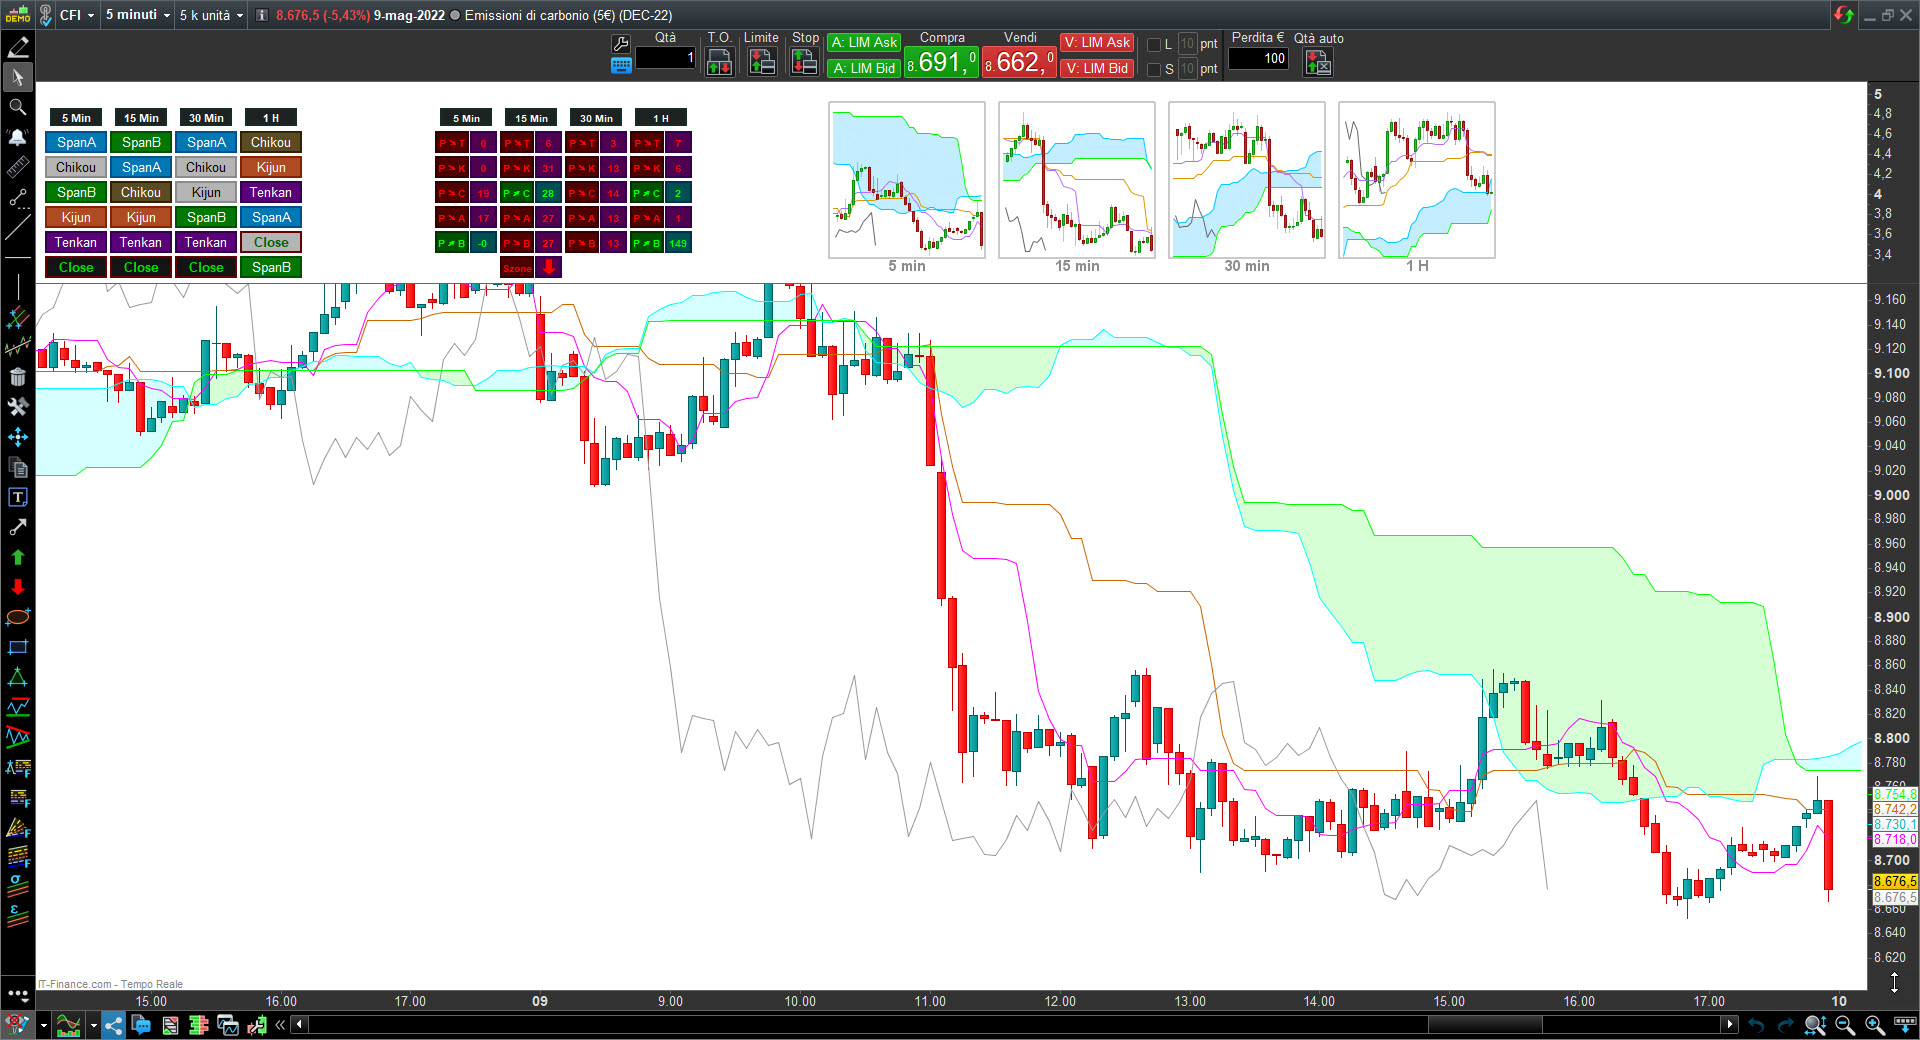
It can be appliaed below or above price chart also:


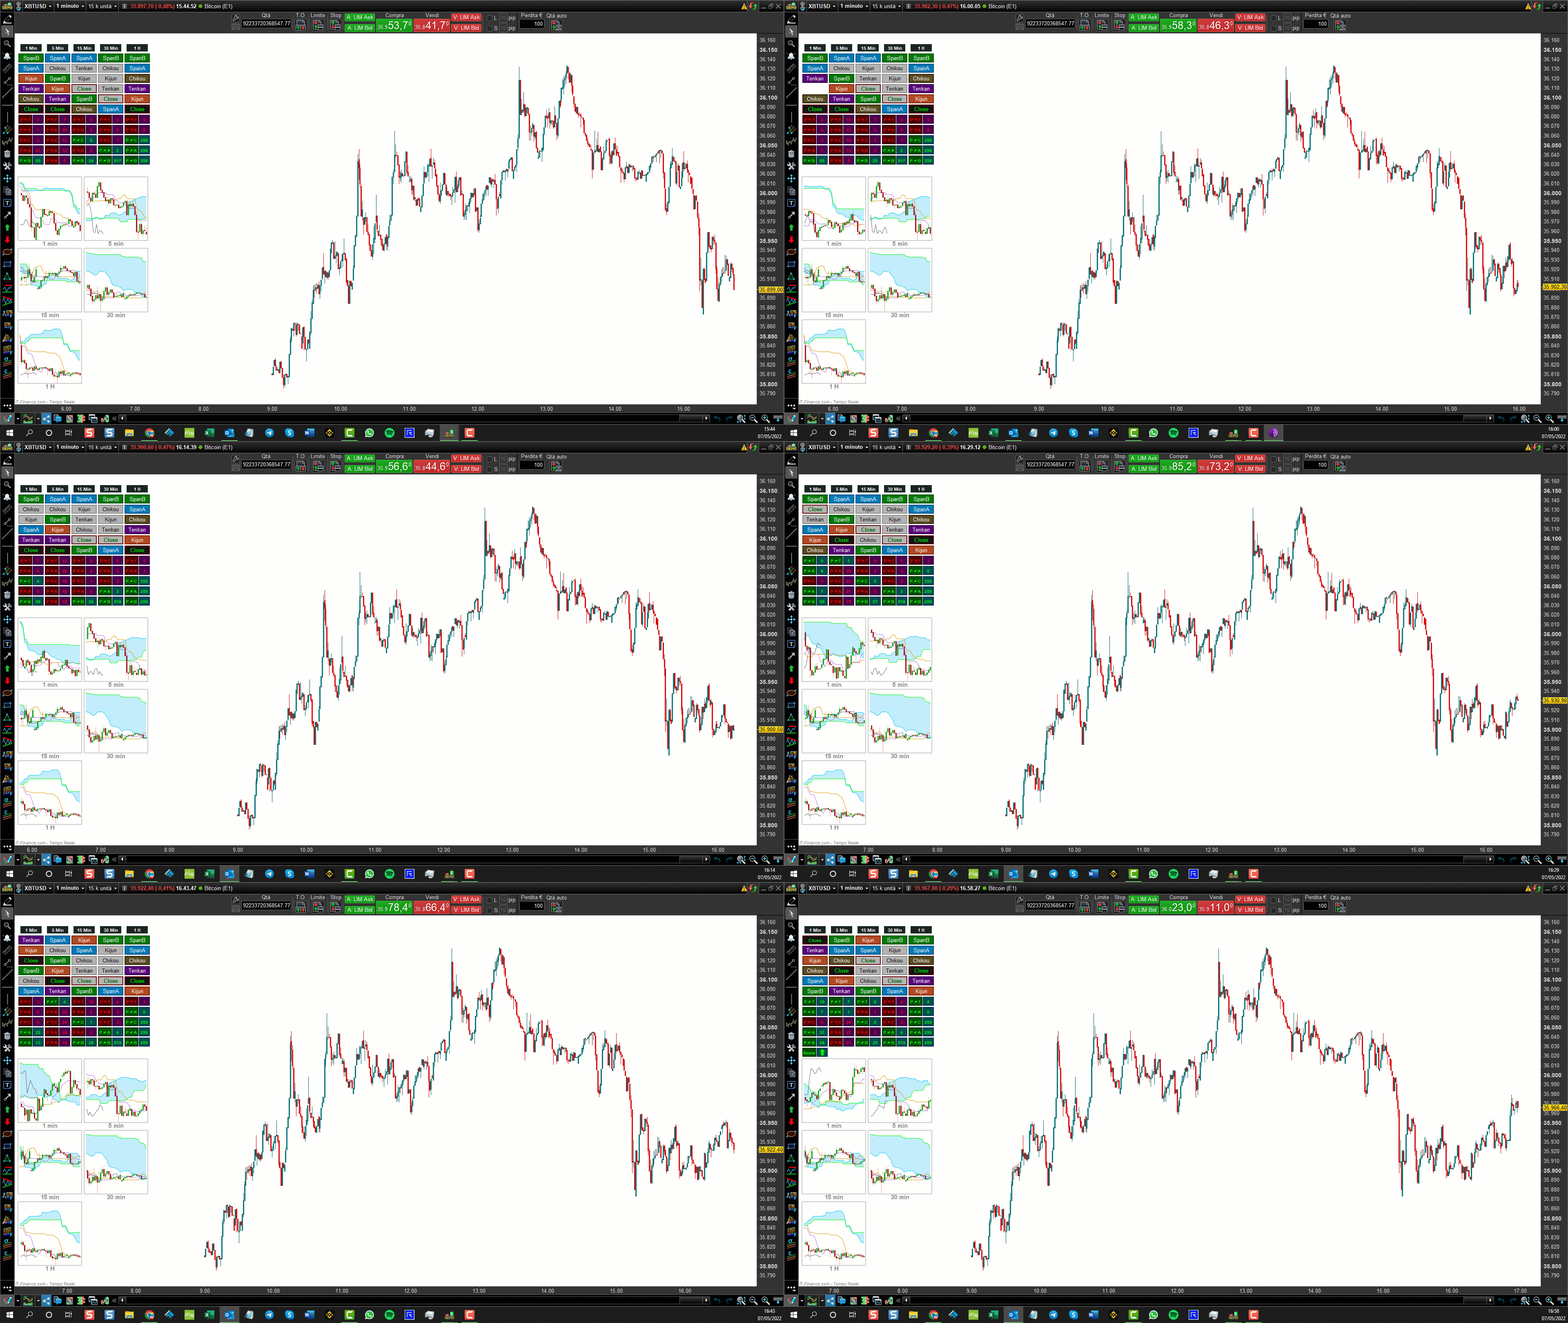
Minicharts multi timeframe of Ichimoku:

They work in real time, and are indispensable for having higher timeframes under control.


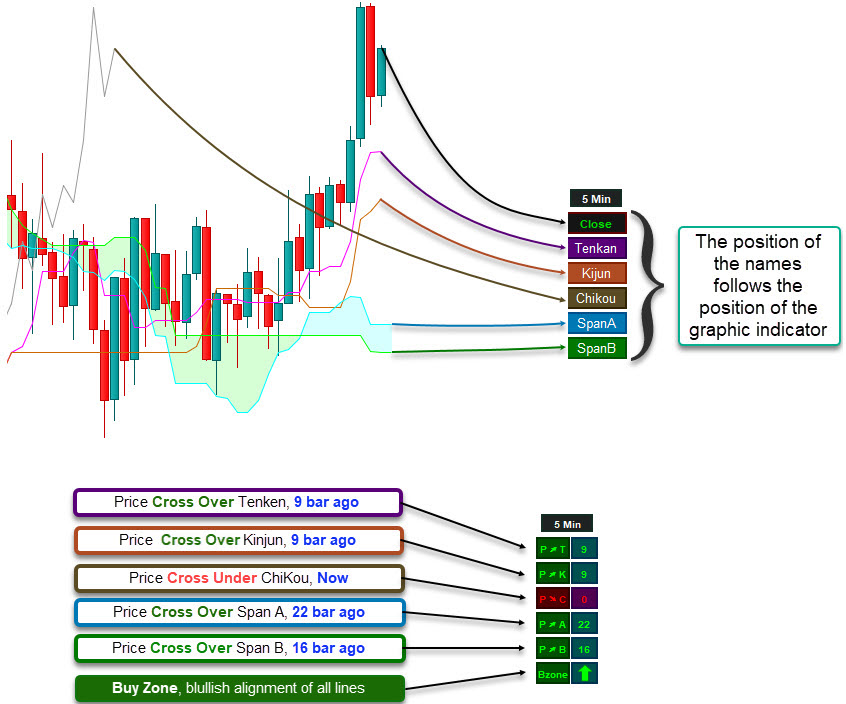
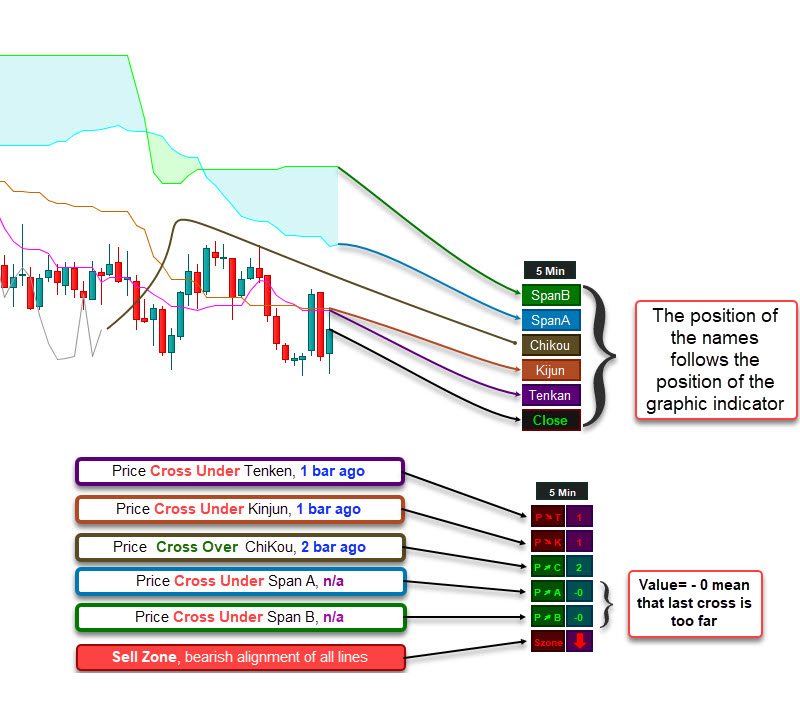
Dashboard details data:

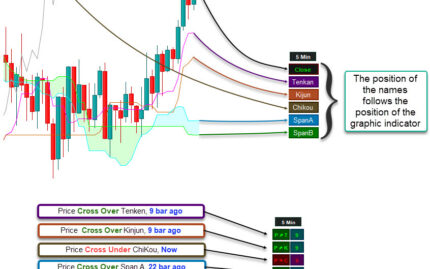
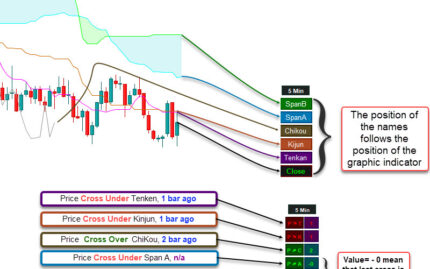
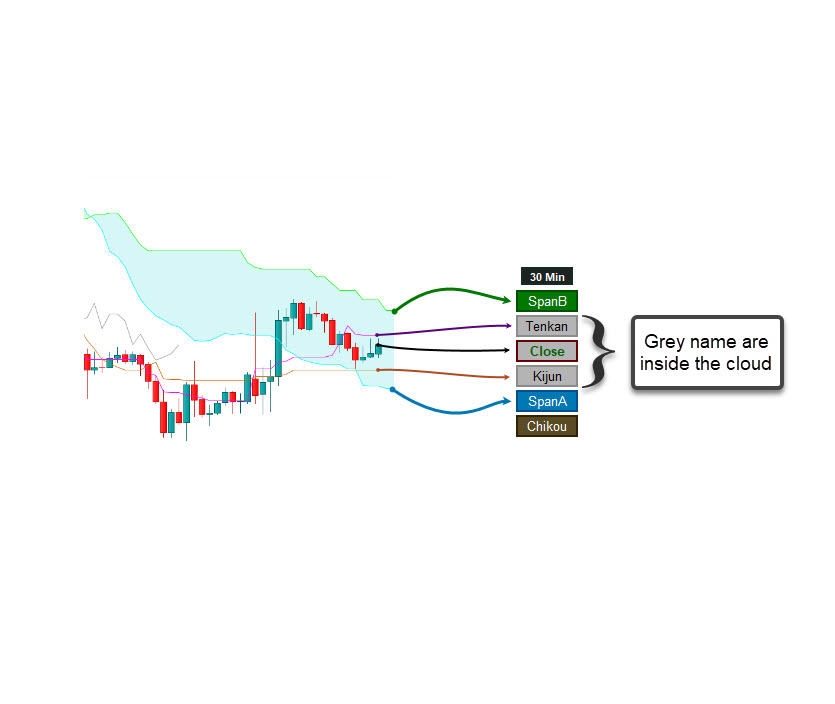
The dashboard is divided in two parts. The names of Ichimoku lines, their flows and their positioning following order of lines. The colors of the Ichimoku’s name lines become grey to notify thet they are inside the cloud.

In the under part of dashboard, the crossings are indicated, and the time that has elapsed since the last cross between price and ichimoku’s lines


In prorealtime, the multi time frame function provides that only the upper time frames can be displayed, since the data of the higher time frames are not available.

To obtain the data of the higher timeframes it is necessary to load on the chart a number of historical bars at least equal to the number of bars necessary to contain the data of the candlesticks of the higher timeframes.

This is technically mandatory to obtain the required data to give signals by codes. Without these datas, no signals, so please follow the above instructions. 


Indicator’s interface:

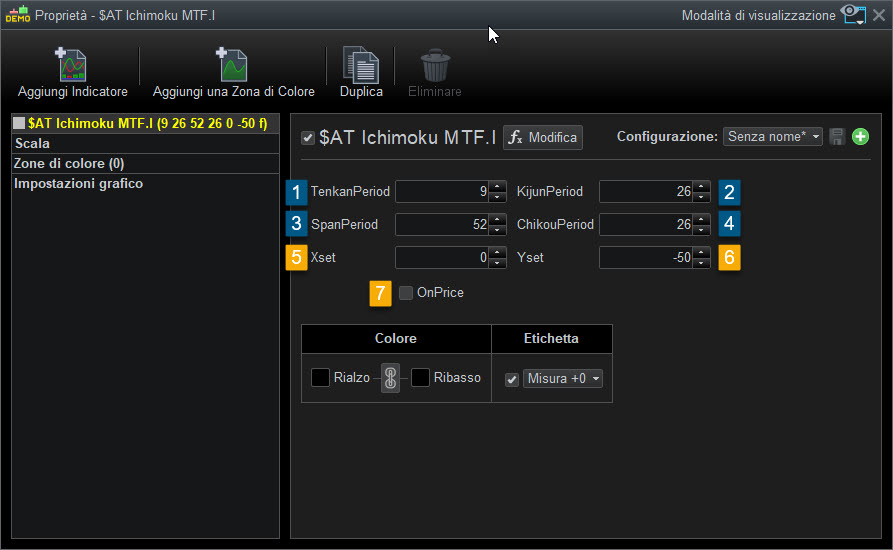
  1. Tenkan period: To set period of Tenkan – Sen
  2. Kinjun Period To set period of Kinjun – Sen
  3. Chikou Period To set bars offset for Chikou line
  4. Span Period : To set bars offset for Span A and Span B
  5. Yset: Move the dashboard on the Y axis, (up / down)
  6. Xset: Move the dashboard on the X axis, (left/ right)
  7. OnPrice: Select true, if you want to apply indicator on price chart, else select false if you want to apply indicator below or above price chart.
Valoraciones

No hay valoraciones aún.

Solo los usuarios registrados que hayan comprado este producto pueden hacer una valoración.

Solicitud de información

Your personal data will be used to support your experience throughout this website, to manage access to your account, and for other purposes described in our política de privacidad

Más artículos por AutomaticTrading

Product Image

1-2-3 Swing trading screener

The best “price action” pattern!

79

5

Product Image

Double Top-Bottom screener

Escanea los mercados en busca del patrón de doble máximo y doble mínimo con un solo clic.

79

3

Product Image

Graphic Pattern Scanner – Combo: 2 Indicators + 1 Screener

Detect graphic patterns in your preferred markets in multi time frame simultaneously

¡Listo para unirse a nuestro mercado trading!
Además de 1,000,000 los clientes potenciales necesitan productos trading de calidad profesional
Únase a nosotros hoy mismo