25
Compatibile con

Favoriti:2   Visualizzazioni:275   Recensioni:0  

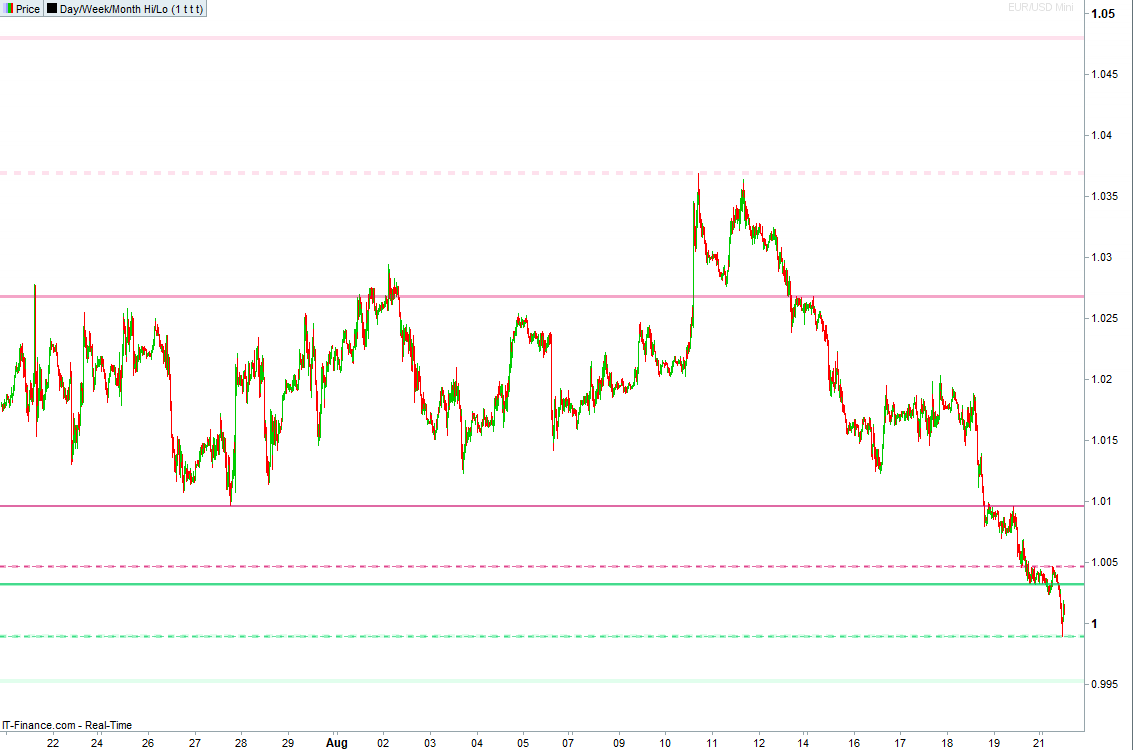
Show significant areas of Support and Resistance where price is likely to react. Current and previous Day, Week, and Month are selectable.

Report Abuse

The highs and lows of current and previous Days, Weeks and Months can be areas where price reacts strongly and trading opportunities arise.

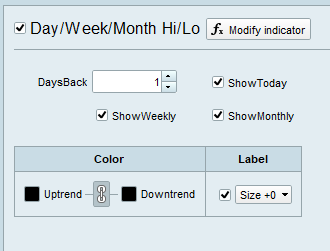
This indicator gives you the ability to easily display these levels so you can use them if they are part of your strategy or regular chart markup.

Due to limitations of the indicator language, this indicator will only work on the daily timeframe and lower. It has been tested on all of the standard timeframes from 1 second to 1 day. It will not work on tick or volume based charts.

Recensioni

Ancora non ci sono recensioni.

Solamente clienti che hanno effettuato l'accesso ed hanno acquistato questo prodotto possono lasciare una recensione.

Richiesta Prodotto

Your personal data will be used to support your experience throughout this website, to manage access to your account, and for other purposes described in our privacy policy

Altri articoli da Price Action Indicators

Product Image

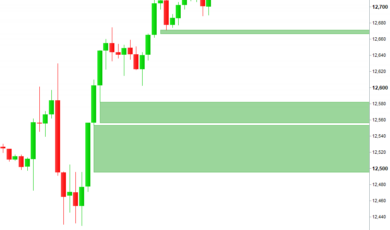
Fair Value Gaps (Order Imbalance)

Find areas of Order Imbalance that may influence Price.

47

1

Product Image

Reversal Warning

Spot Pauses and Reversals as they happen

25

4

Pronto a unirti al nostro Marketplace!
Più 1,000,000 i potenziali clienti hanno bisogno di prodotti commerciali di qualità pro
Unisciti a noi oggi