25
Compatible from

Favorites: 2   Views: 188   Reviews: 0  

Show significant areas of Support and Resistance where price is likely to react. Current and previous Day, Week, and Month are selectable.

Report Abuse

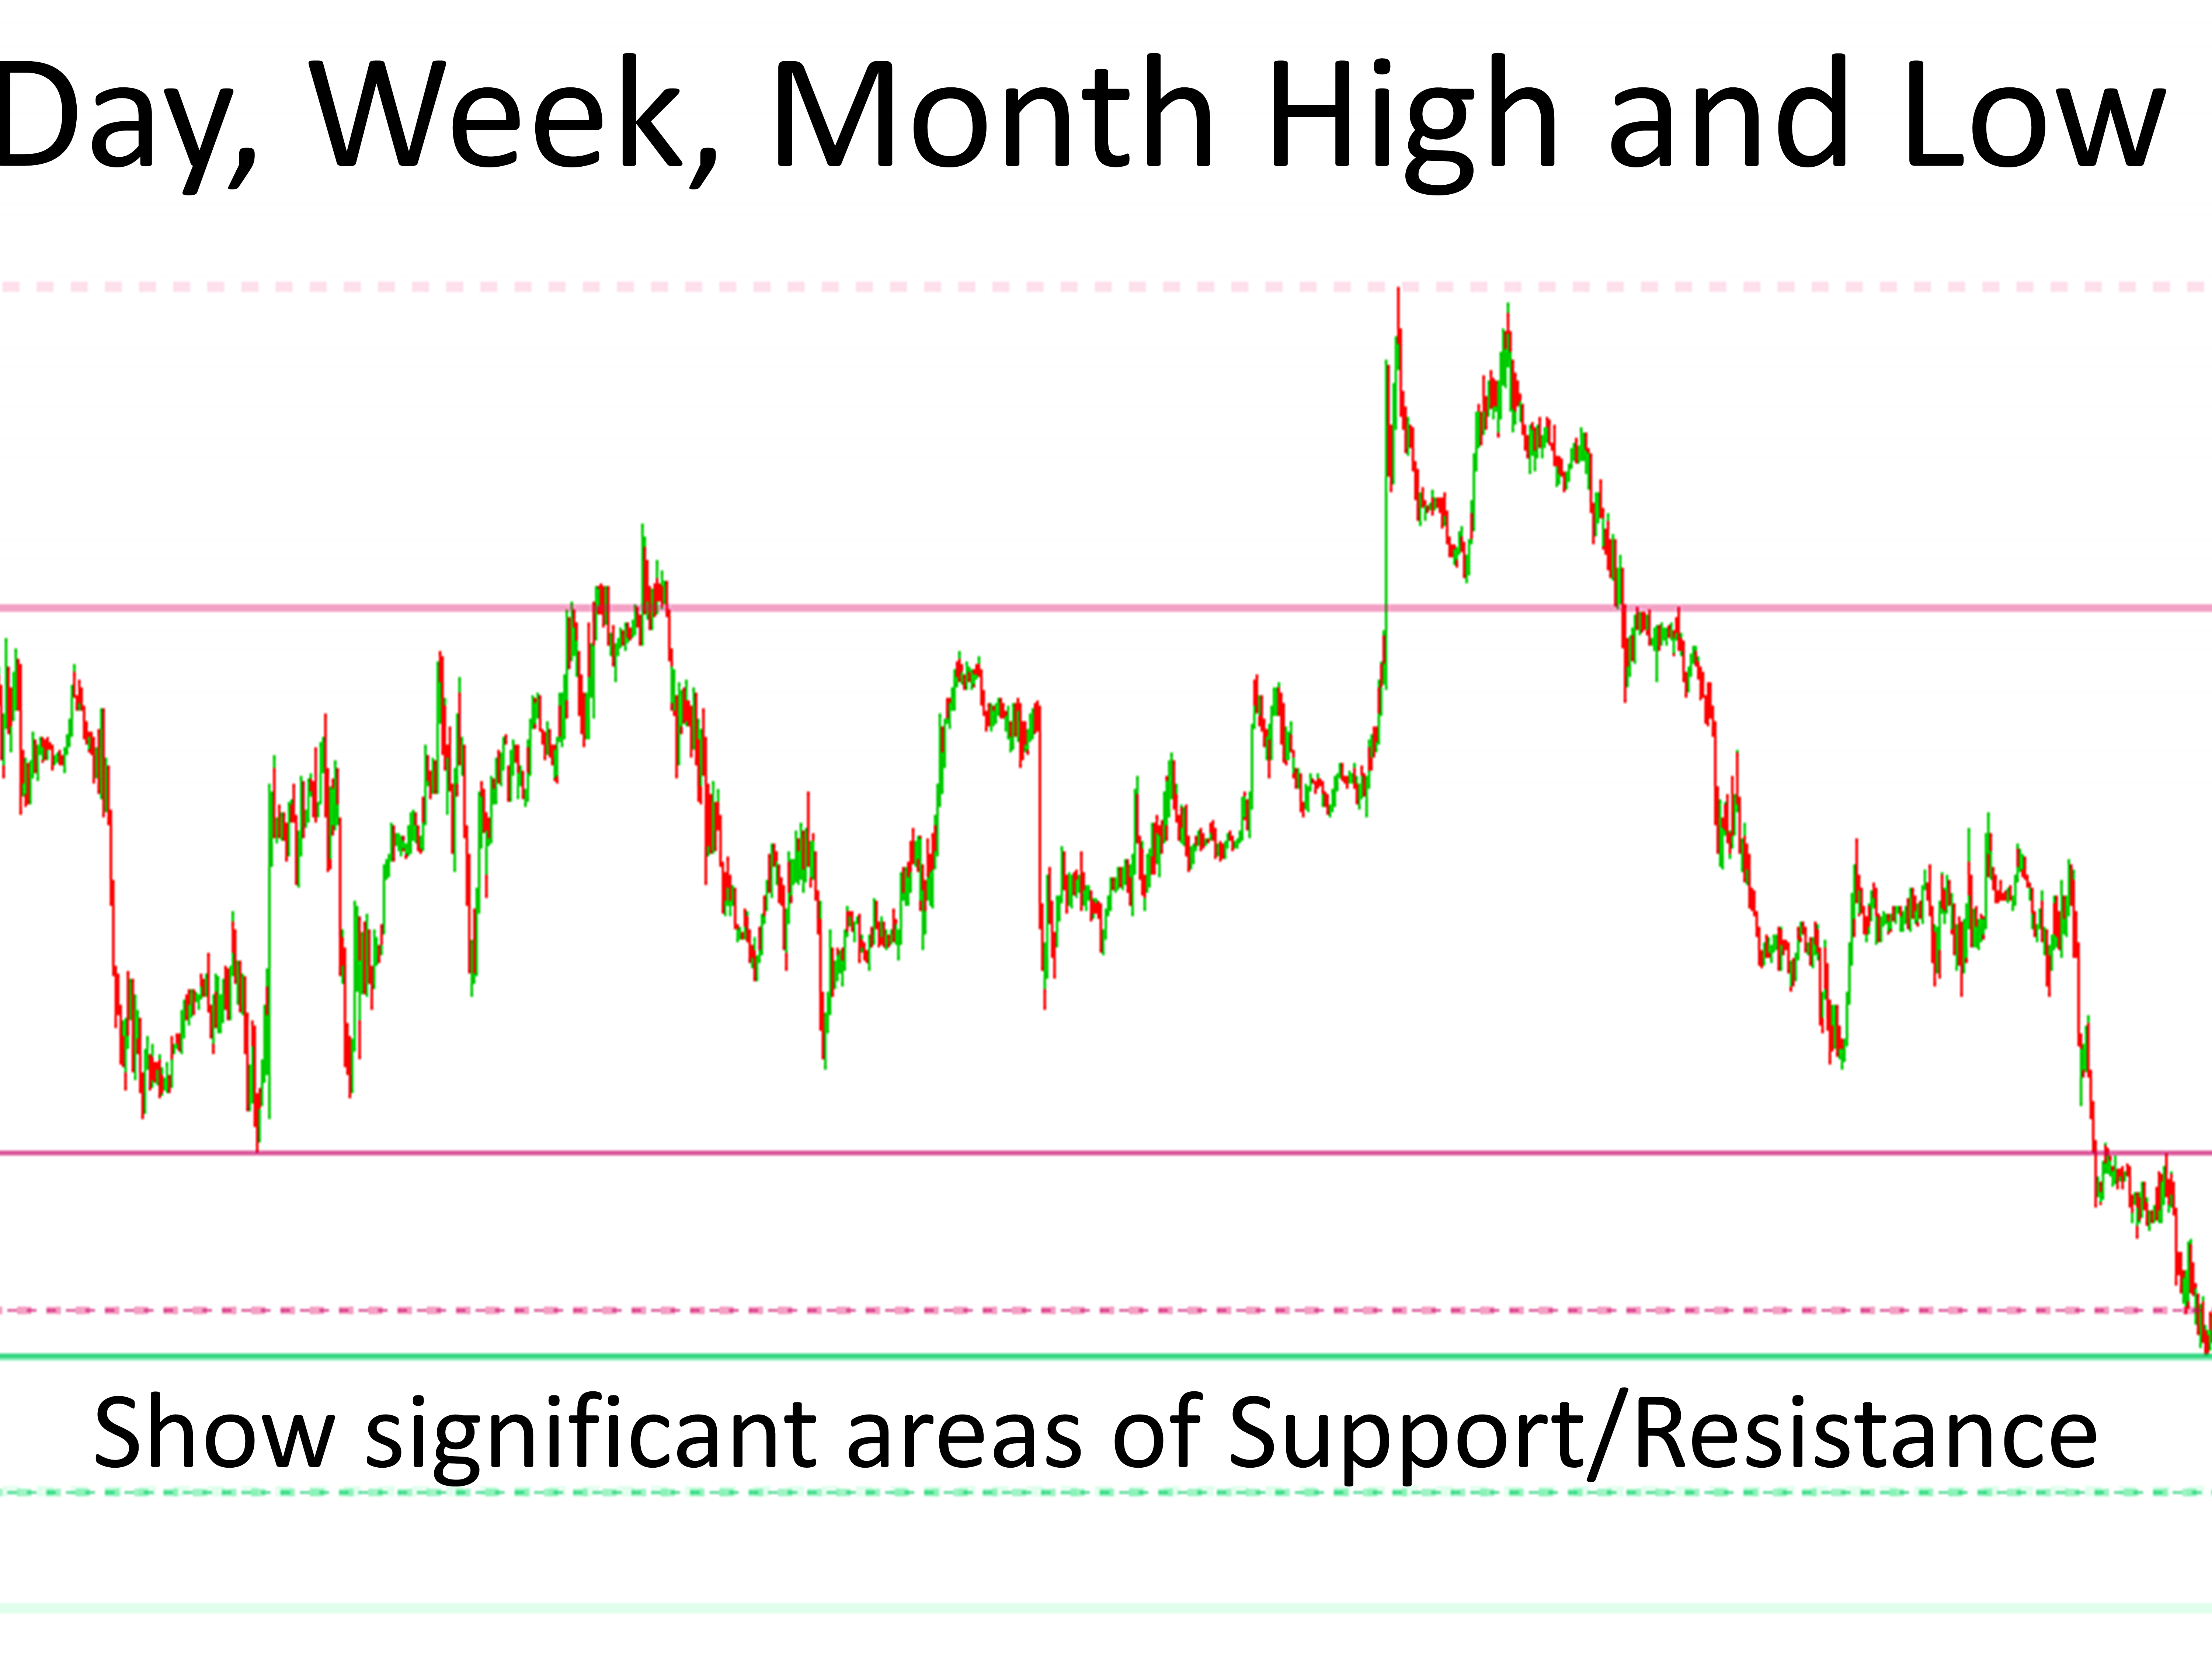
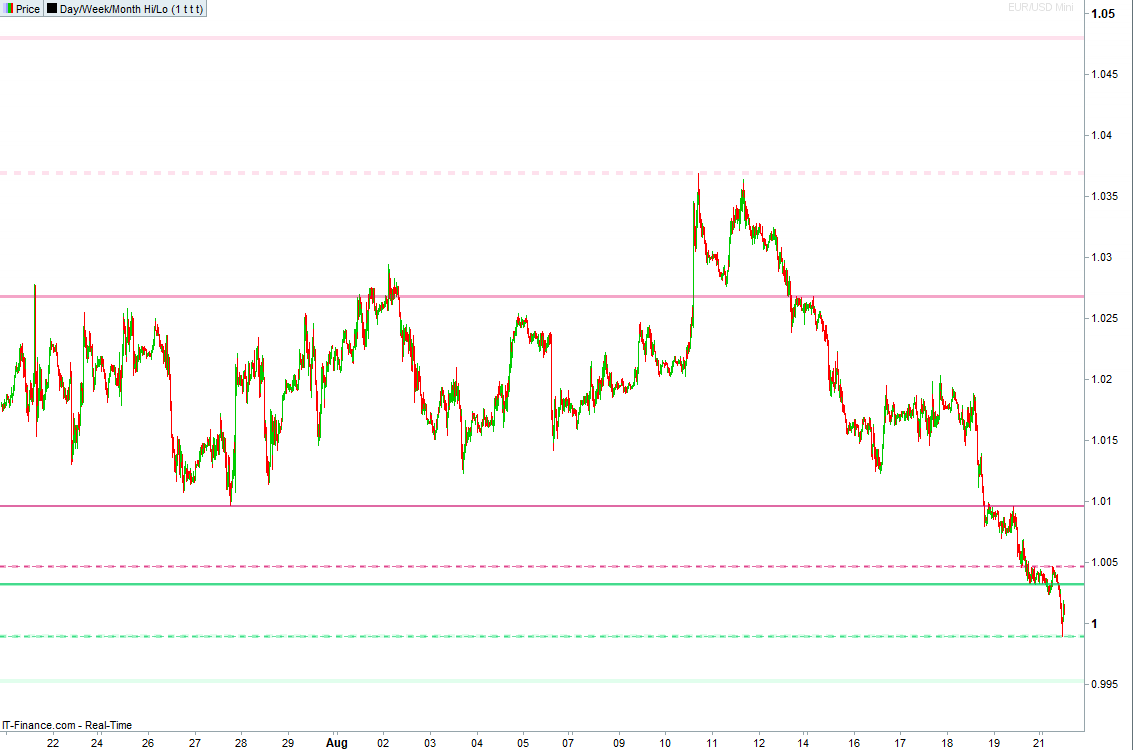
The highs and lows of current and previous Days, Weeks and Months can be areas where price reacts strongly and trading opportunities arise.

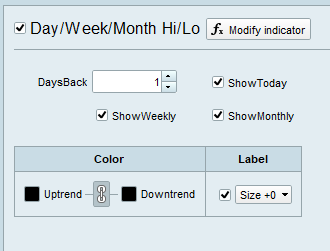
This indicator gives you the ability to easily display these levels so you can use them if they are part of your strategy or regular chart markup.

Due to limitations of the indicator language, this indicator will only work on the daily timeframe and lower. It has been tested on all of the standard timeframes from 1 second to 1 day. It will not work on tick or volume based charts.

Reviews

There are no reviews yet.

Only logged in customers who have purchased this product may leave a review.

Product Enquiry

Your personal data will be used to support your experience throughout this website, to manage access to your account, and for other purposes described in our privacy policy

More Items by Price Action Indicators

Product Image

Fair Value Gaps (Order Imbalance)

Find areas of Order Imbalance that may influence Price.

47

1

Product Image

Reversal Warning

Spot Pauses and Reversals as they happen

25

4

Ready to Join Our Trading Marketplace!
Over 1,000,000 potential customers are in need for pro quality trading products
Join Us Today