

 INSTALLATION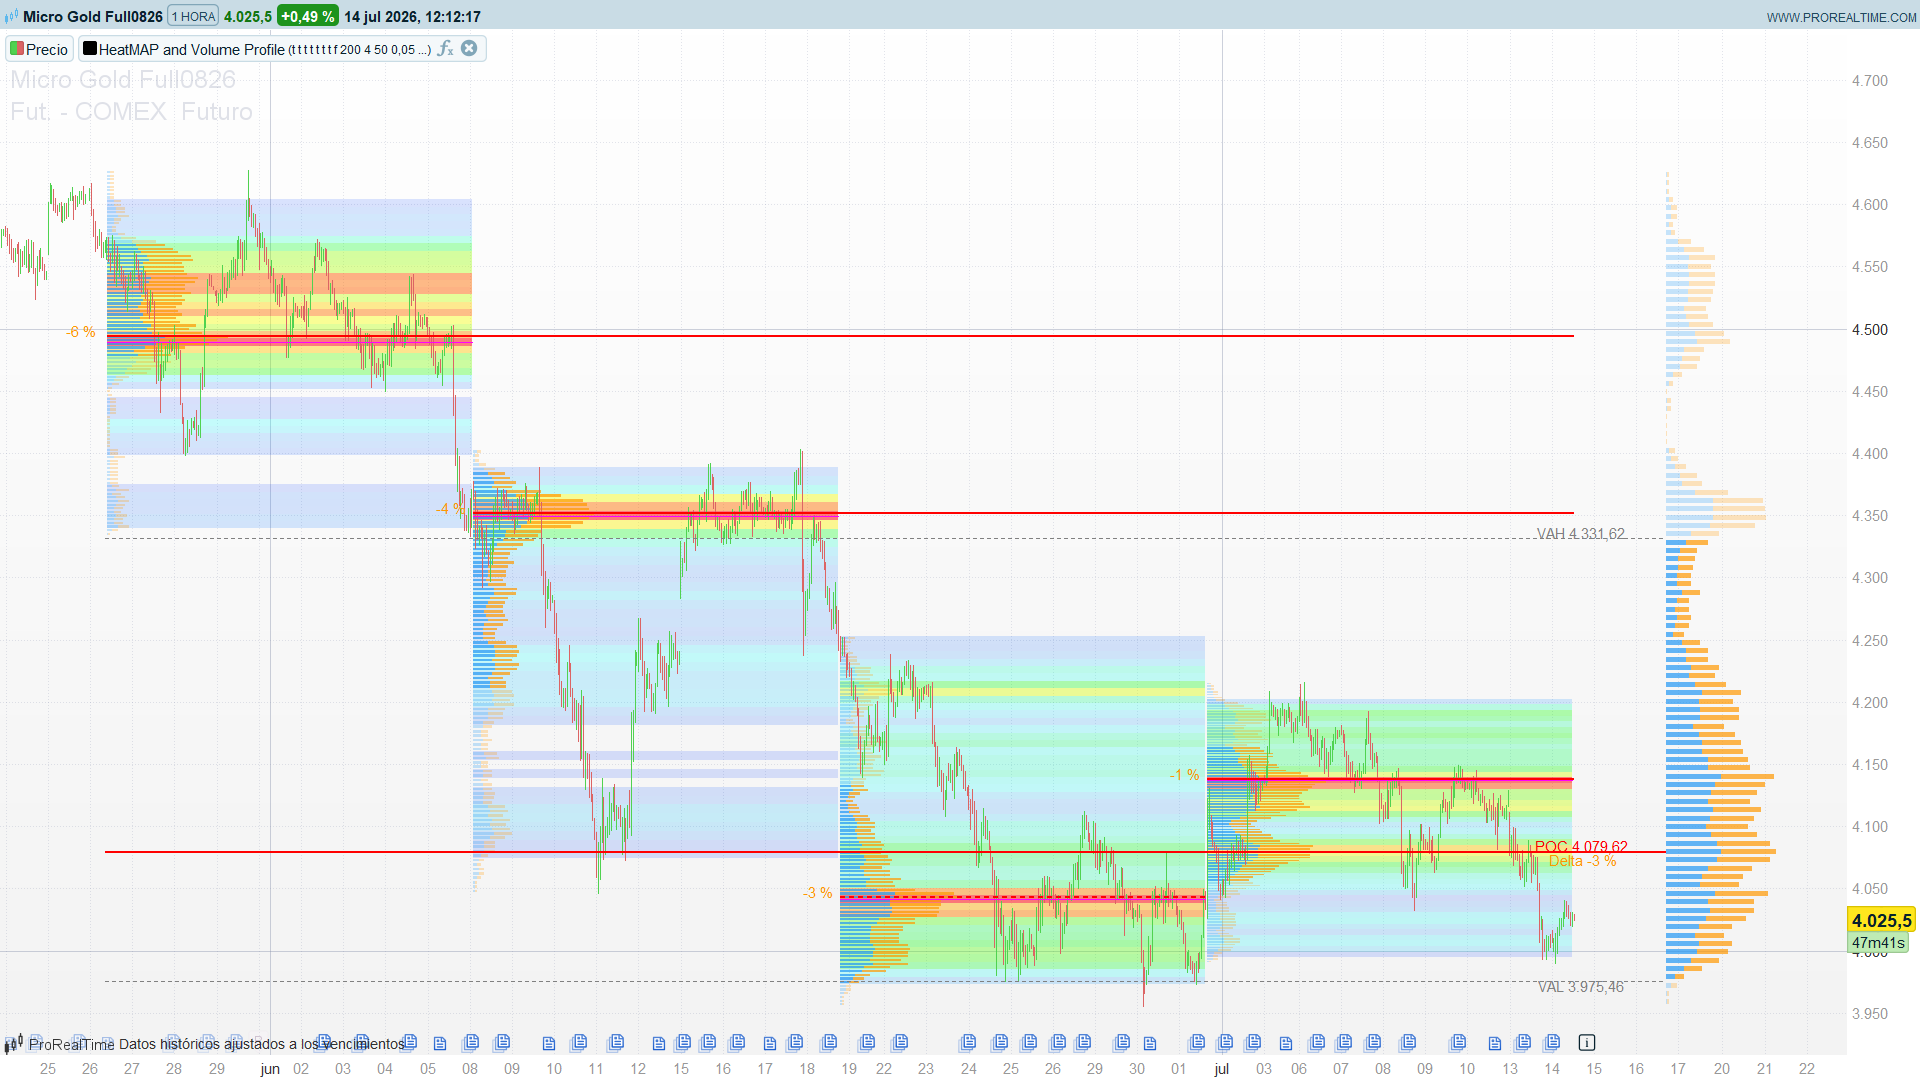
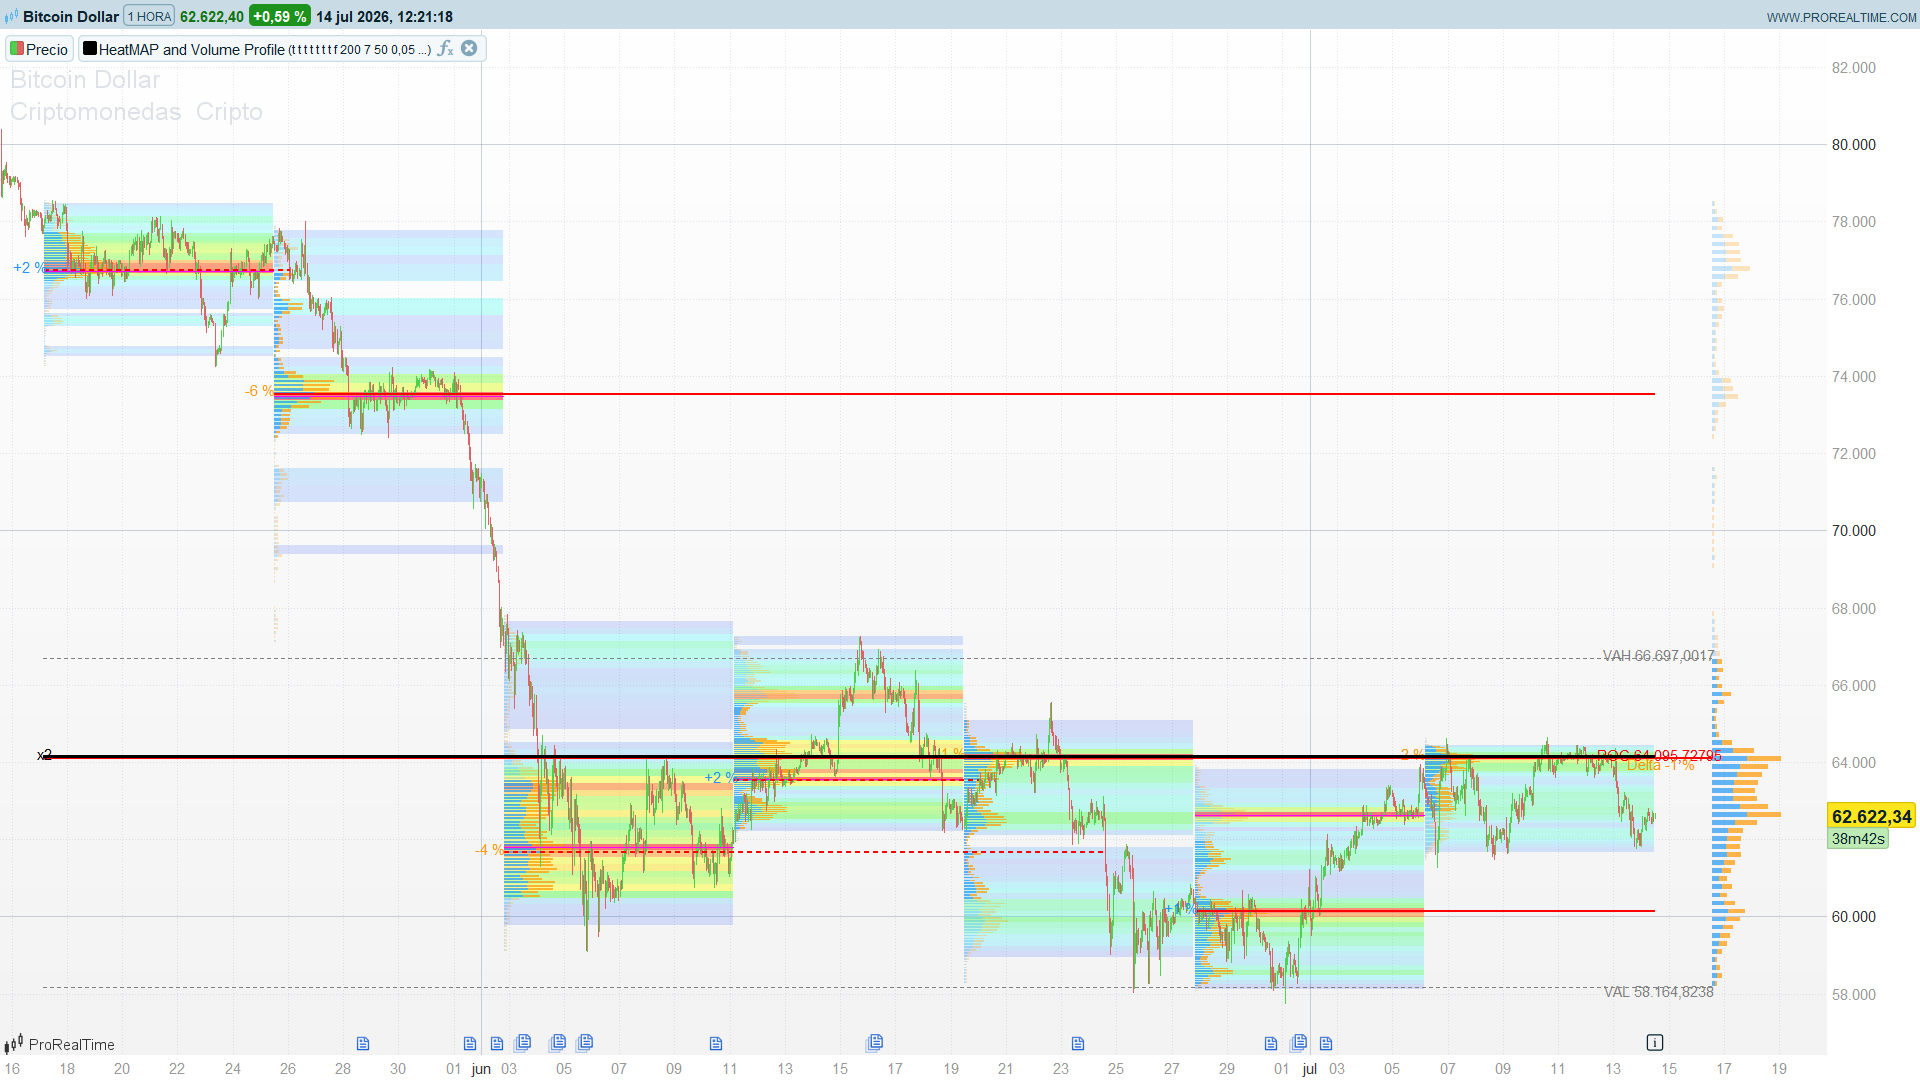

🆕 Major update (v8): engine rebuilt from scratch. If you already own the indicator, this is a free update. The HeatMap no longer measures “touch frequency”: it now measures real time spent at price, and the Volume Profile is no longer a flat histogram: it splits buyers and sellers and marks the Value Area. On top of that comes a full order flow layer (confluence, delta, naked POC).
🔥 Time-based HeatMap
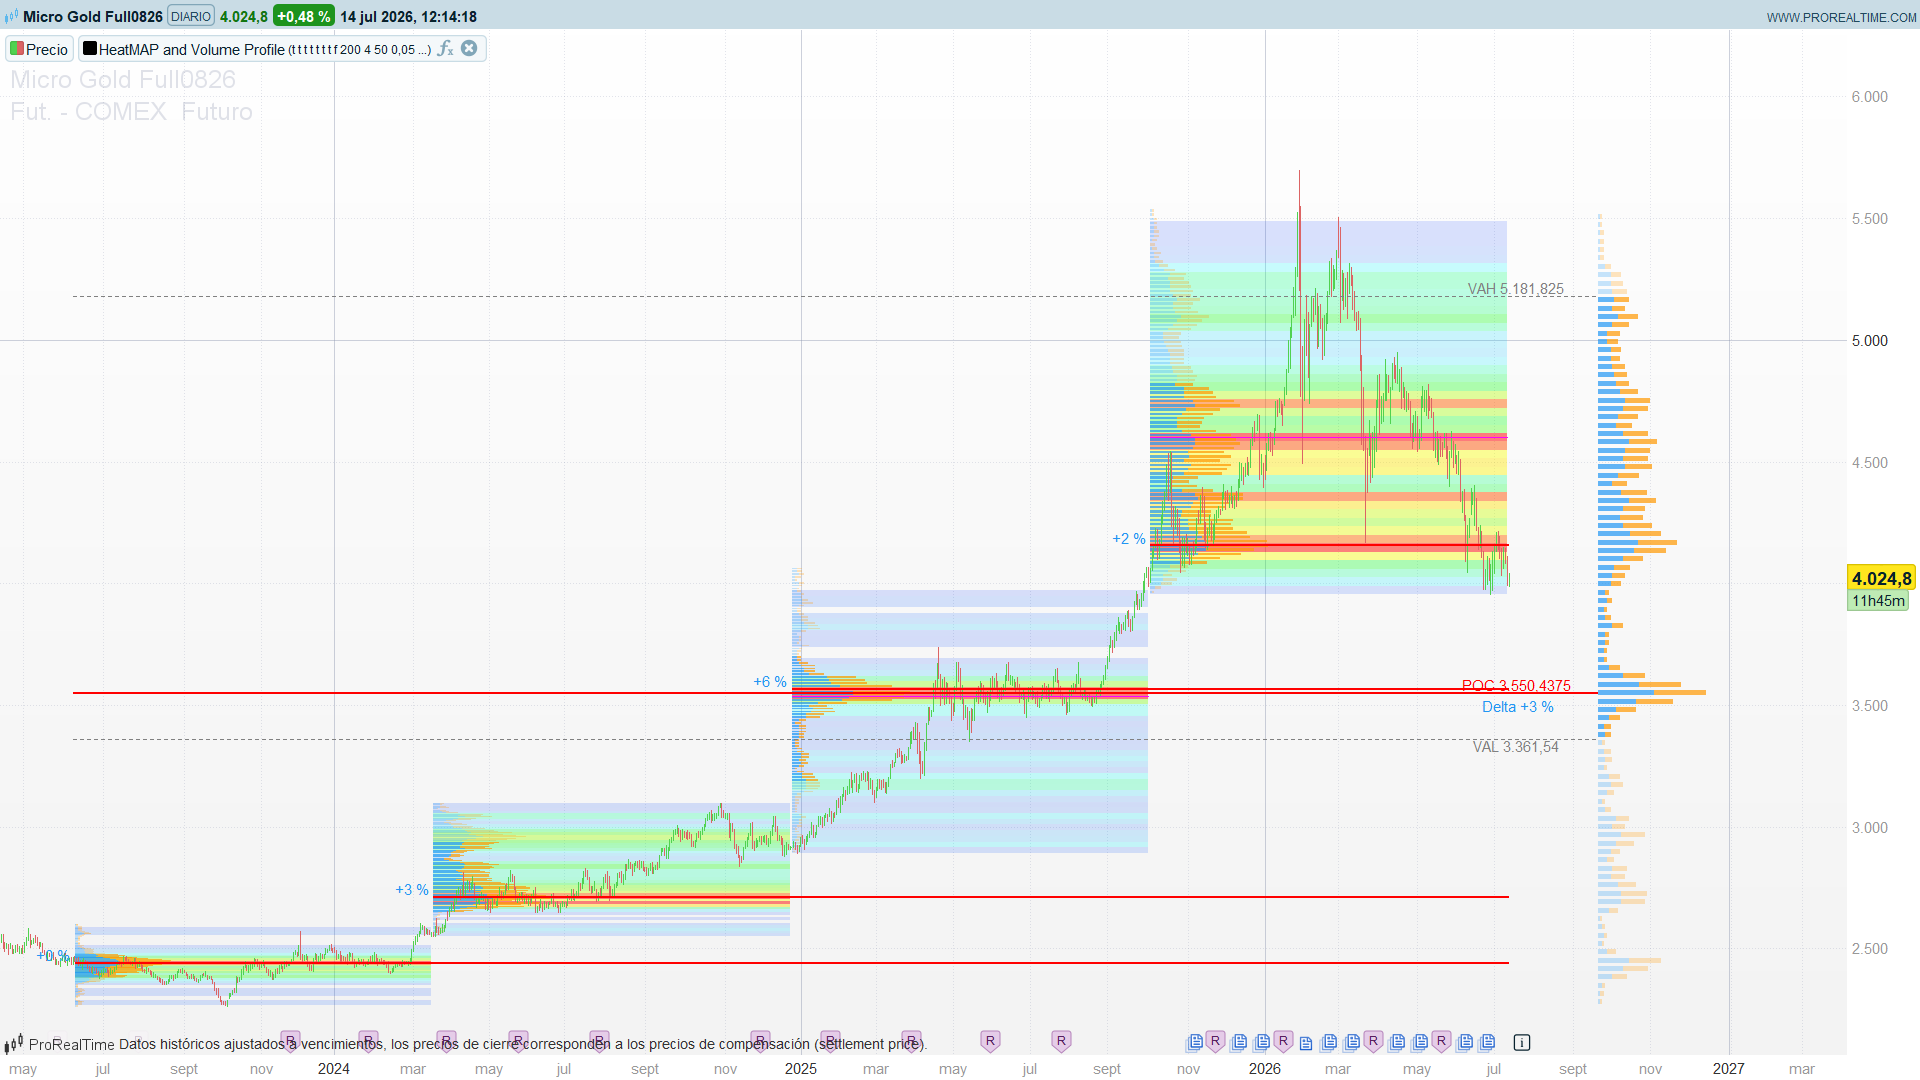
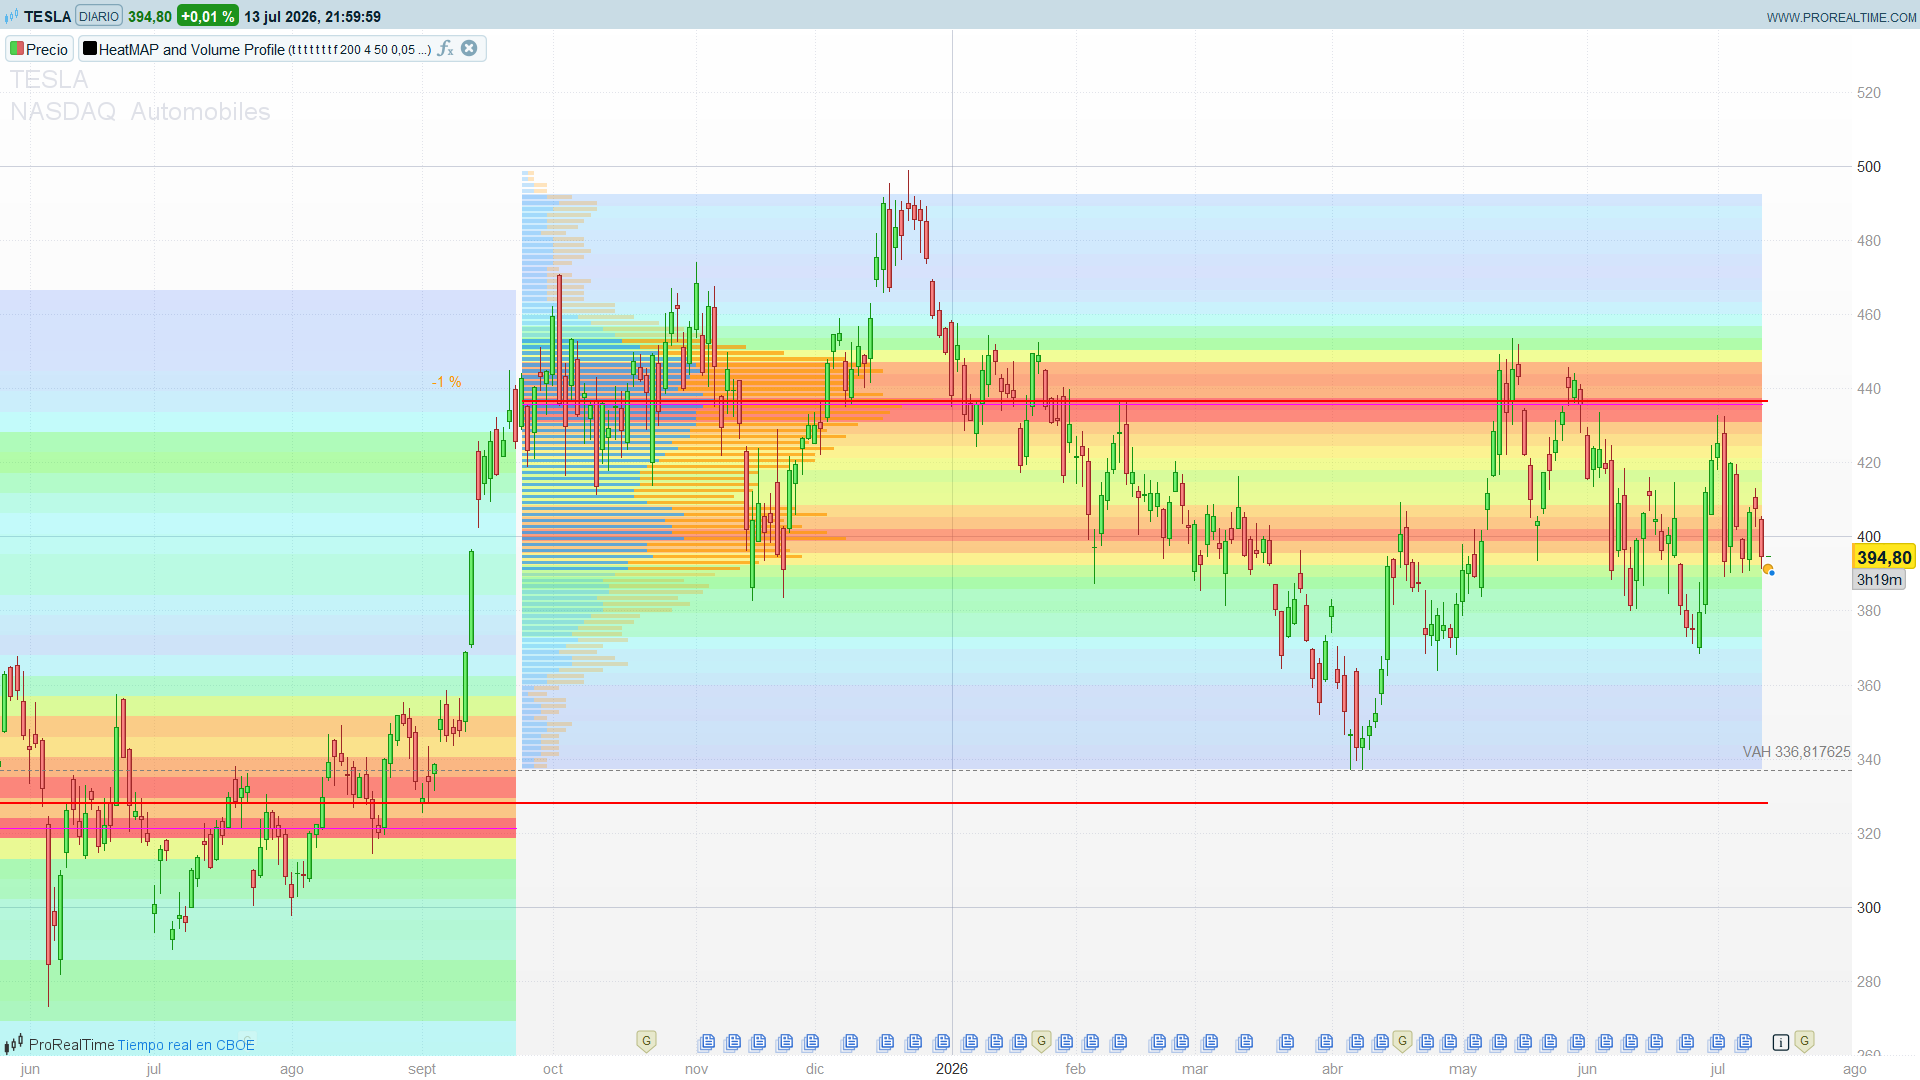
It divides each time block into a grid of levels and colors each one by how long price stayed there (thermal palette: cold blue = little, hot red = a lot). It doesn’t count isolated closes: it spreads each candle across its whole range. You instantly see the acceptance zones where price tends to stall and react.
- Reveals support/resistance you can’t spot by eye.
- Marks the level where price spent the most time (time POC).
- Works even on instruments without reliable volume (forex spot), because it measures time, not volume.
📊 Buyer / seller Volume Profile
A block volume profile done right: each candle’s volume is split between body and wicks and painted blue (buyers) and orange (sellers) per level. One glance tells you who’s in control at each zone.
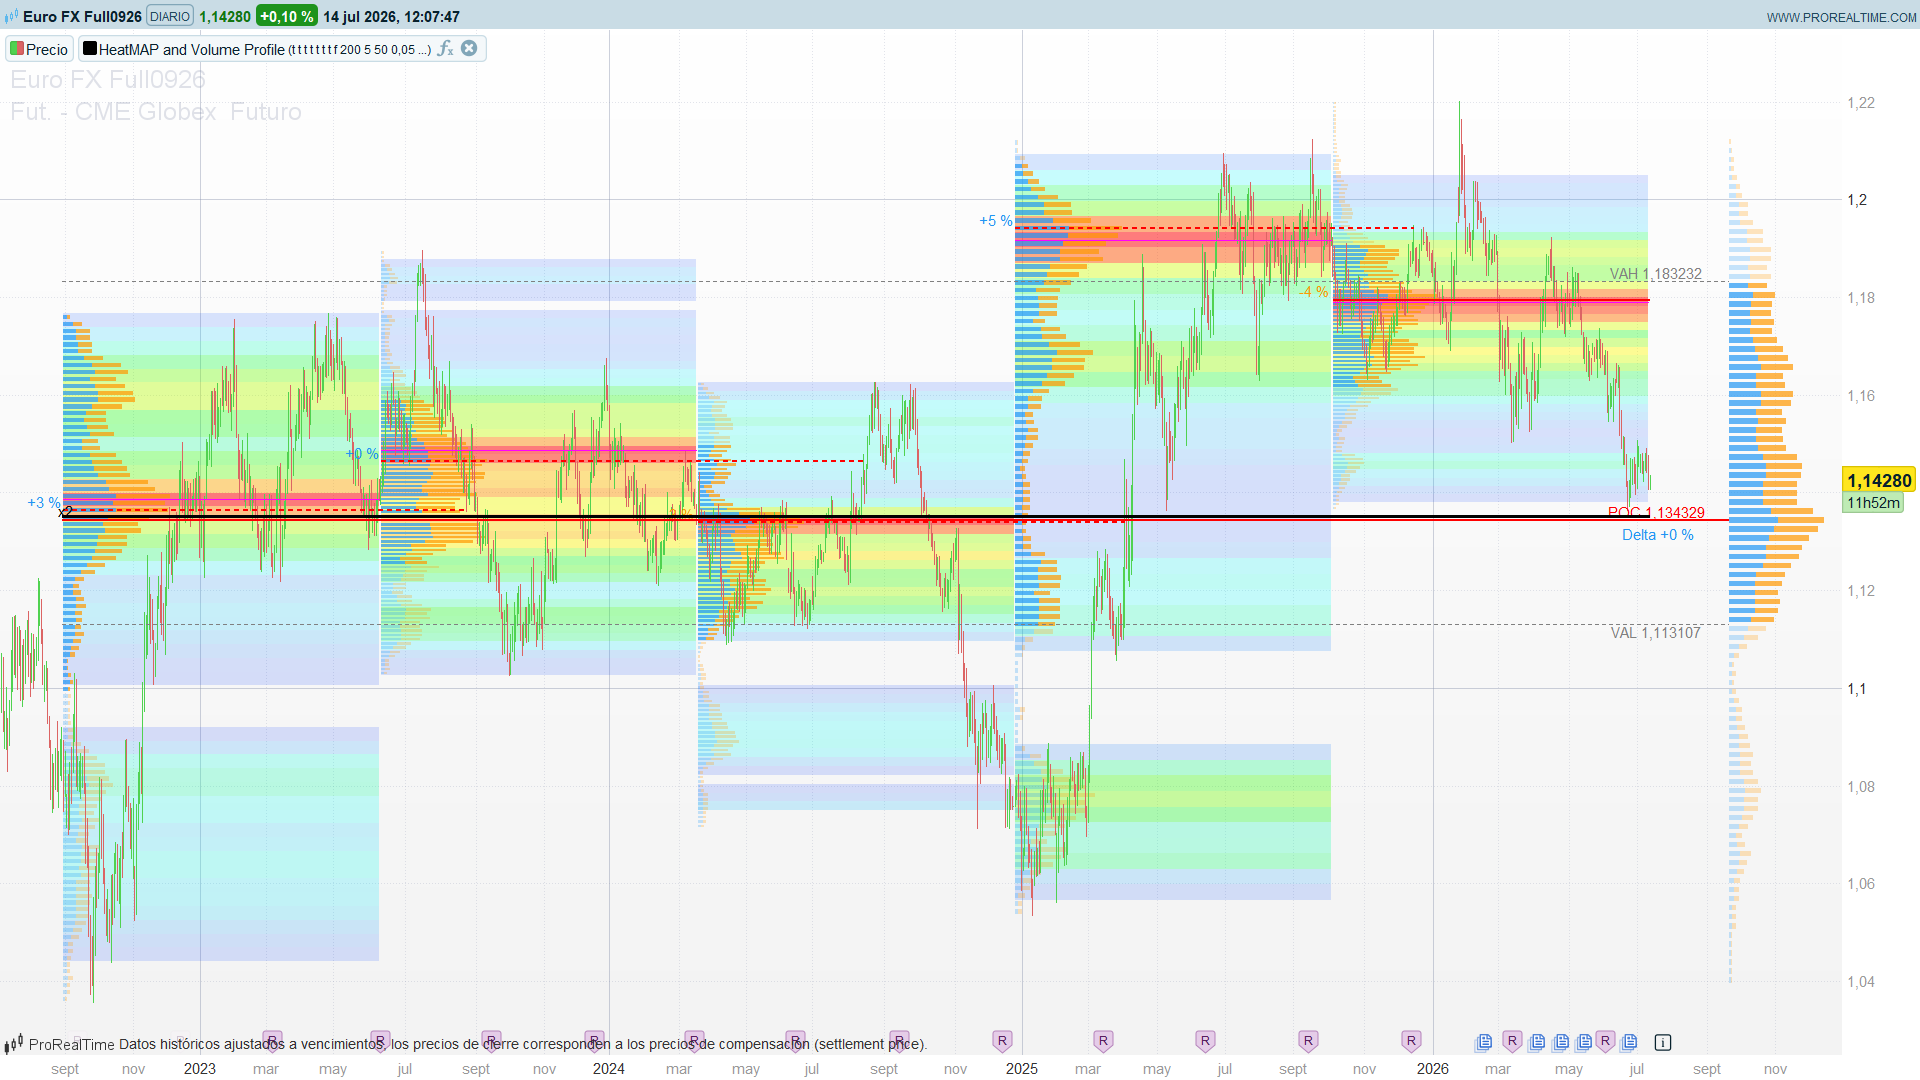
- Highlighted Value Area with POC, VAH and VAL.
- Delta bias label per block: accumulation (+%) or distribution (-%).
🎯 Level confluence
This is the gem. The indicator groups the POCs of all blocks and marks in bold black the levels where several coincide. Those are the real structural supports and resistances, not the noise of a single block. The ones to watch for entries and targets.
🧭 Order flow layer
- Naked POC: levels price hasn’t retested are drawn extended to today. Known price magnets.
- Time vs volume: when the most-time level and the most-volume level diverge, it’s flagging a climax or absorption.
- Global delta: the buyer/seller tone of the whole chart.
🌐 Global Volume Profile
A summary of all visible volume, drawn on the right with POC, VAH, VAL and global delta. Your context reference without stealing space from the candles.
✅ Compatible and ready to use
- ProRealTime v10. Any asset. Any timeframe.
- 15 panel settings: toggle each layer on/off to match how you trade.
- Quick 1-click install + step-by-step downloadable user guide.
It’s the context your chart is missing: where value sits, who defends it and which levels are still live. Try it for a day on your instrument and you won’t want to trade without it.
———————————————————————————————————-
🆕 Actualización mayor (v8): motor reconstruido de cero. Si ya tienes el indicador, esta versión es una actualización gratuita. El HeatMap ya no mide “frecuencia de toques”: ahora mide tiempo de permanencia real, y el Volume Profile ya no es un histograma plano: separa compradores y vendedores y marca la Value Area. Además llega toda una capa de order flow (confluencia, delta, naked POC).
🔥 HeatMap de permanencia
Divide cada bloque temporal en una rejilla de niveles y colorea cada uno según cuánto tiempo ha permanecido el precio ahí (paleta térmica: azul frío = poco, rojo caliente = mucho). No cuenta cierres sueltos: reparte cada vela por todo su rango. Así ves de un vistazo las zonas de aceptación donde el precio tiende a frenar y reaccionar.
- Detecta soportes y resistencias que a ojo no ves.
- Marca el nivel donde el precio pasó más tiempo (POC de permanencia).
- Funciona incluso en instrumentos sin volumen fiable (forex spot), porque mide tiempo, no volumen.
📊 Volume Profile comprador / vendedor
El perfil de volumen por bloque, pero de verdad: el volumen de cada vela se reparte entre cuerpo y mechas, y se pinta azul (comprador) y naranja (vendedor) por nivel. De un vistazo sabes quién manda en cada zona.
- Value Area resaltada, con POC, VAH y VAL.
- Etiqueta de sesgo delta por bloque: si fue de acumulación (+%) o distribución (-%).
🎯 Confluencia de niveles
Aquí está la joya. El indicador agrupa los POC de todos los bloques y te marca en negro grueso los niveles donde coinciden varios. Esos son los soportes y resistencias estructurales de verdad, no el ruido de un bloque suelto. Los que quieres vigilar para entradas y objetivos.
🧭 Capa de order flow
- Naked POC: los niveles que el precio no ha vuelto a testear se dibujan extendidos hasta hoy. Son imanes de precio conocidos.
- Permanencia vs volumen: cuando el nivel de más tiempo y el de más volumen divergen, te está avisando de un clímax o una absorción.
- Delta global: el tono comprador/vendedor de todo el gráfico.
🌐 Volume Profile global
Un resumen de todo el volumen visible, dibujado a la derecha con POC, VAH, VAL y el delta global. Tu referencia de contexto sin quitar espacio a las velas.
✅ Compatible y listo para usar
- ProRealTime v10. Cualquier activo. Cualquier temporalidad.
- 15 ajustes en el panel: enciende y apaga cada capa según cómo operes.
- Instalación rápida (1 clic) + guía de uso descargable paso a paso.
Es el contexto que le falta a tu gráfico: dónde está el valor, quién lo defiende y qué niveles siguen vivos. Pruébalo un día en tu activo y no querrás operar sin él.
Avis
Il n’y a pas encore d’avis.