

The TDI indicator (traders dynamic index) is a technical analysis indicator used for trading.
This is a very interesting combination of RSI and Bollinger Bands. It could be said that it is a 3 in 1 indicator since it provides information on the trend, strength and volatility of the price.
The TDI indicator (traders dynamic index)
The TDI indicator, also known as the Traders Dynamic Index, is a trading indicator developed by Dean Malone in 2006.
It combines various indicators to provide information on trend direction, momentum, and market volatility in a single dashboard.
Definition and operation of the TDI indicator
The TDI indicator is based on the use of the RSI (Relative Strength Index) and Bollinger Bands.
The RSI is used to determine the strength of the current trend, while the Bollinger Bands estimate the amplitude of the market’s oscillations. By combining these two indicators, the TDI provides a complete picture of the trend and volatility of the market.
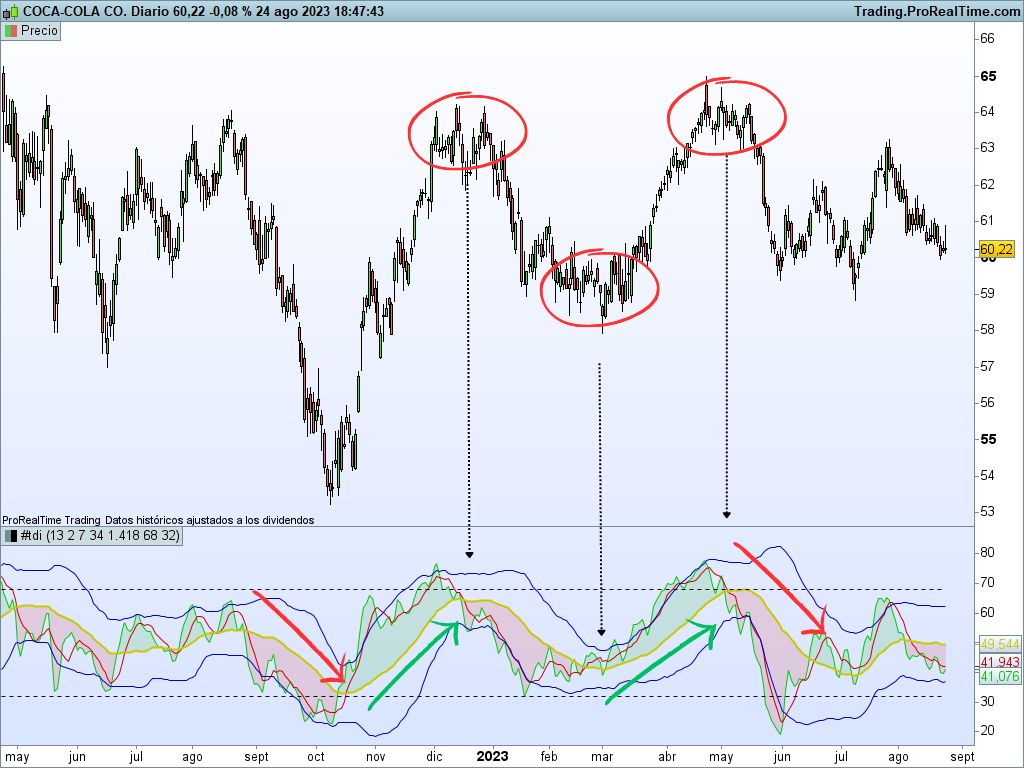
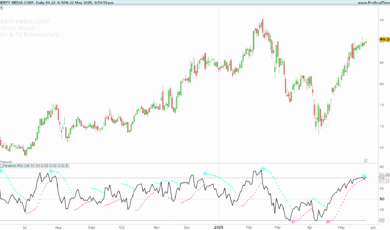
The TDI indicator uses three moving averages of the RSI to show the direction of the current trend.
The green line represents the fast moving average of the RSI (2 periods), while the red line is the slow moving average of the RSI (7 periods). Finally we have the yellow line which is the slowest moving average of the RSI (34 periods).
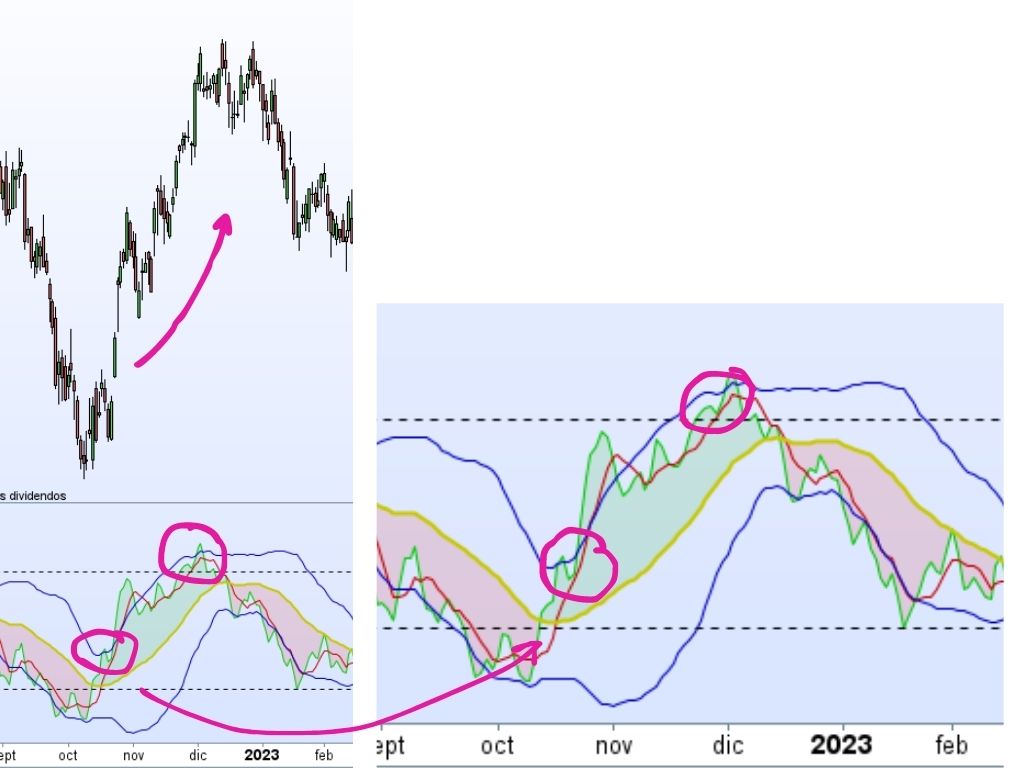
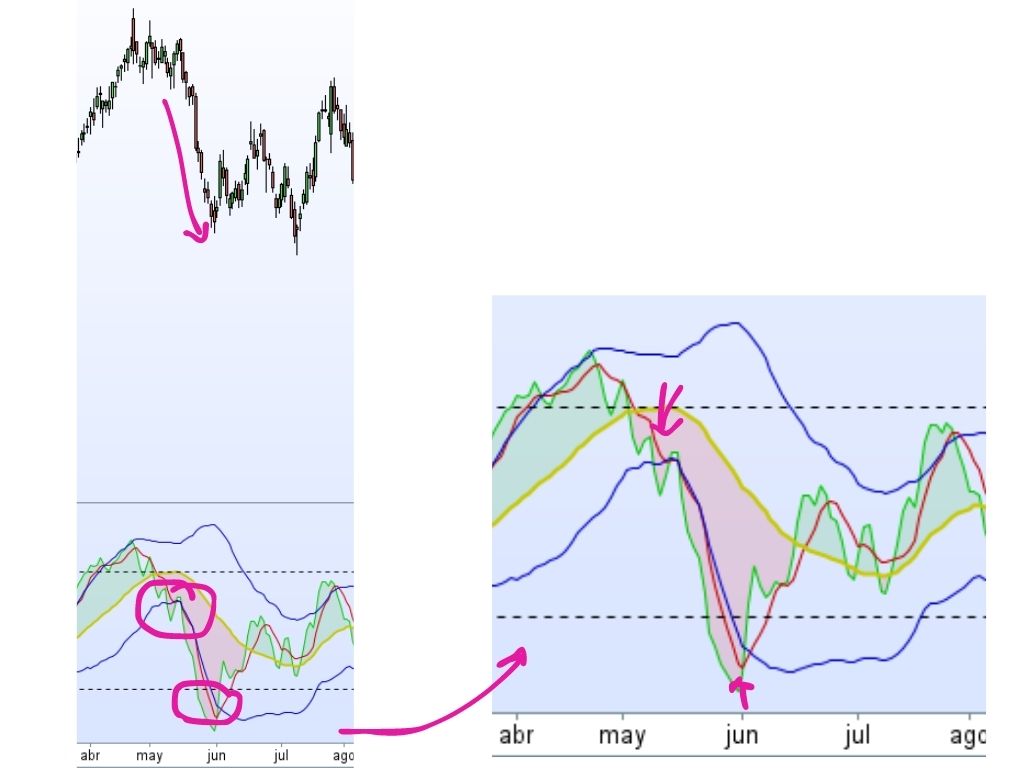
The slowest moving average is used as a detector of the main trend and depending on the position of other moving averages, bullish or bearish positions will be opened.
When the 2 and 7 period averages are above the 34 period average then we are in an uptrend. Otherwise we would be facing a downtrend.
Using Bollinger Bands in conjunction with the TDI
The RSI volatility bands (blue lines) on the TDI indicator show market volatility.
When the blue lines are close to the upper band, it indicates high volatility, while when they are close to the lower band, it indicates low volatility. These bands help identify moments of possible trend reversal or market consolidation.
Advantages and applications of the TDI indicator
The TDI indicator is a powerful tool to determine the direction of the trend in the market. Thanks to the moving averages of the RSI, we can identify if we are in a bullish or bearish market.
This allows us to make informed decisions about our operations and adapt to market conditions.
Assessing momentum and volatility with the TDI
Another advantage of the TDI indicator is that it provides us with information about the momentum and volatility of the market.
The blue lines, which represent the volatility bands of the RSI, indicate the amplitude of the oscillations in the market. This helps us assess the strength of trends and determine if the market is in a state of high or low volatility.
Use of TDI in trading strategies and system design
The TDI indicator is a versatile tool that can be used in various trading strategies and system design.
Thanks to the information provided on the direction of the trend, momentum and volatility, we can design solid strategies and make decisions based on concrete data.
In addition, TDI can help us detect potential entry and exit points in the market, improve our risk management tactics, and maximize profits in our trades.
In conclusion, the TDI indicator offers significant benefits for traders in the financial market. It allows us to identify the direction of the trend, assess momentum and volatility, and use this information in effective trading strategies.
Avis
Il n’y a pas encore d’avis.