

Indicator Summary:
Every trader probably have their preferred way of looking at price data. Some like typical Japanese candles, while others prefer something more filtered like Heikin-Ashi or Renko. But at the end of the day we all simply want to see price action in the clearest possible way.
For this reason I have studied multiple different price styles and carefully considered the pros and cons of each. I have also drawn from my own experience as a price action based trader who have personally always preferred Japanese candles for their glimpse into how price developed over the specified period. There is a reason that the art of interpreting different Japanese candlestick patterns became a specific subset and discipline of technical analysis itself.
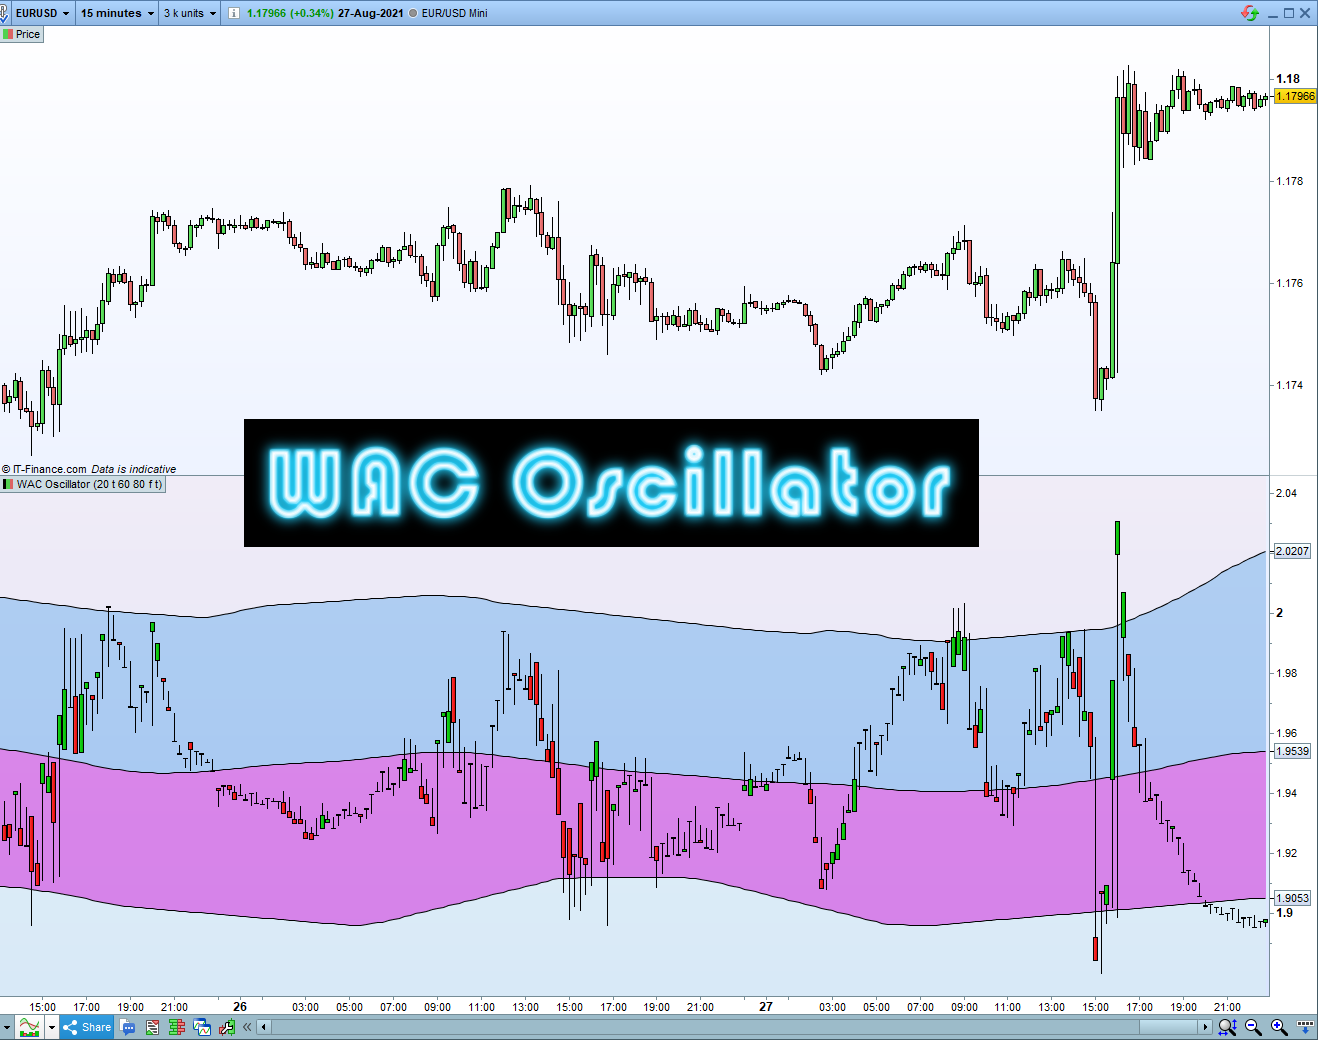
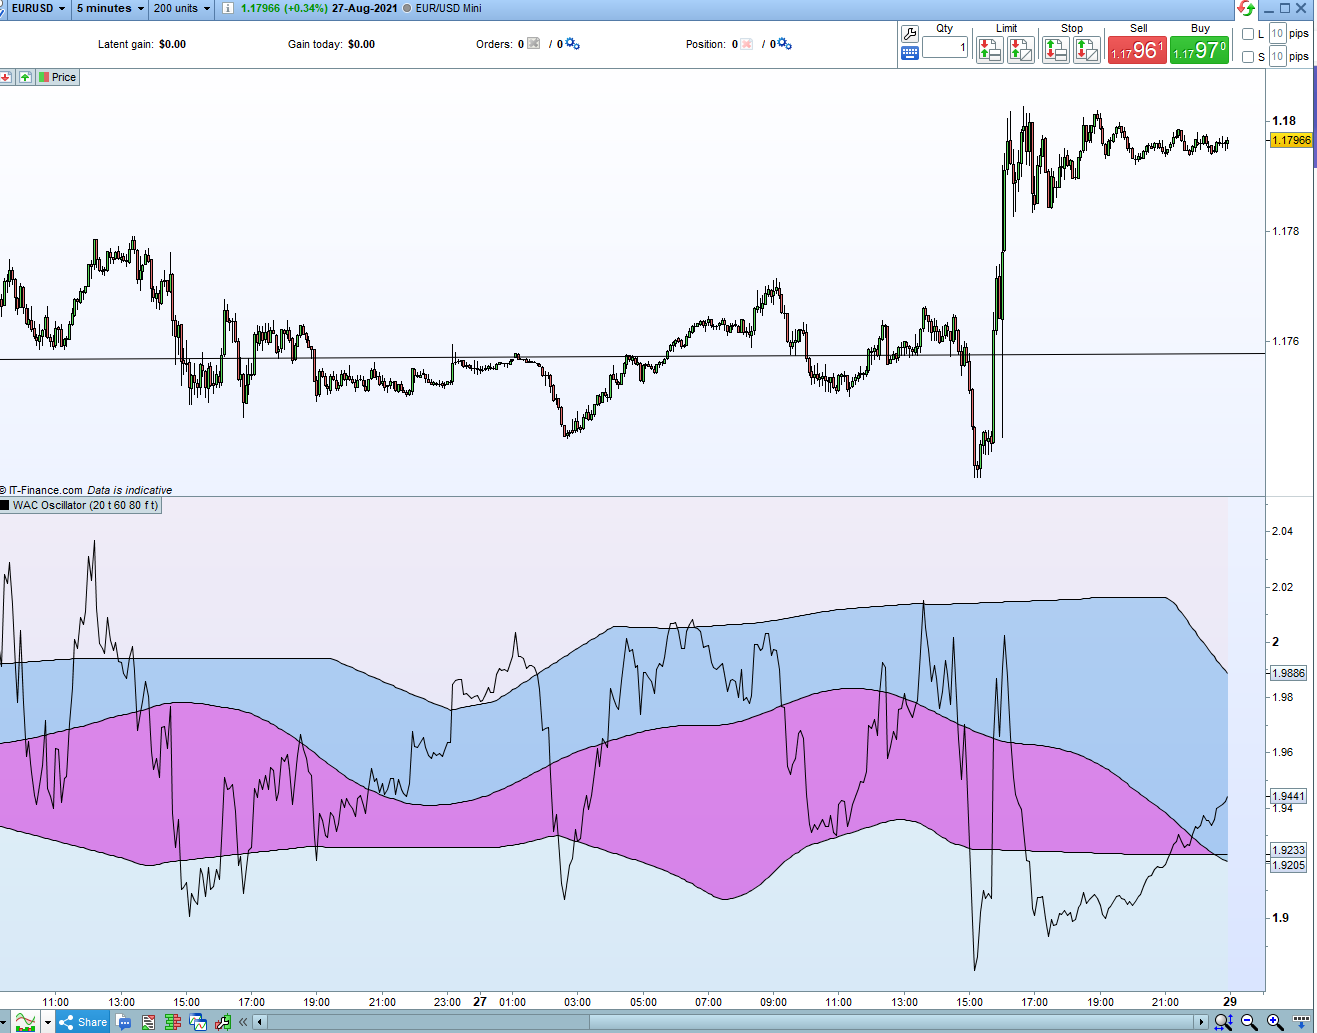
Now this indicator was conceptualized from this very idea of using the data encapsulated in price action behavior over a specified period of time to hint at what price might be telling us. And what simply started as a new price style soon developed into the Weighted Averaged Candles Oscillator or WACO for short.
To my knowledge this is the first oscillator to include actual candles to better represent price momentum and behavior at different stages of oscillation. Each candle is also unique in that although it is based on the actual price data, it is drawn and colored in such a way as to filter out all the noise and only show what is actually going on.
The indicator also comes with the option of enabling and including volume to its calculations for those instruments who does include it. And for those who prefer to keep things simpler, you can also disable the candles and only use the average closing price itself.
How to apply:
Add as a separate indicator and use in split screen mode to standard price indicator. For best results it is recommended to adjust the CalcPeriod and CalPeriod2 settings to best fit the historic market structure of each instrument and timeframe you trade.
Indicator settings:
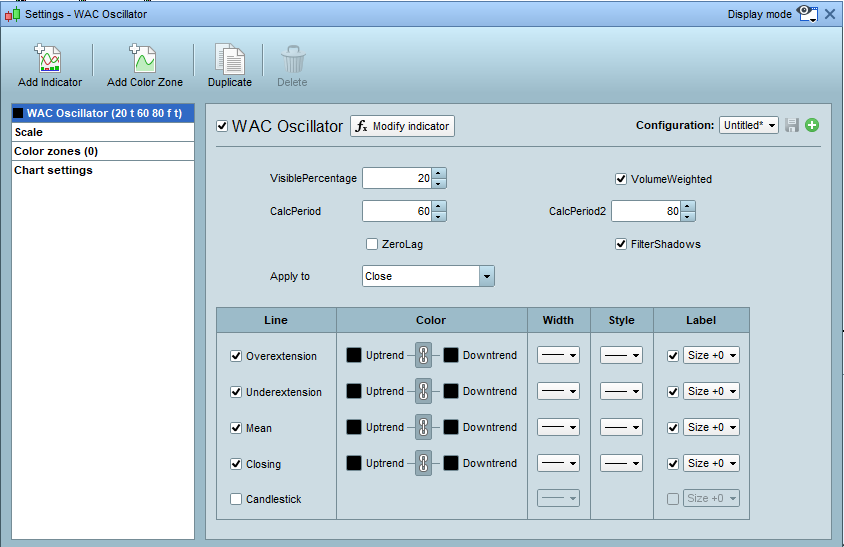
VisiblePercentage* adjusts the weight of the candle body (Default: 20%)
VolumeWeighted* includes or excludes price volume data in the candle body weight calculation.
CalcPeriod determines the lookback period for historic volatility. (Default: 60)
CalcPeriod2 adjusts the amplitude and works together with CalcPeriod (Default: 80)
ZeroLag allows some calculations to be made with ZeroLag data in instances where this makes sense. Disable if oscillator looks strange.
FilterShadows* only show shadows on one side of the candle depending on where most price rejection occurs
*Visible Percentage, Volume Weighted and Filter Shadows is only applicable when Candlesticks are selected.
*To disable candles and only see the weighted closing line: Tick ‘Closing‘ and untick ‘Candlestick‘
Popular Configuration Settings:
CalcPeriod: 60 (Forex) | 50 (Lower Timeframes <1H) | 20 (Higher Timeframes >1H)
CalcPeriod2: 80 (Forex) | 20 (Lower Timeframes <1H) | 150 (Higher Timeframes >1H)
ZeroLag: Enabled (Forex) | Disabled (Non-Forex)
How to interpret signals:
- Shadows indicate rejection – change in shadow direction indicated possible trend direction change.
- Bodyweight indicate price relevance, bigger means more relevant.
- Candle colors shows primary direction of price moves. Green is bullish and red is bearish.
- Price above the over extension line or below the under extension line tends to mean revert upon crossing back into the ‘bands’ (i.e. look for crossovers).
- Price tends to pivot around and mean revert to the center ‘mean‘ line.
This indicator works really well with my RSI PoweSignal v3 to help you really fine tune those entries and exits.
All indicators includes free access to my Ultimate and Complete Course on High-Probability Trading (follow link for course content). You will find the link to the course content in the purchase note upon completion of payment.
About me:
I am a professional ProRealTime developer with 4+ years experience in creating and coding ProRealTime strategies.
You can view my PRC profile here: https://www.prorealcode.com/user/juanj/

Reviews
There are no reviews yet.