


Tech Channel indicator
Tech Channel indicator for ProRealTime Plot on the graph the following functions:
- Channel
- Multy Channel
- Recognition of graphic Pattern
- Retracement
- I-Volume
- HeatMap
- Channel Temporal and spatial data
- Fibonacci Retracemnts
It can be used for the following time intervals
- Daily
- hours
- minutes
- Second
- Ticks
It cannot be used in the following time intervals
- Weekly
- Monthly
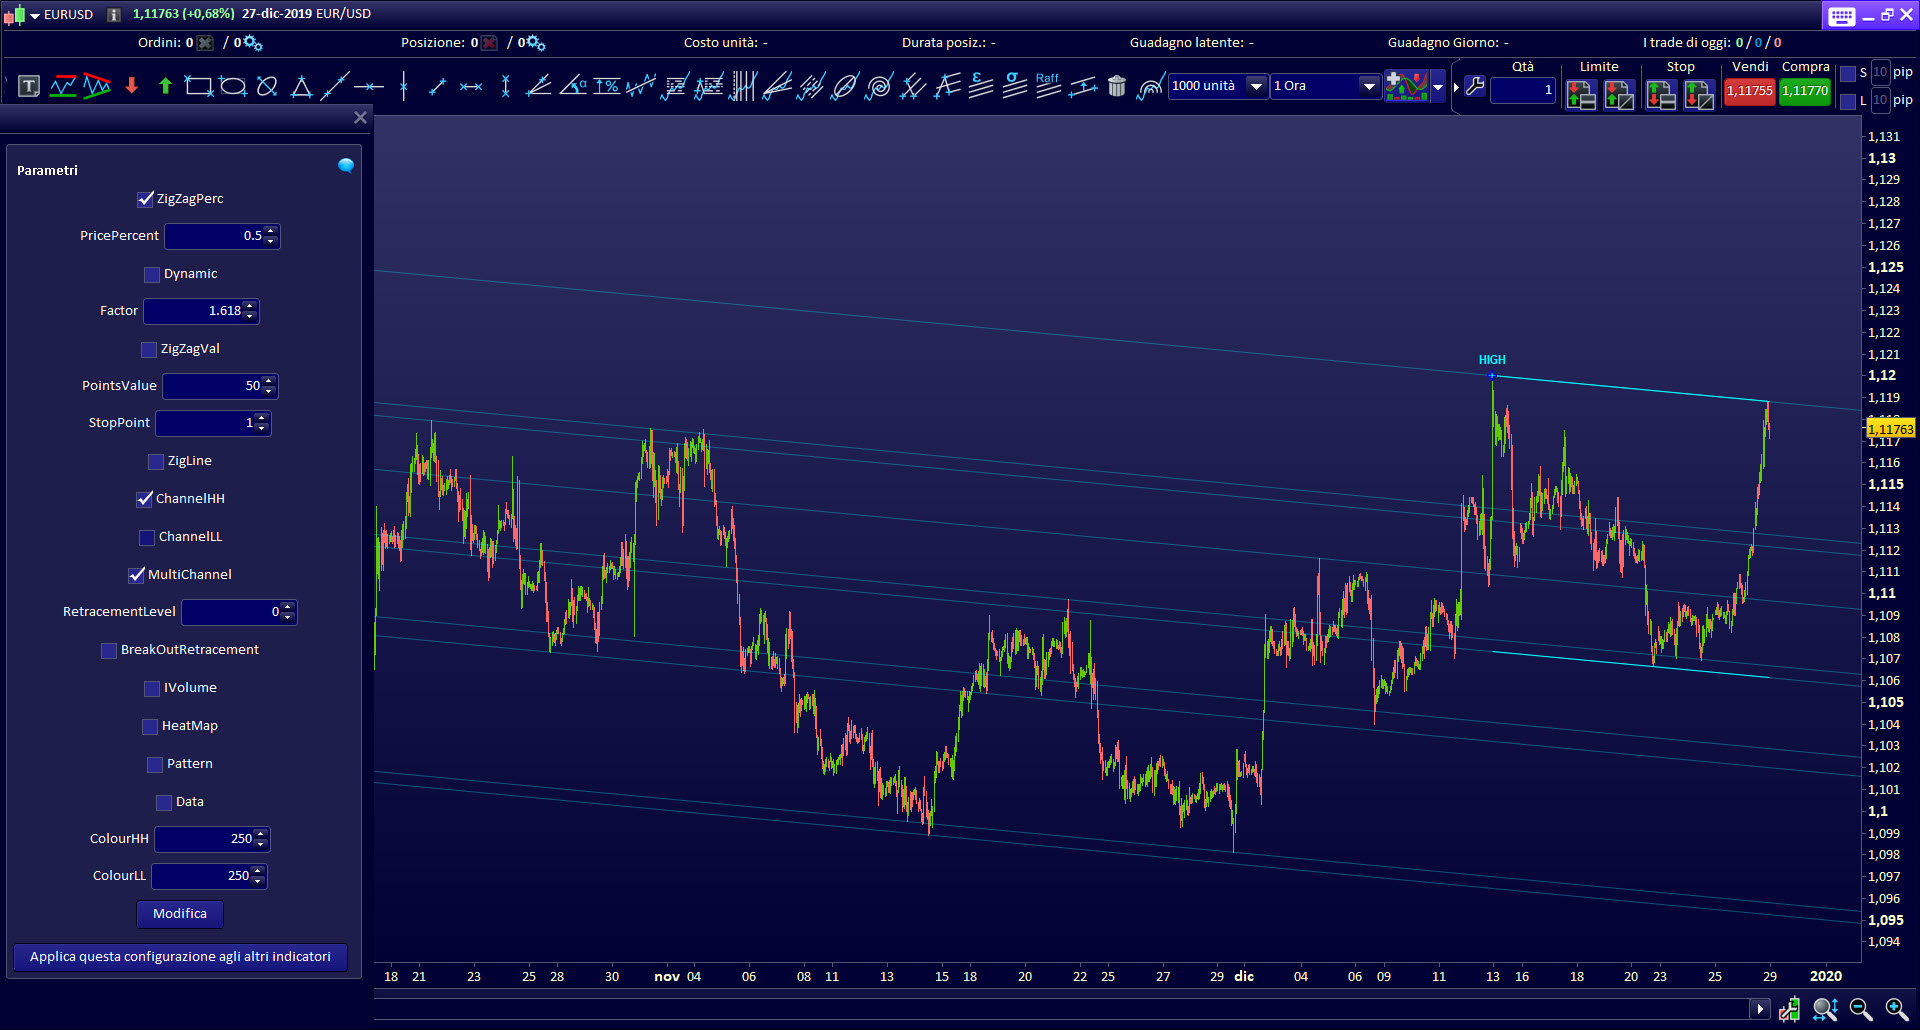
CHANNELS
In Technical Analysis, with the word Channel we mean, a graphic formation delimited by 2 parallel trendlines in which the prices move.
A channel will be traced creating a parallel to a trend line, identifying inclined levels that will act as support and resistance.
This software is designed to find any channel automatically.
HOW THE CHANNEL FUNCTION WORKS:
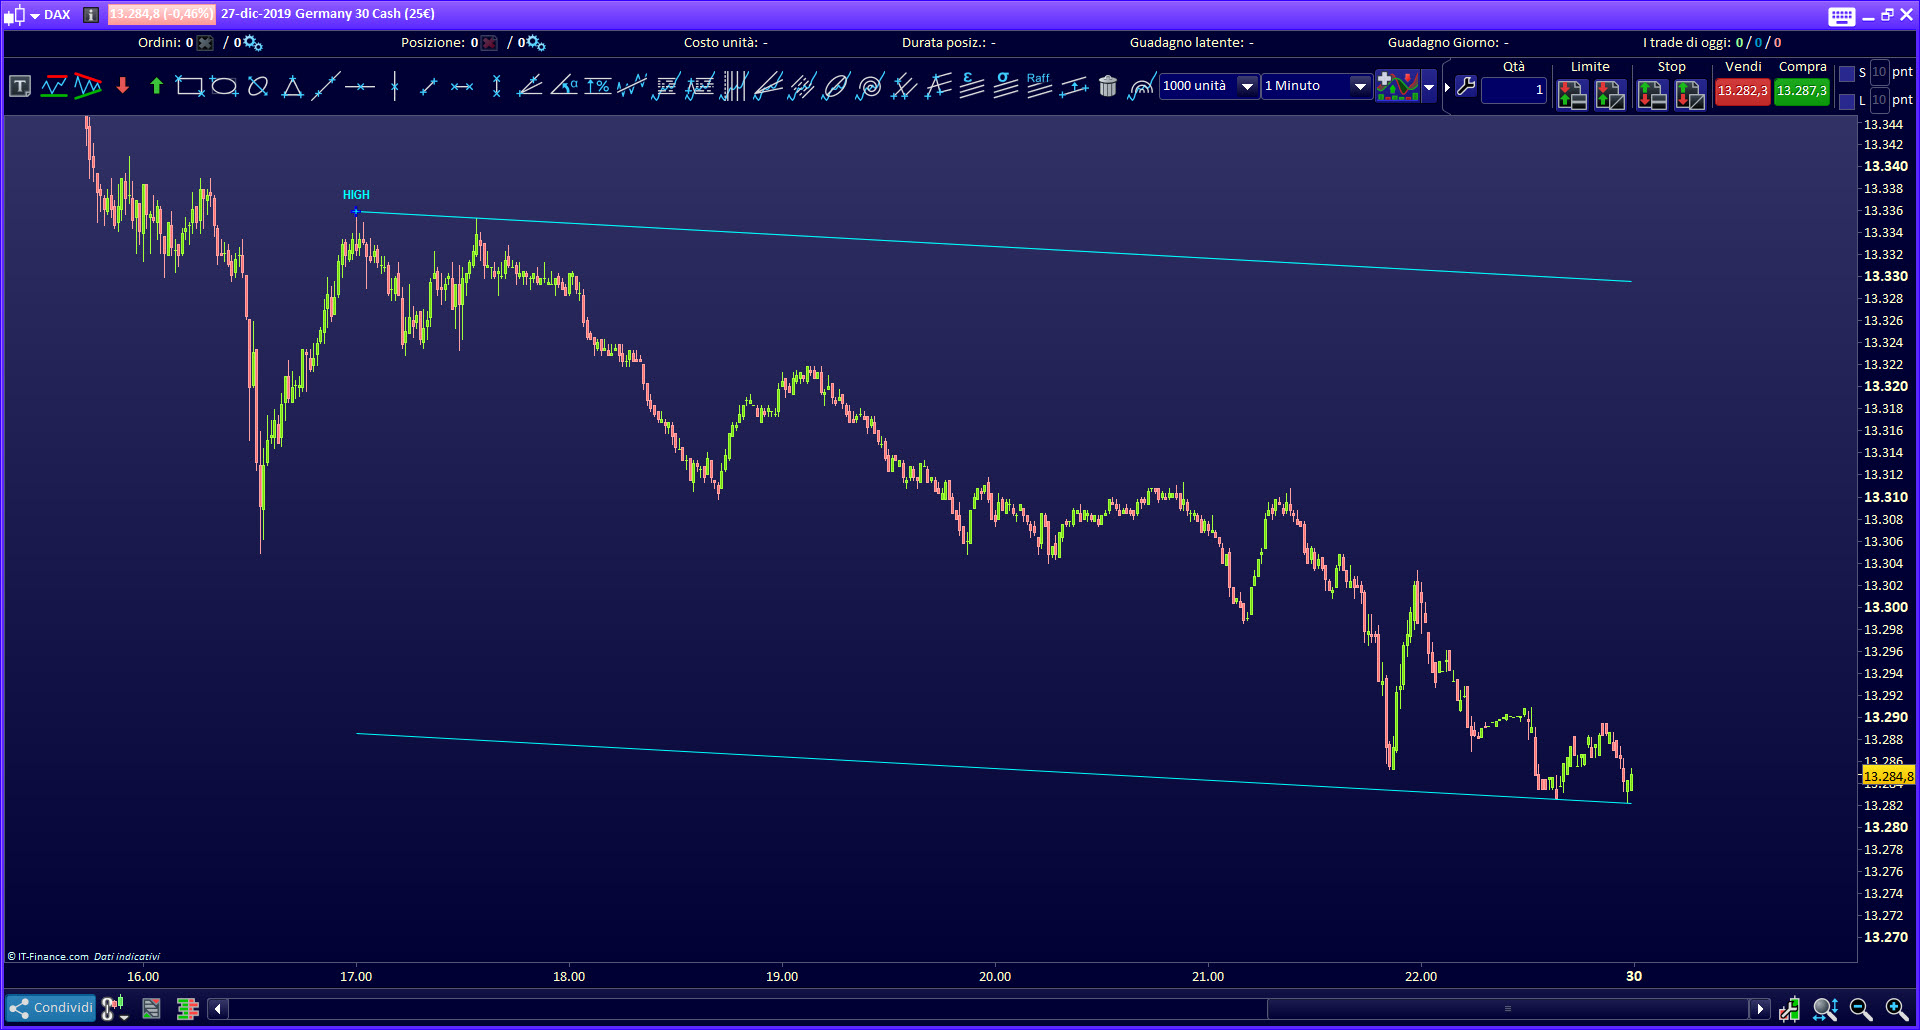
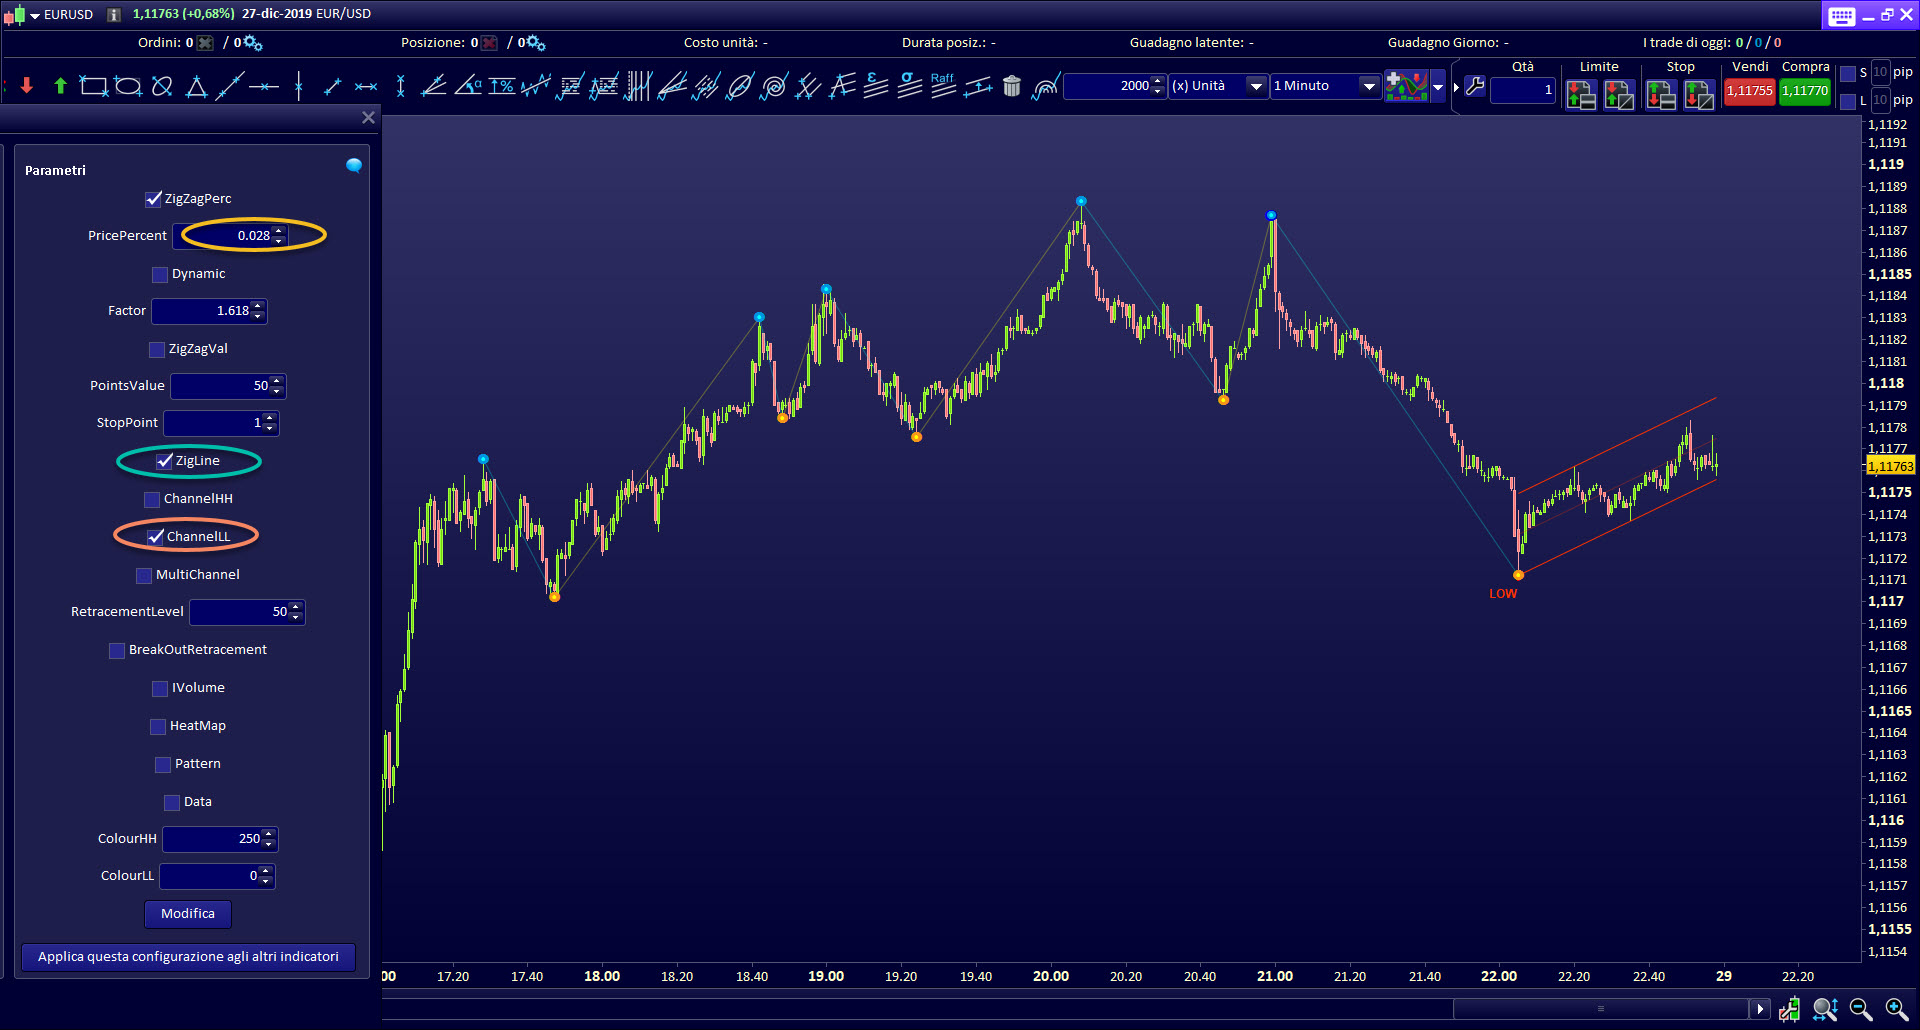
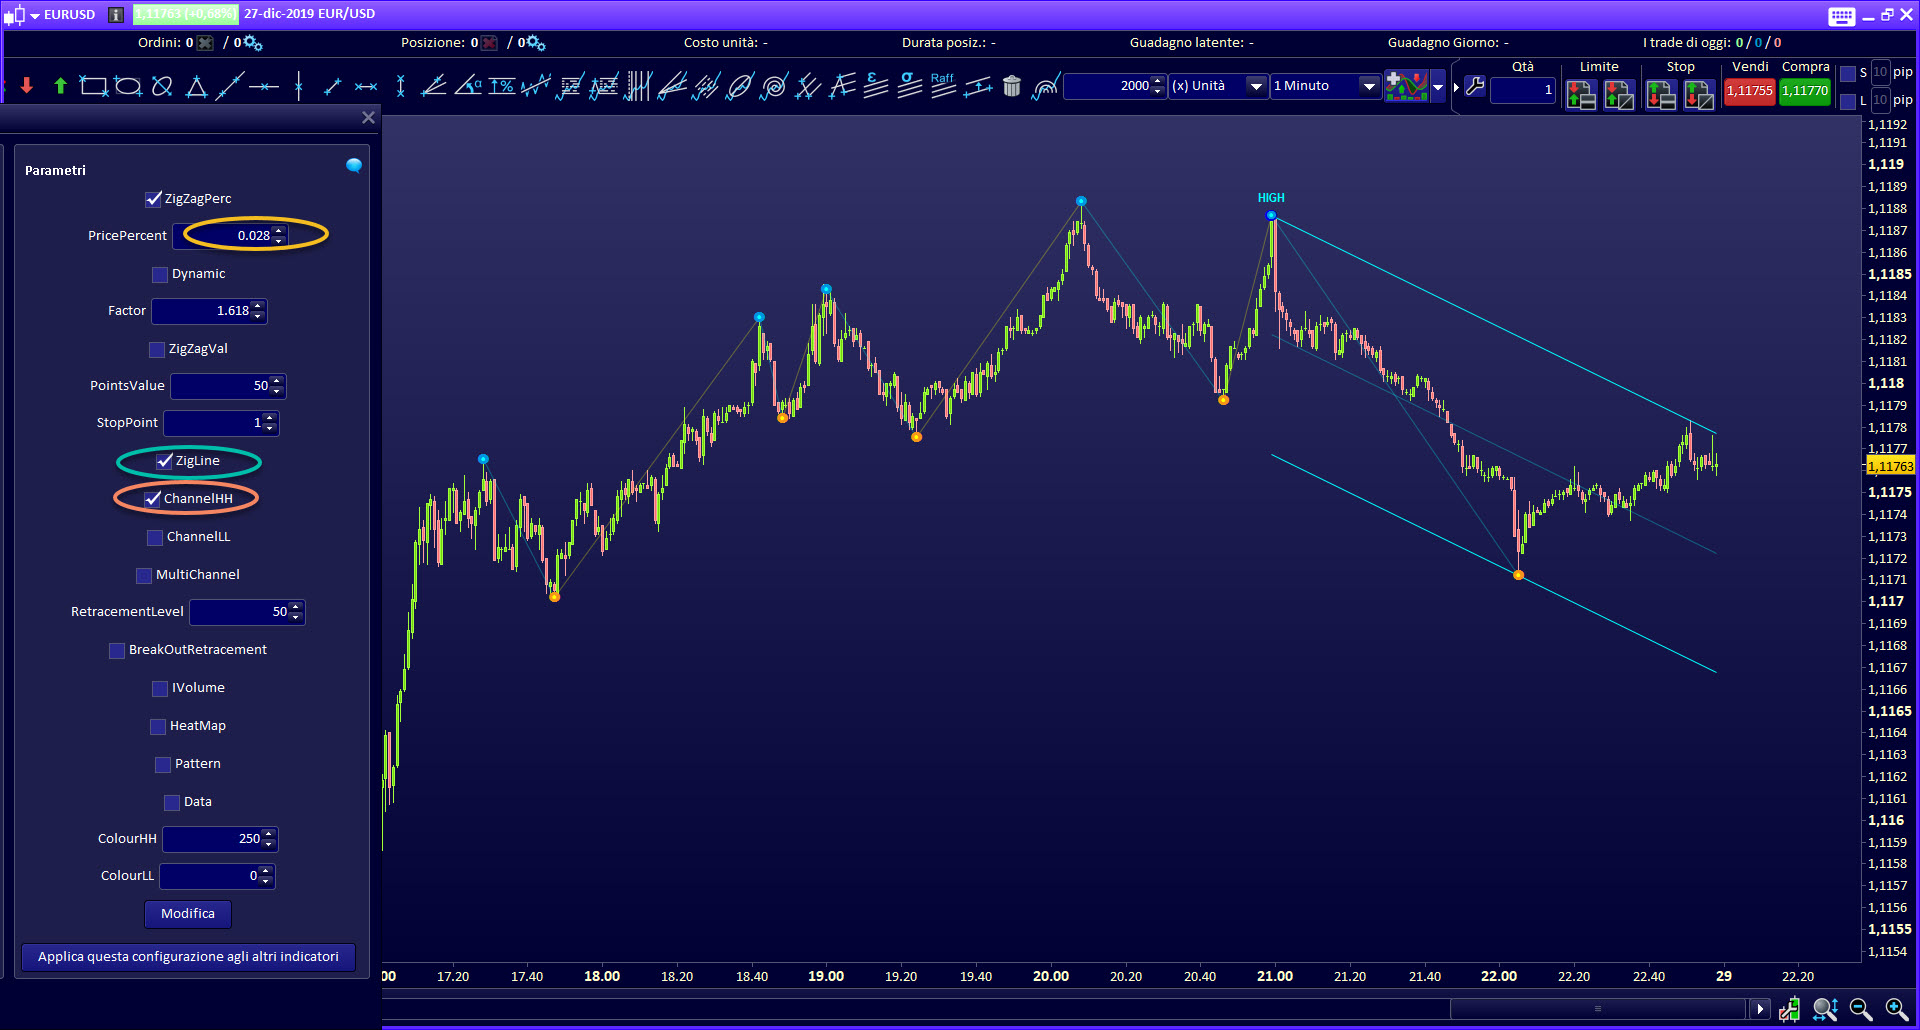
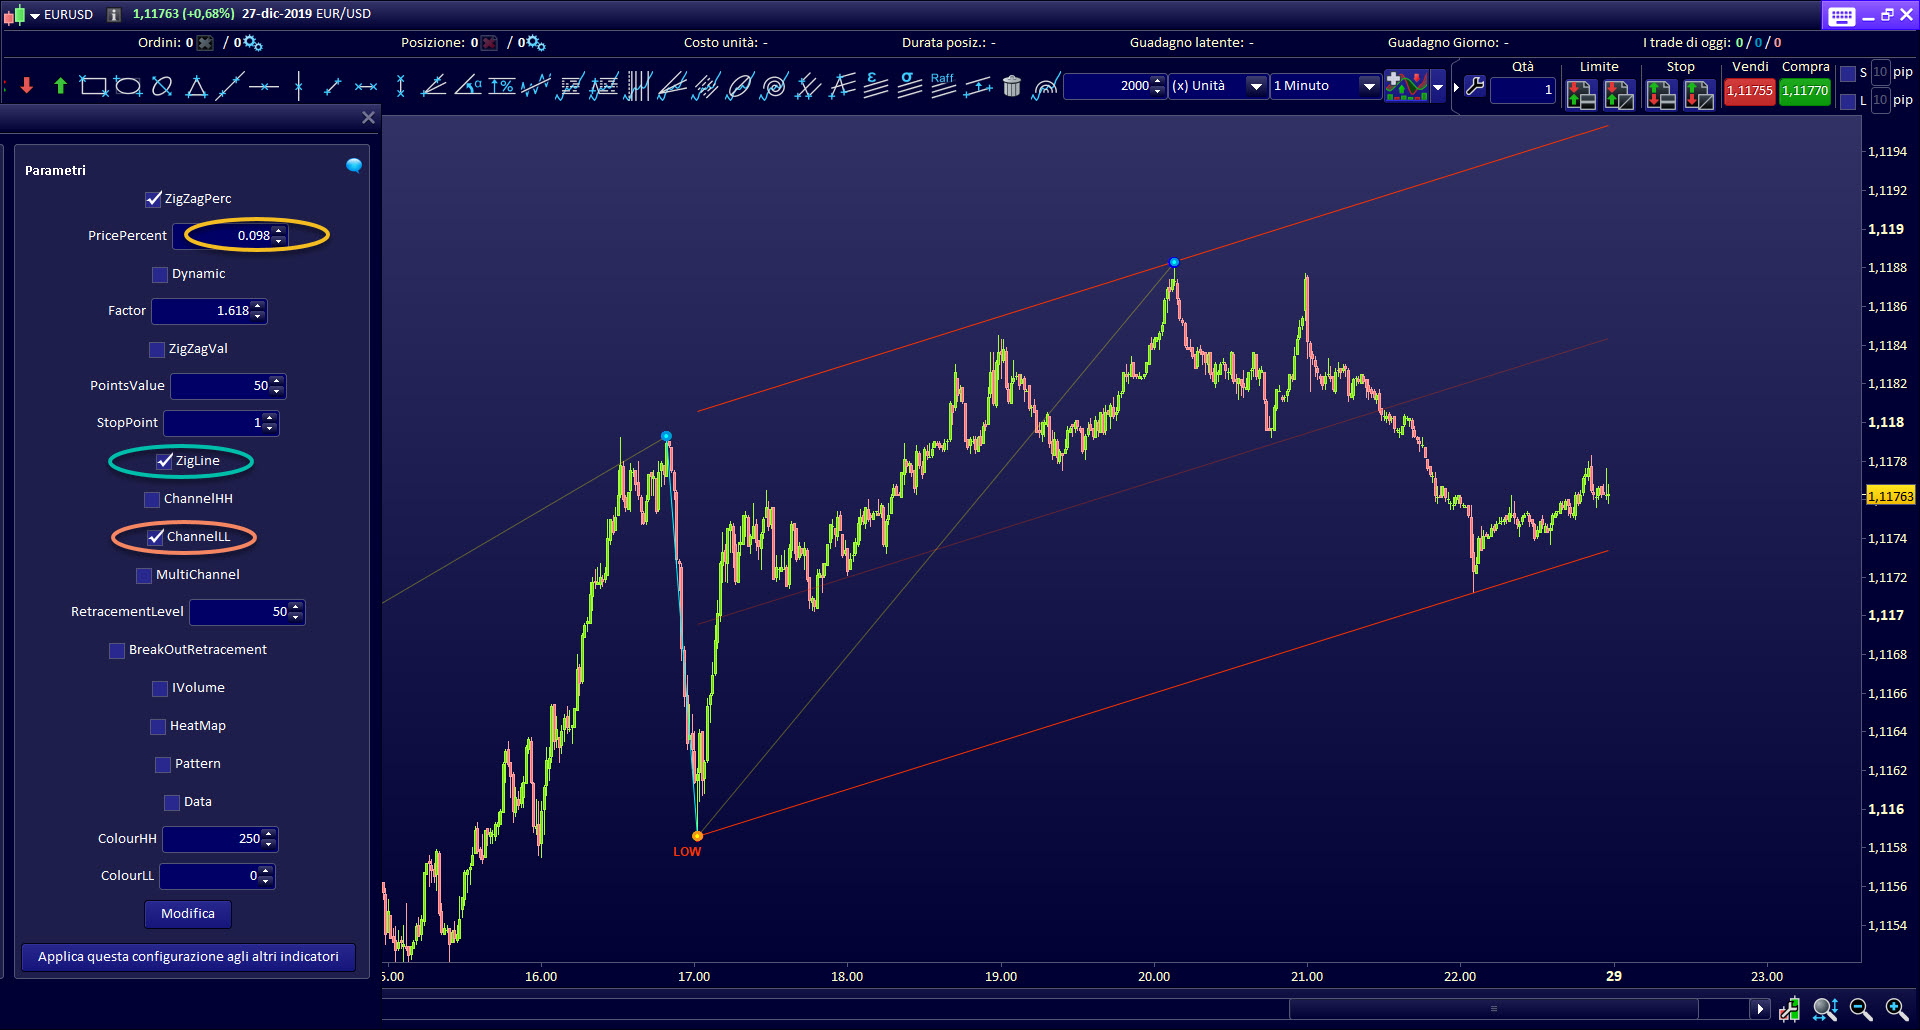
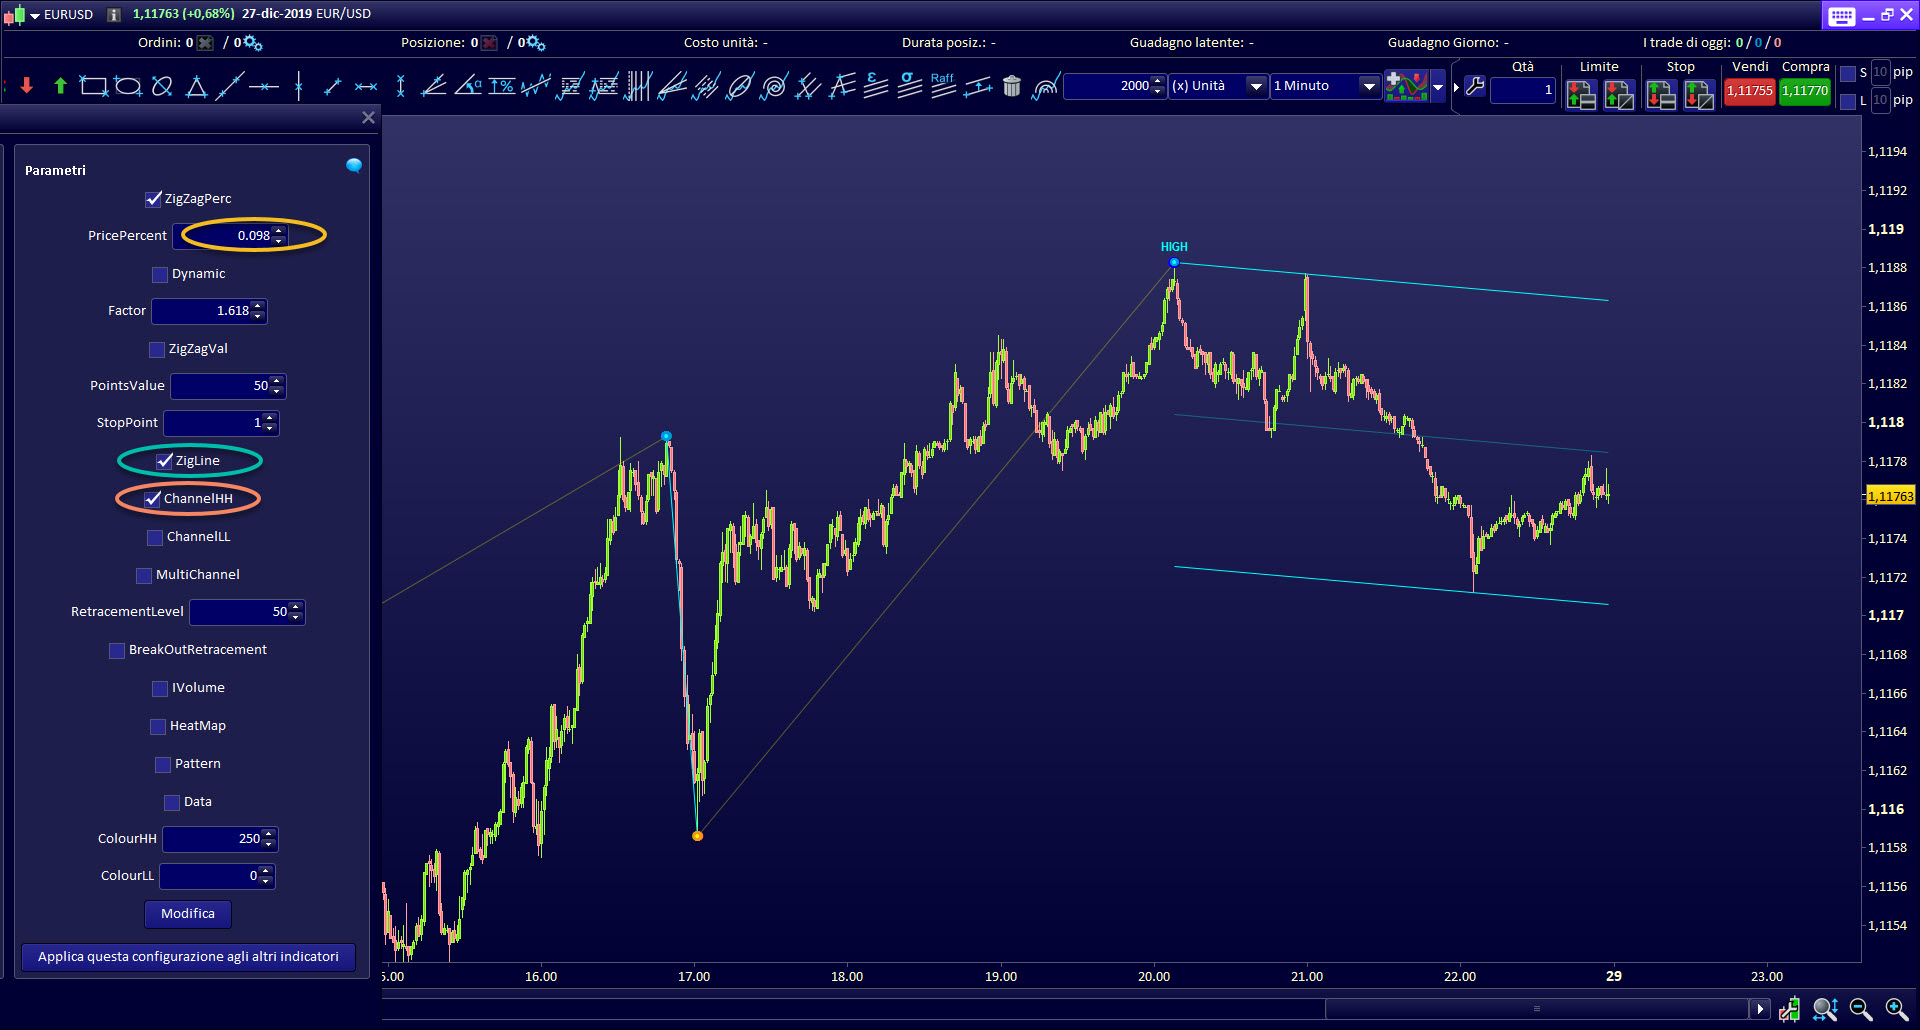
This indicator plots 2 parallel trendlines segments automatically on the graph. To set the size of the channel, you can use the zigzag function, contained in the indicator.
ZIGLINE: it is the most important variable to set the Tech Channel indicator
The Zig Zag indicator incorporated in the Tech Channel indicator.
The points of the Zig Zag indicator are used to find the maximum and minimum points of the channel, so the channel size, depends by the wave size of the Zig Zag.
The Zig Zag indicator can be displayed by activating the ZigLine variable, to speed up the setting operation.
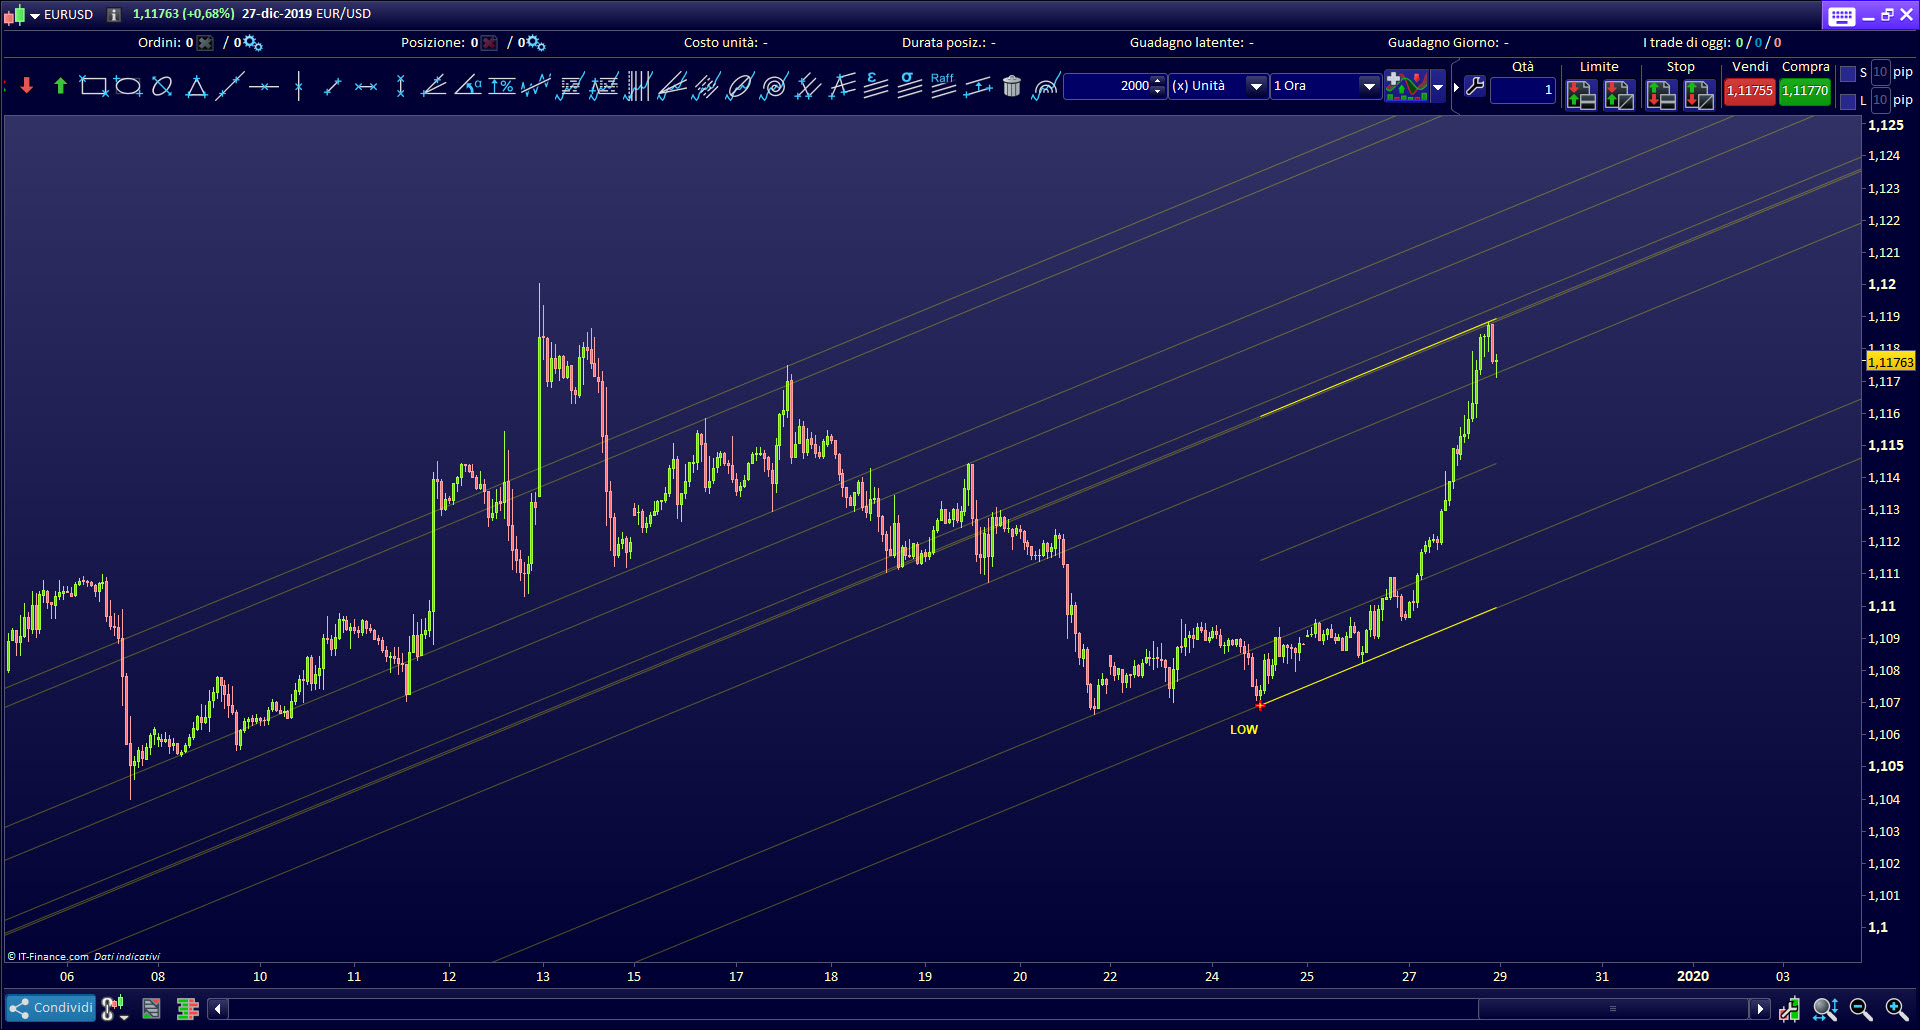
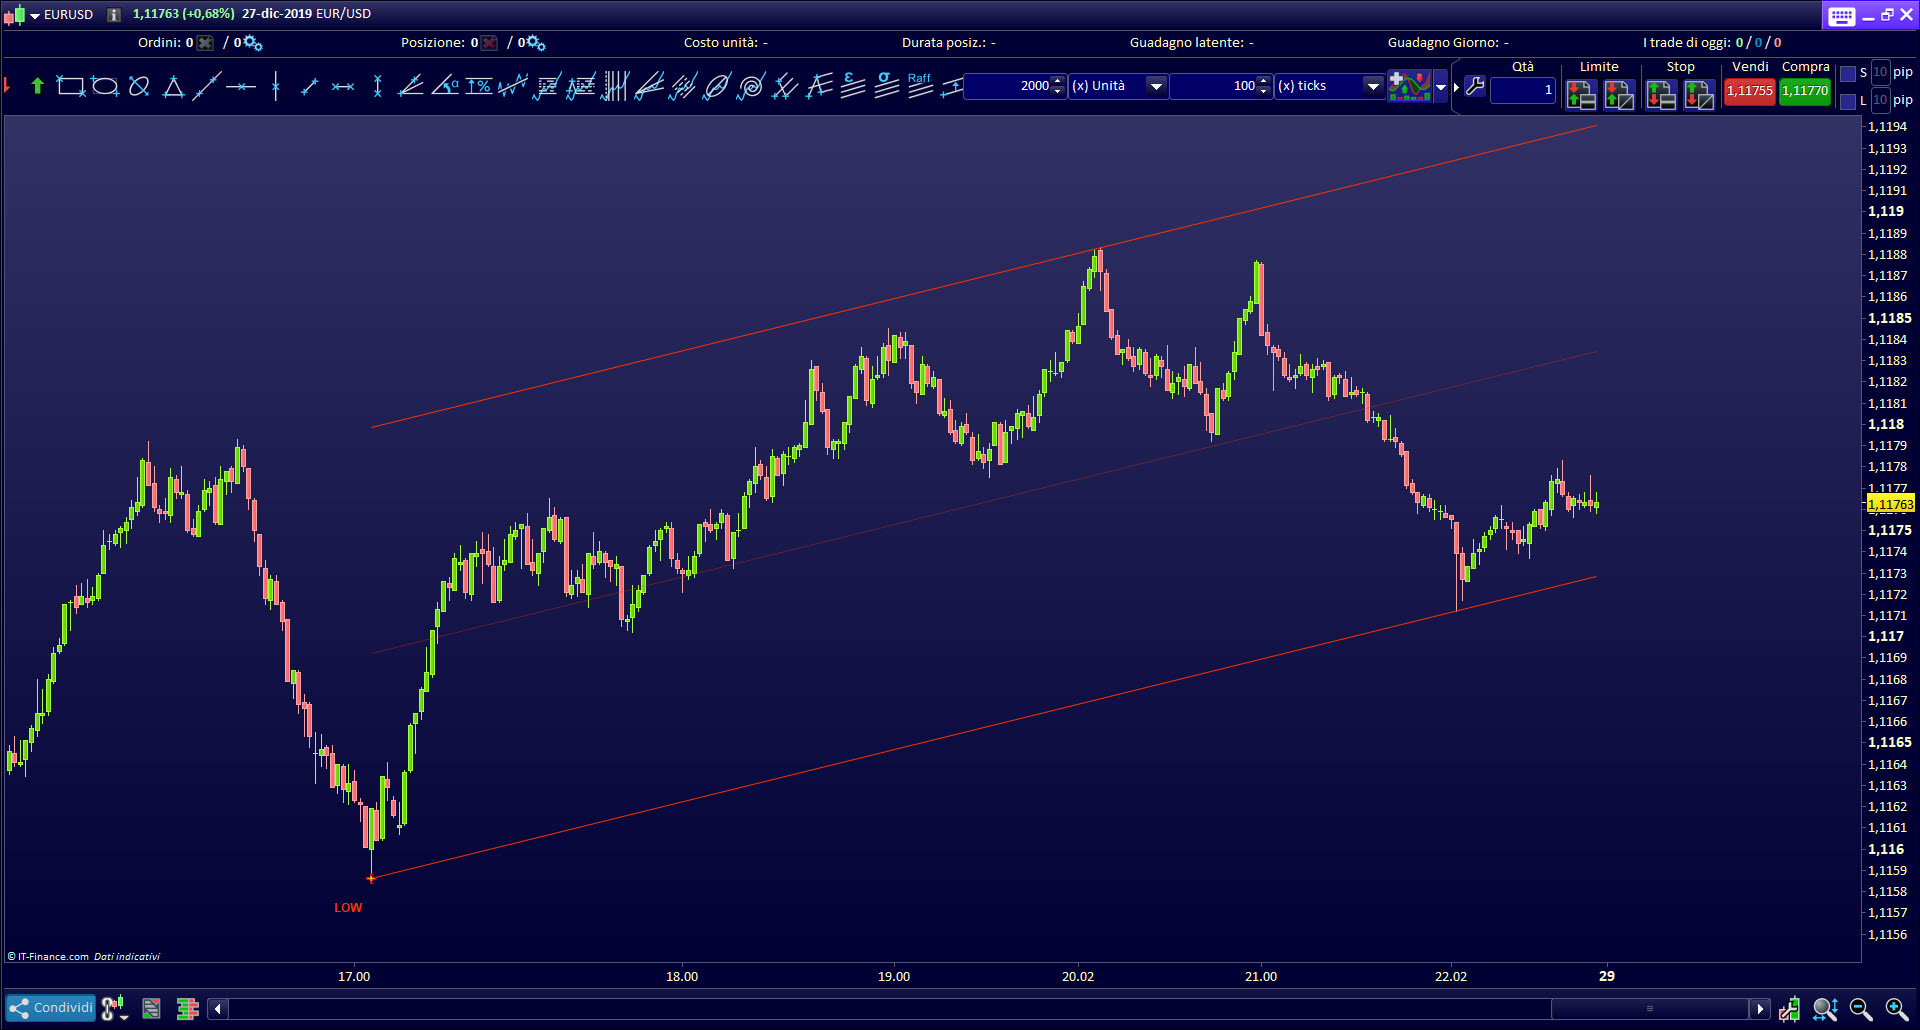
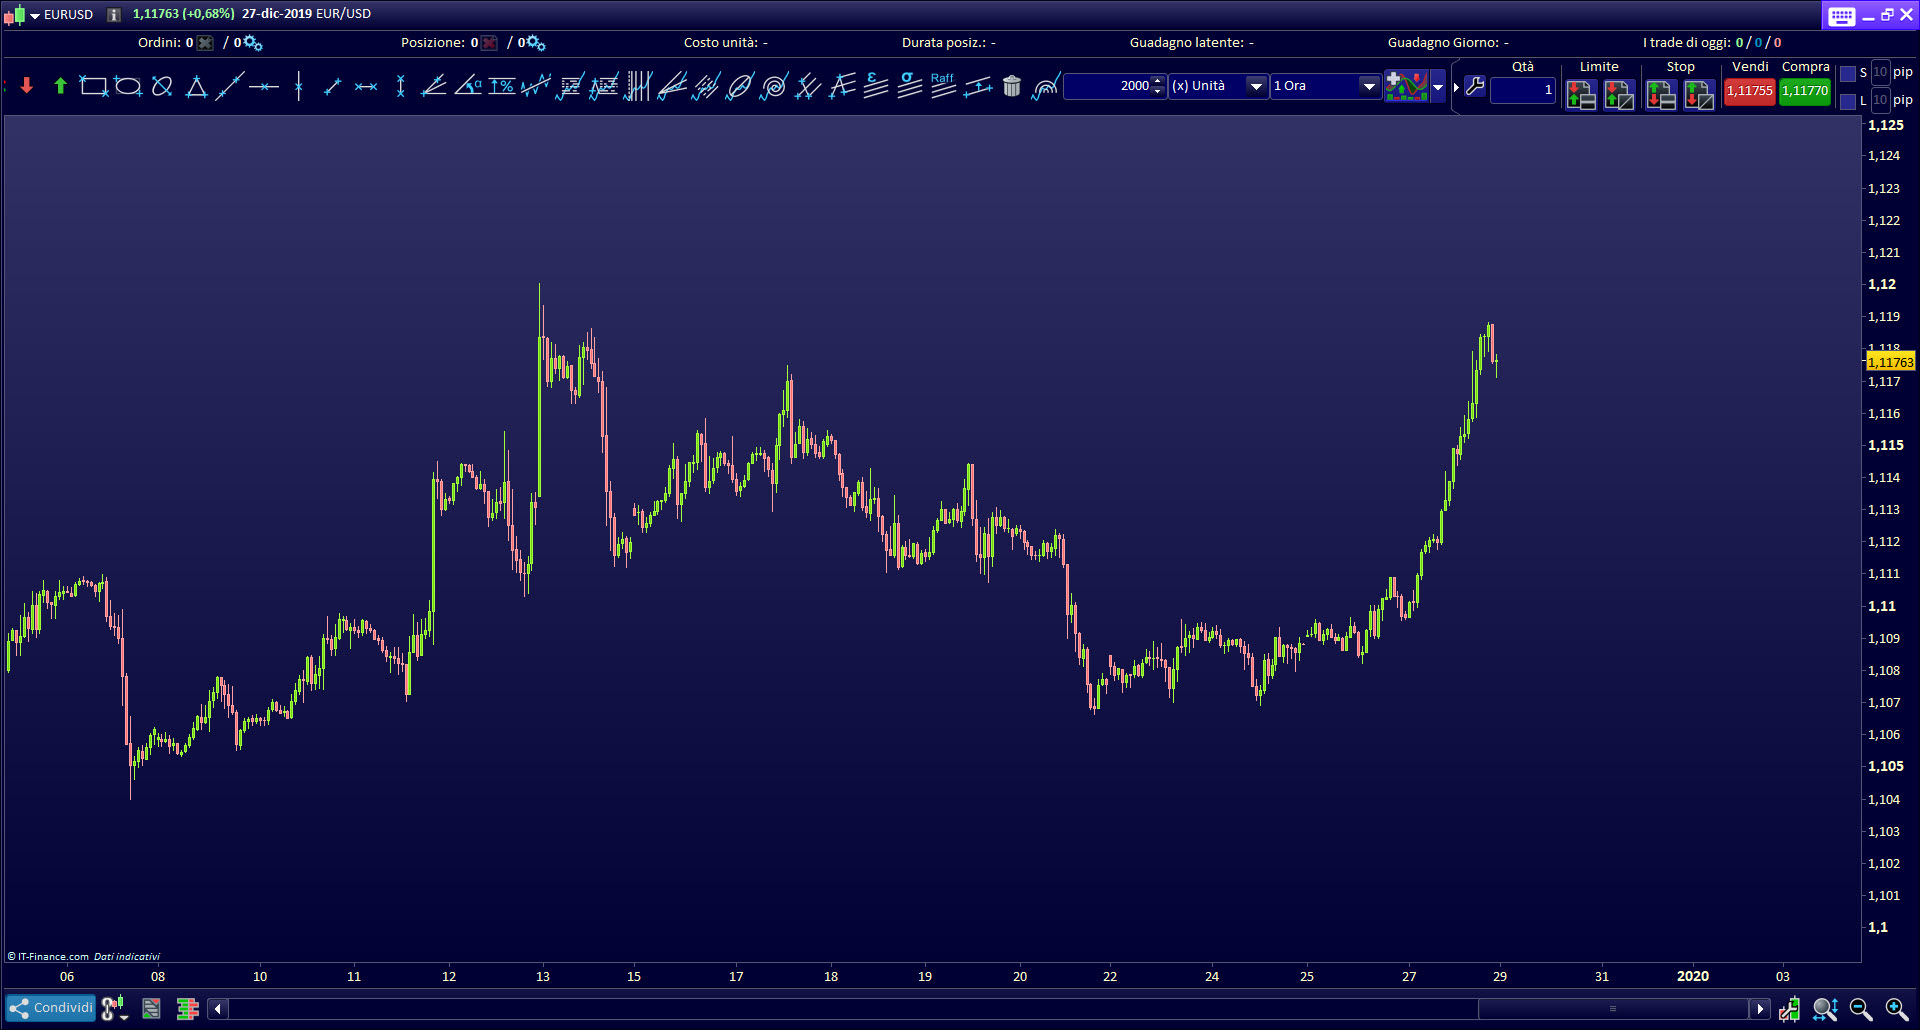
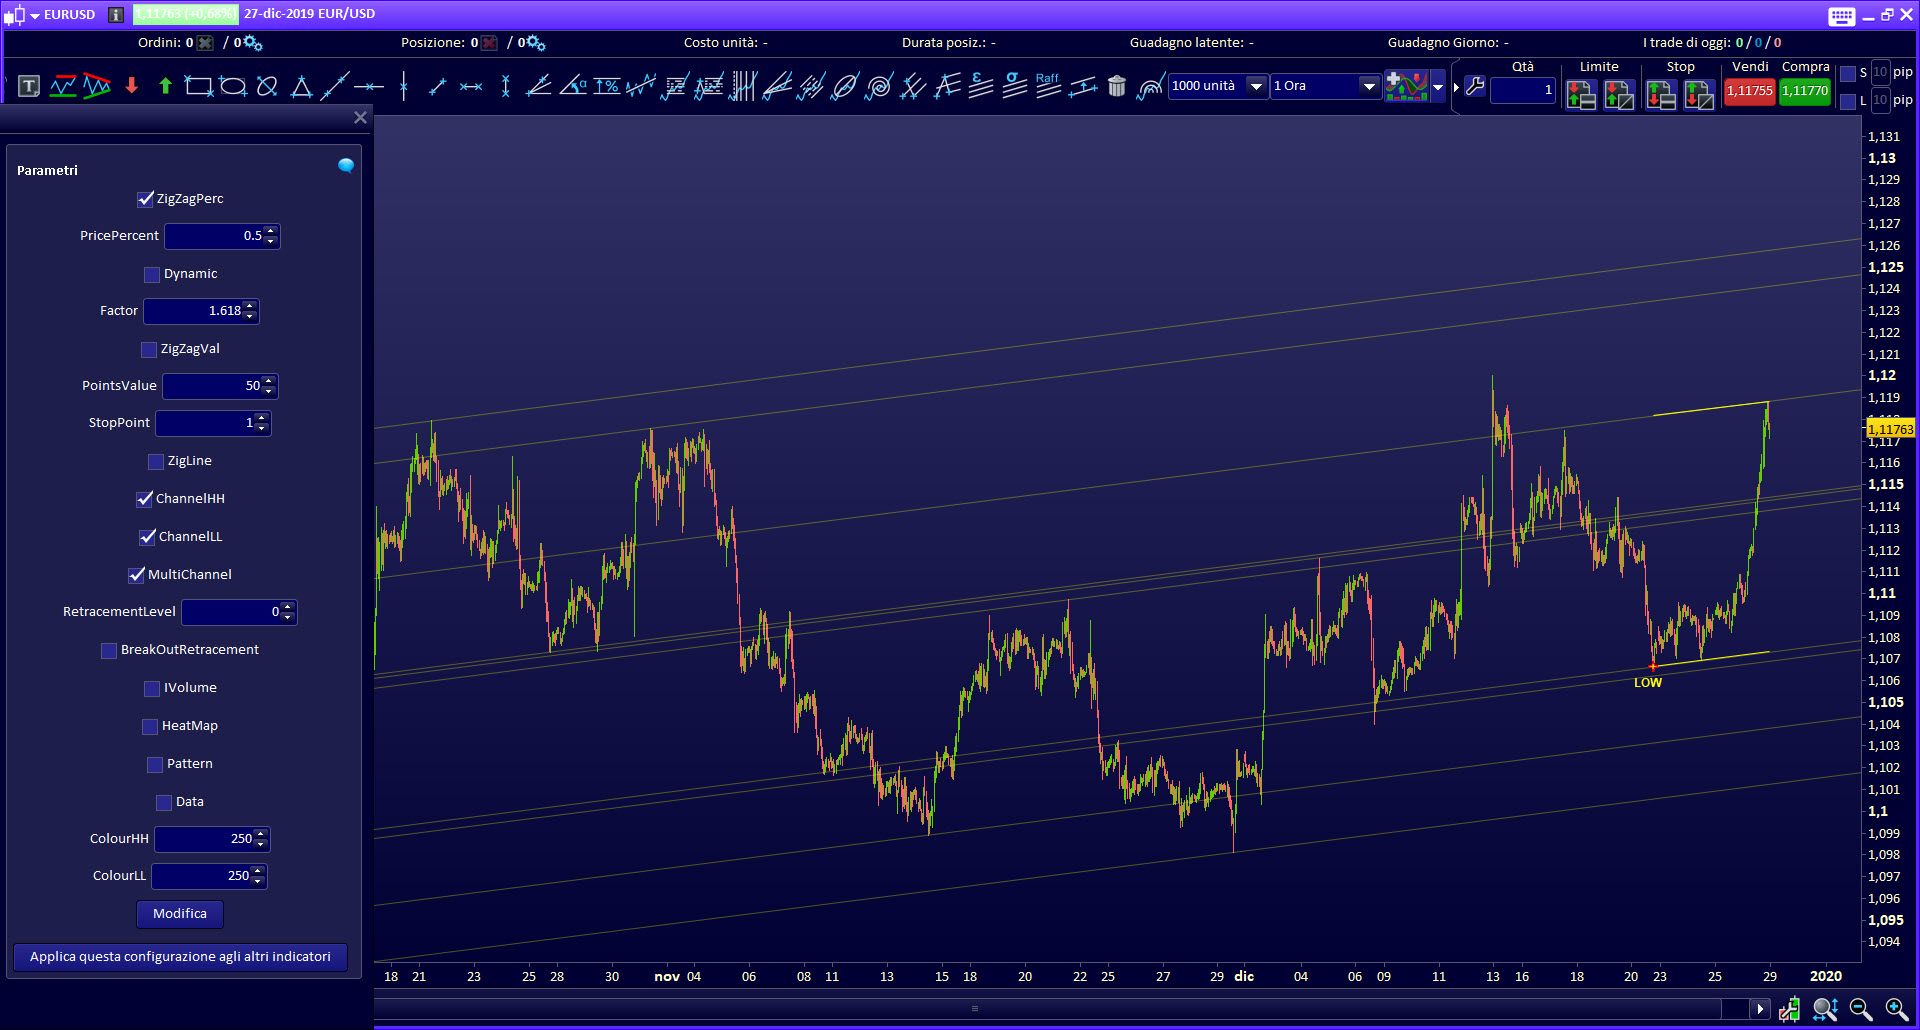
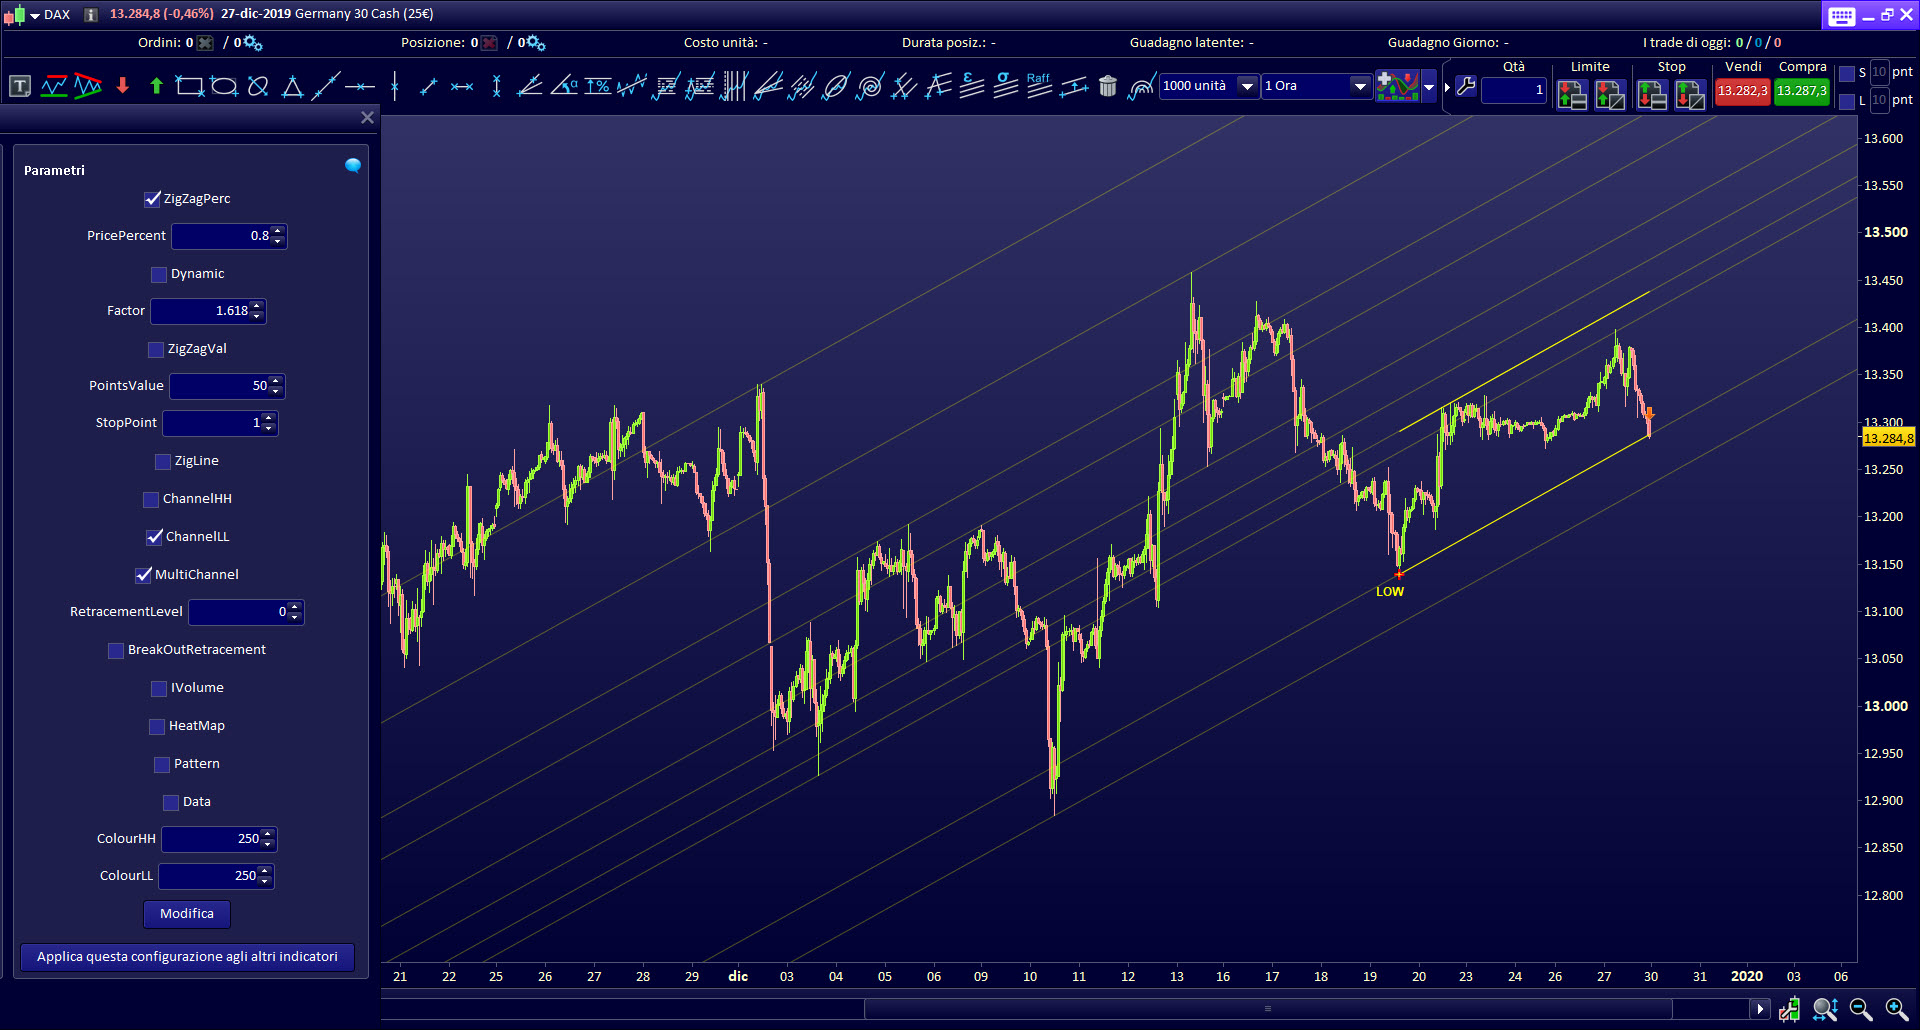
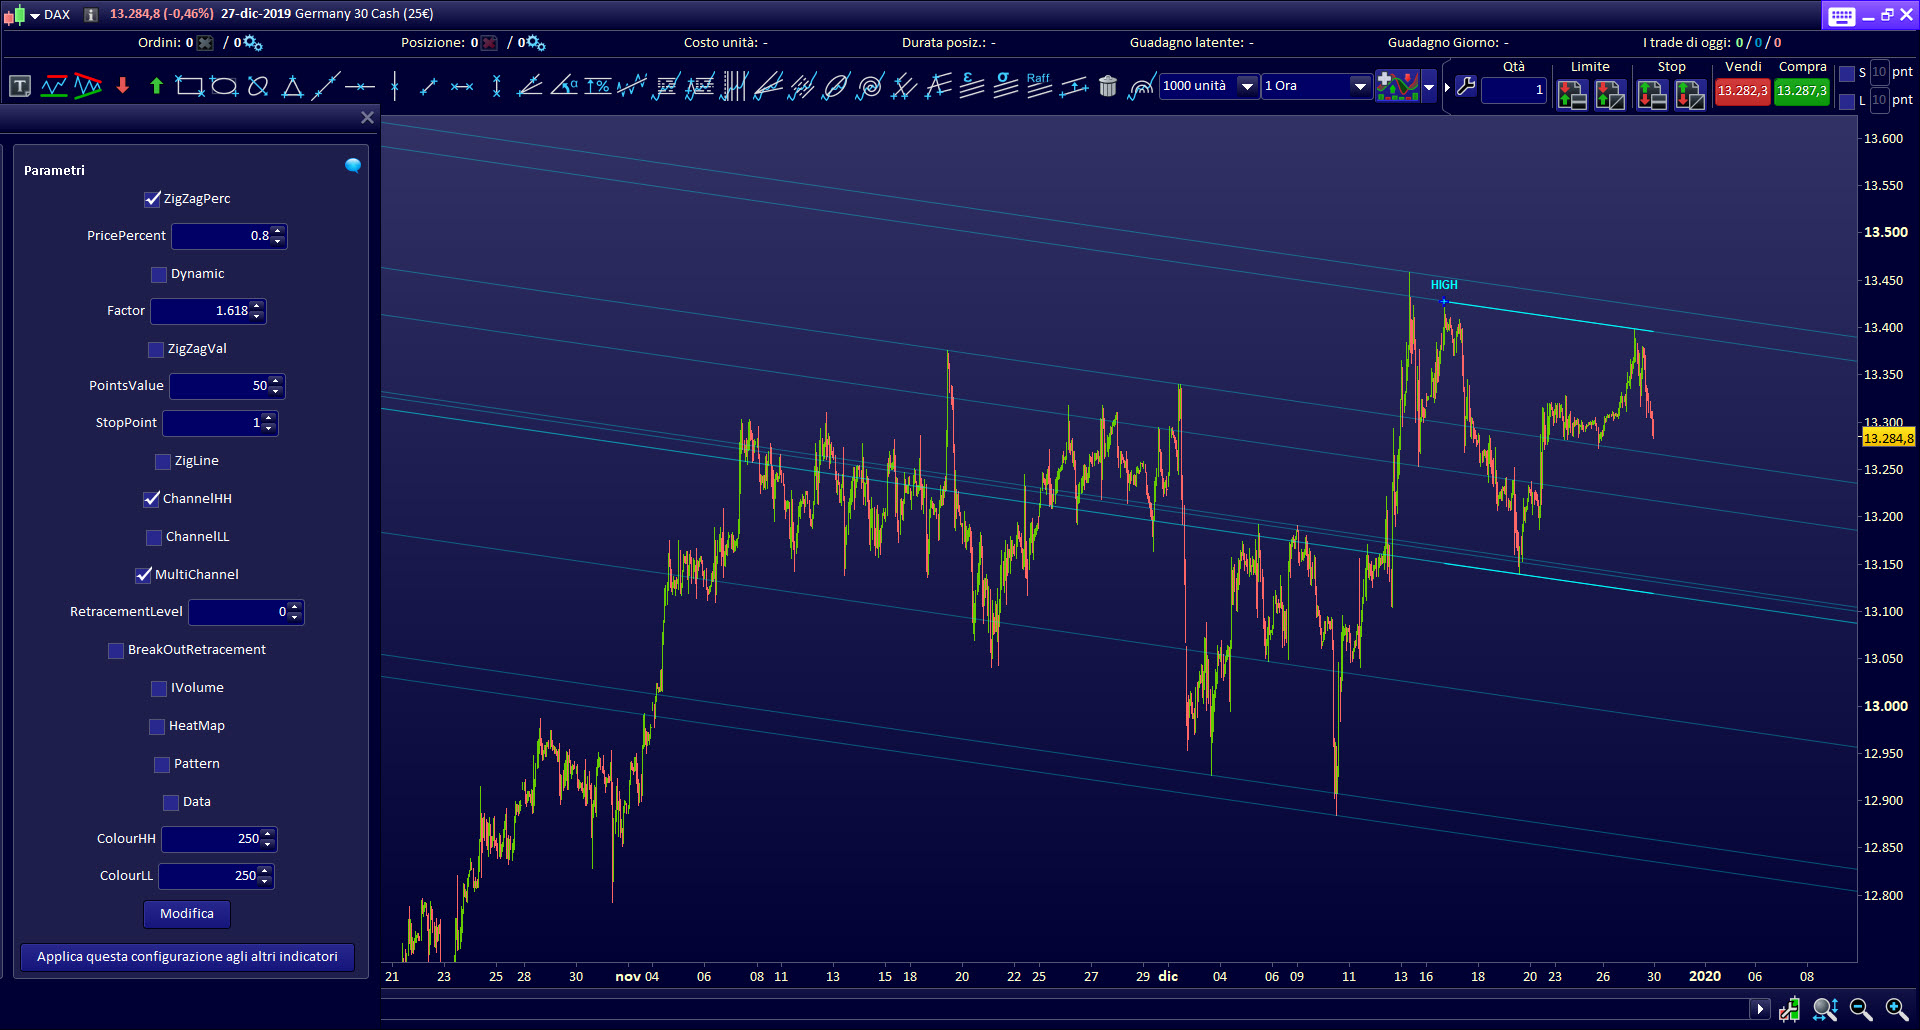
MULTYCHANNELS
When you setting up a buy-sell operation, it is always necessary to know the range of market movement, to set the take profit and the stop loss. The market always moves in a range that has an inclination.
Using the MultyChannel function of the Tech Channel indicator, it is possible to clearly recognize the inclination of the various ranges that form between oblique supports and resistances.
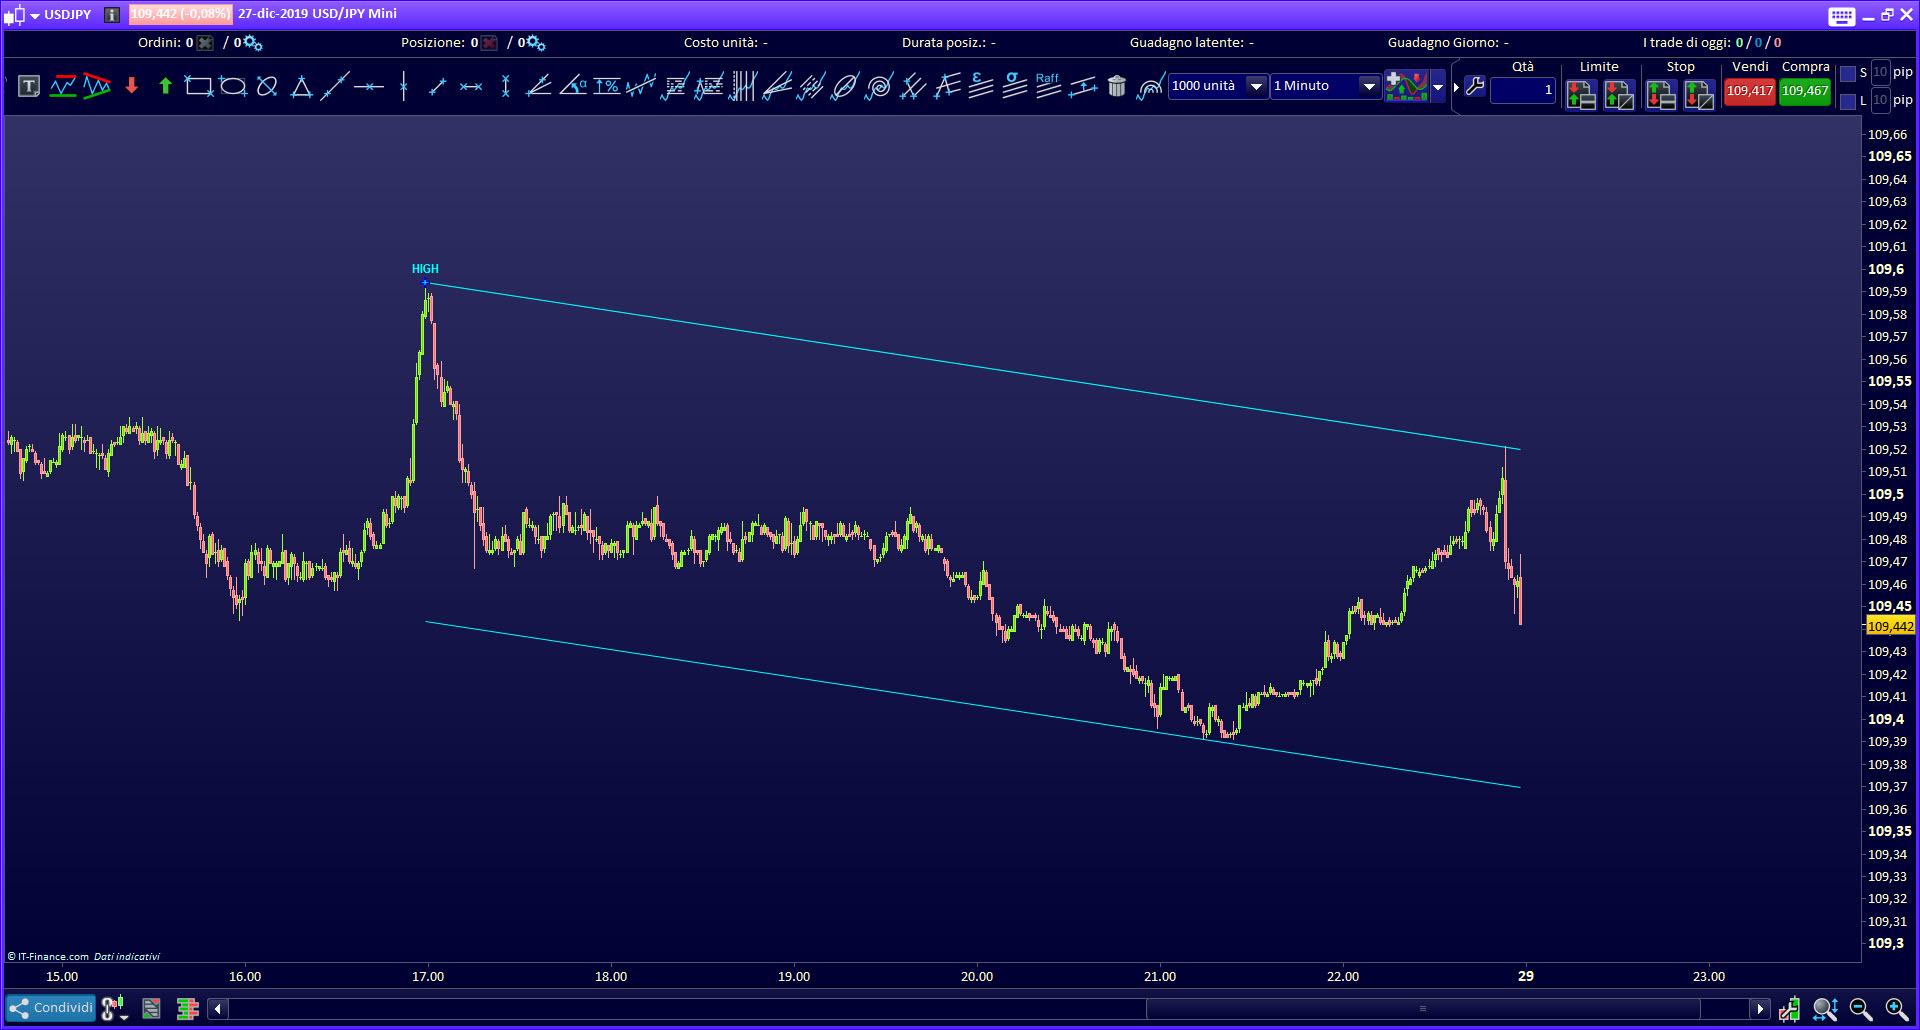
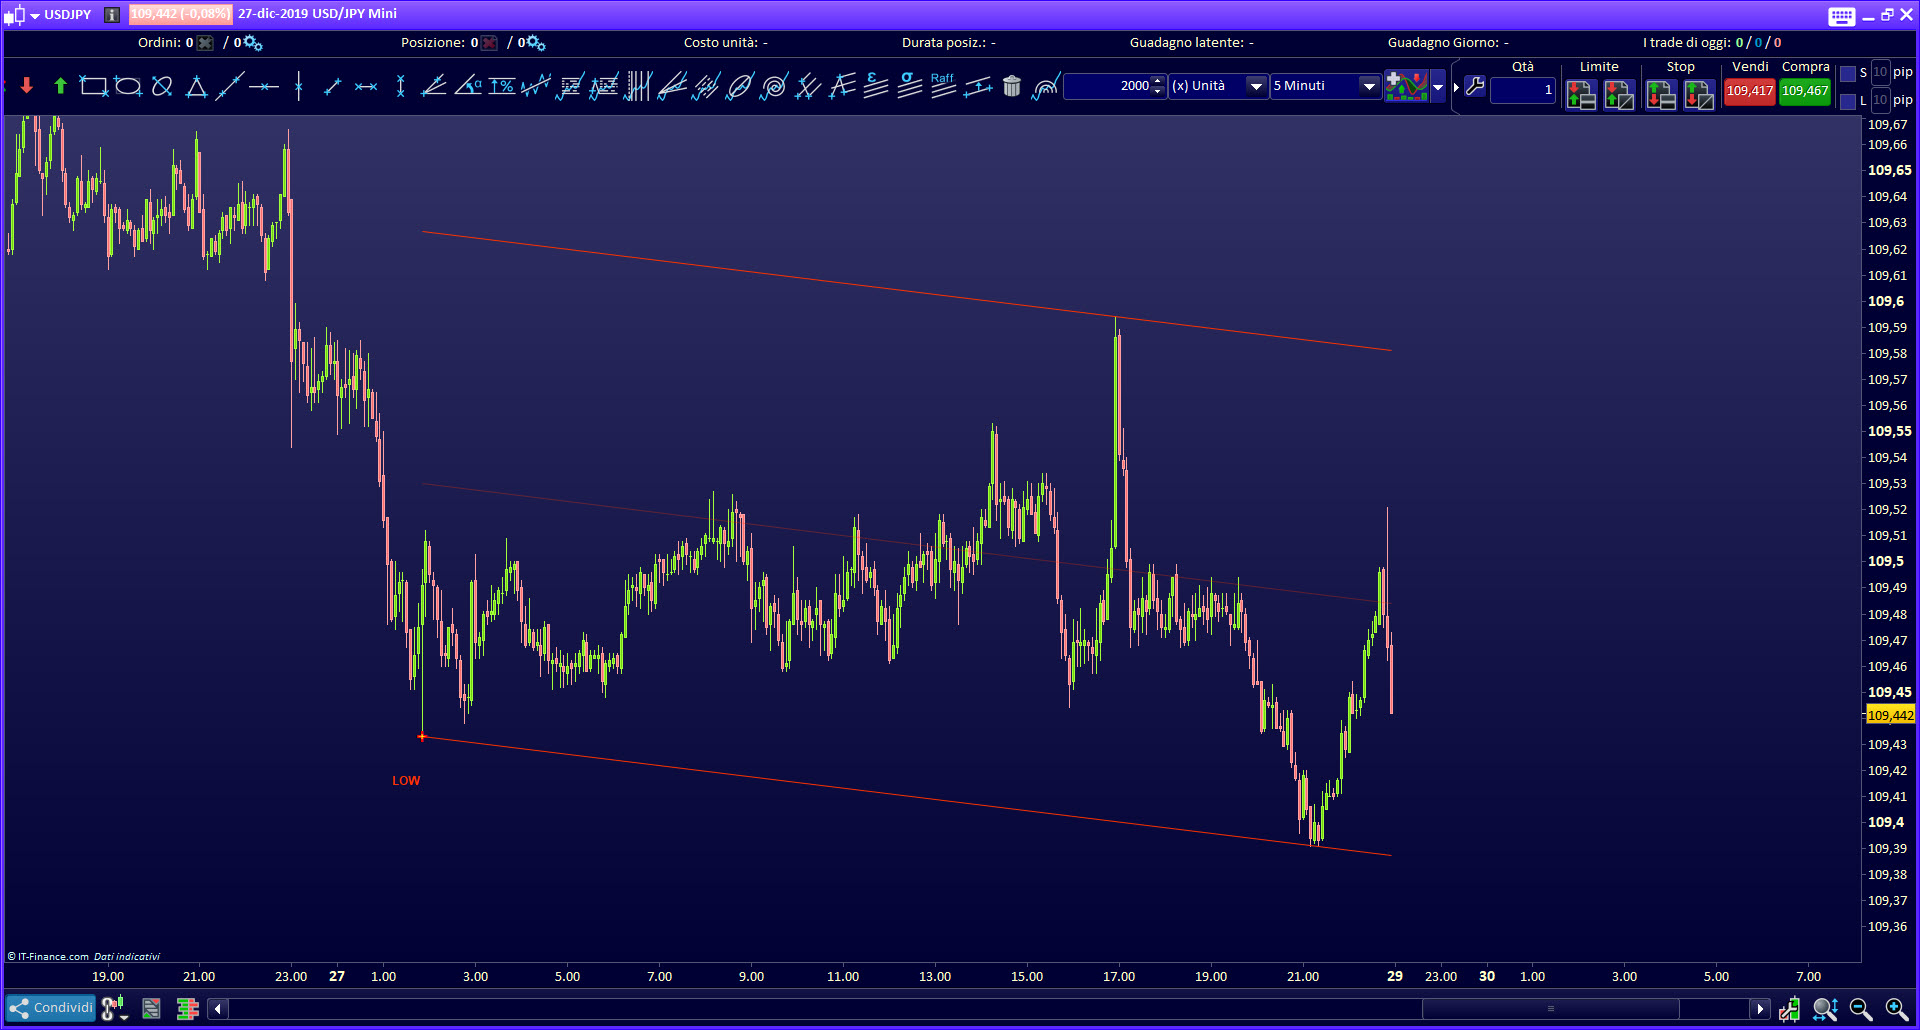
In the following image I show you how the graph without indicator is incomprehensible, compared to the graph with the indicator. The difference is striking.
If you have MultyChannel indication at your disposal, it will be much easier to set up your buy-sell operations, and you will avoid gross errors.

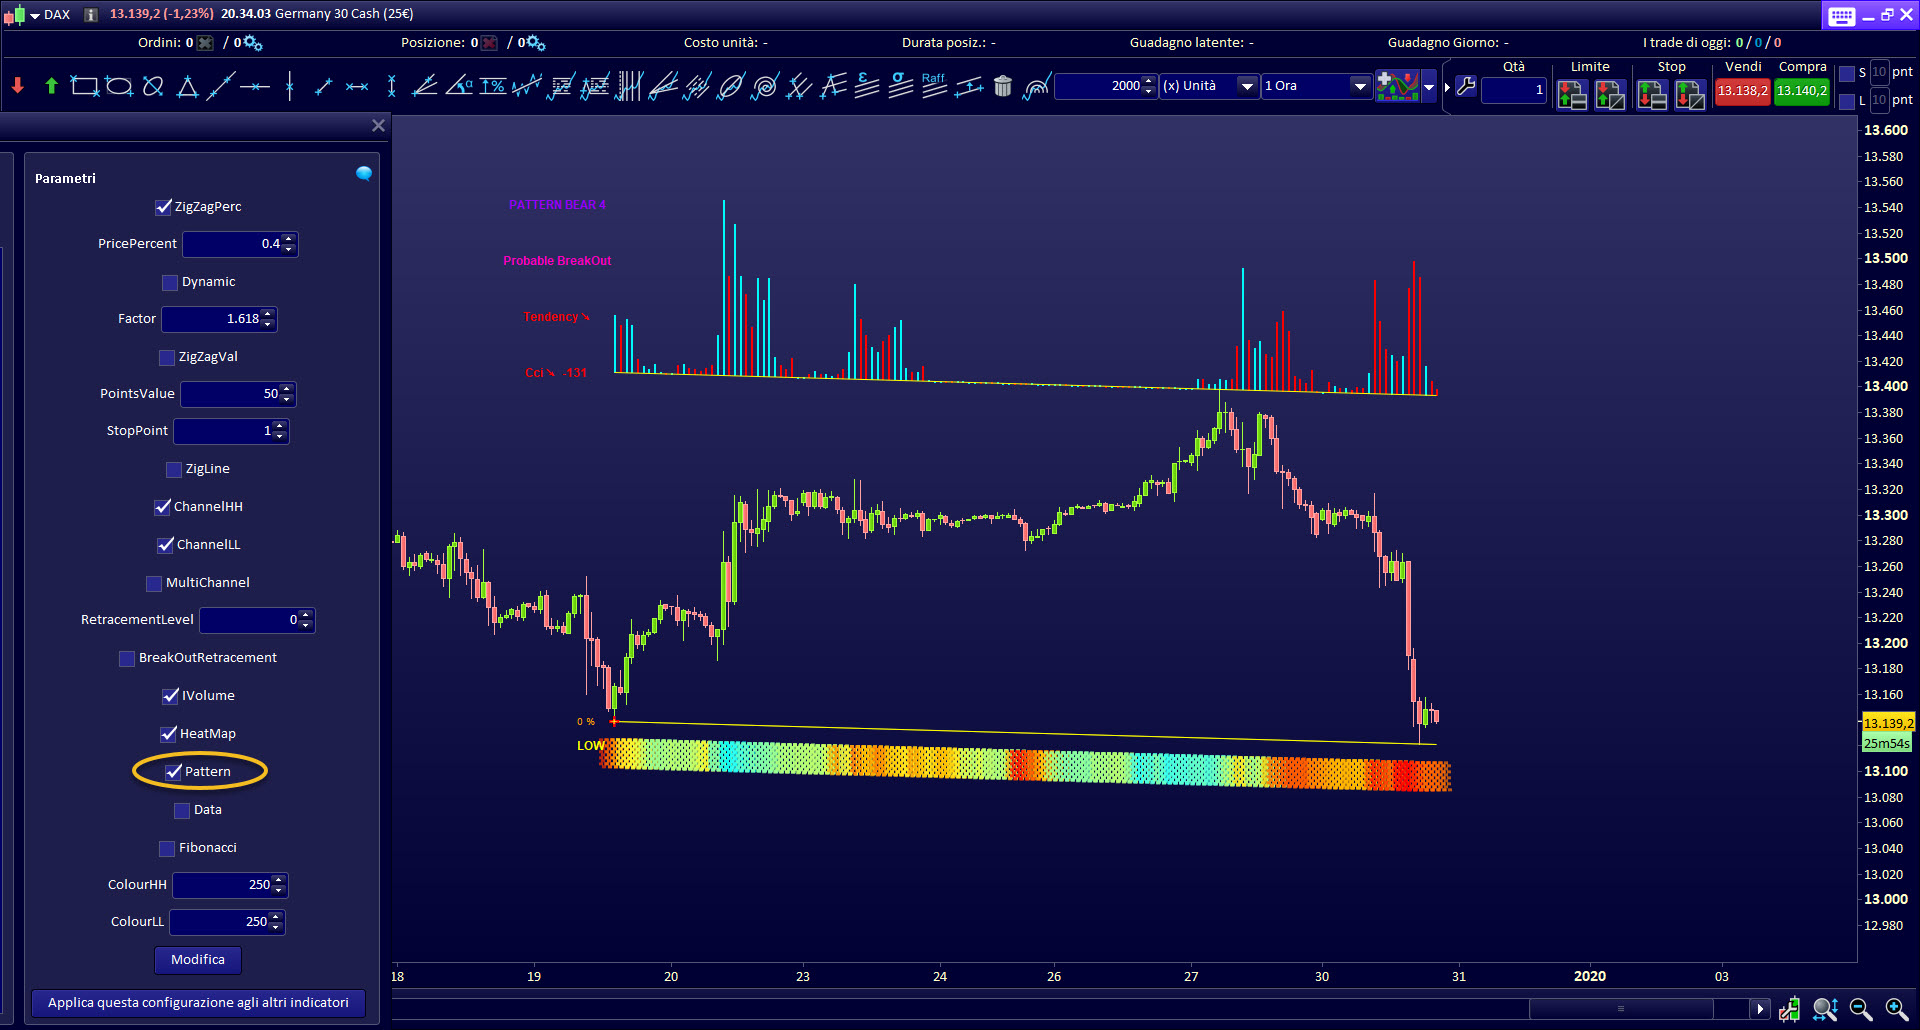
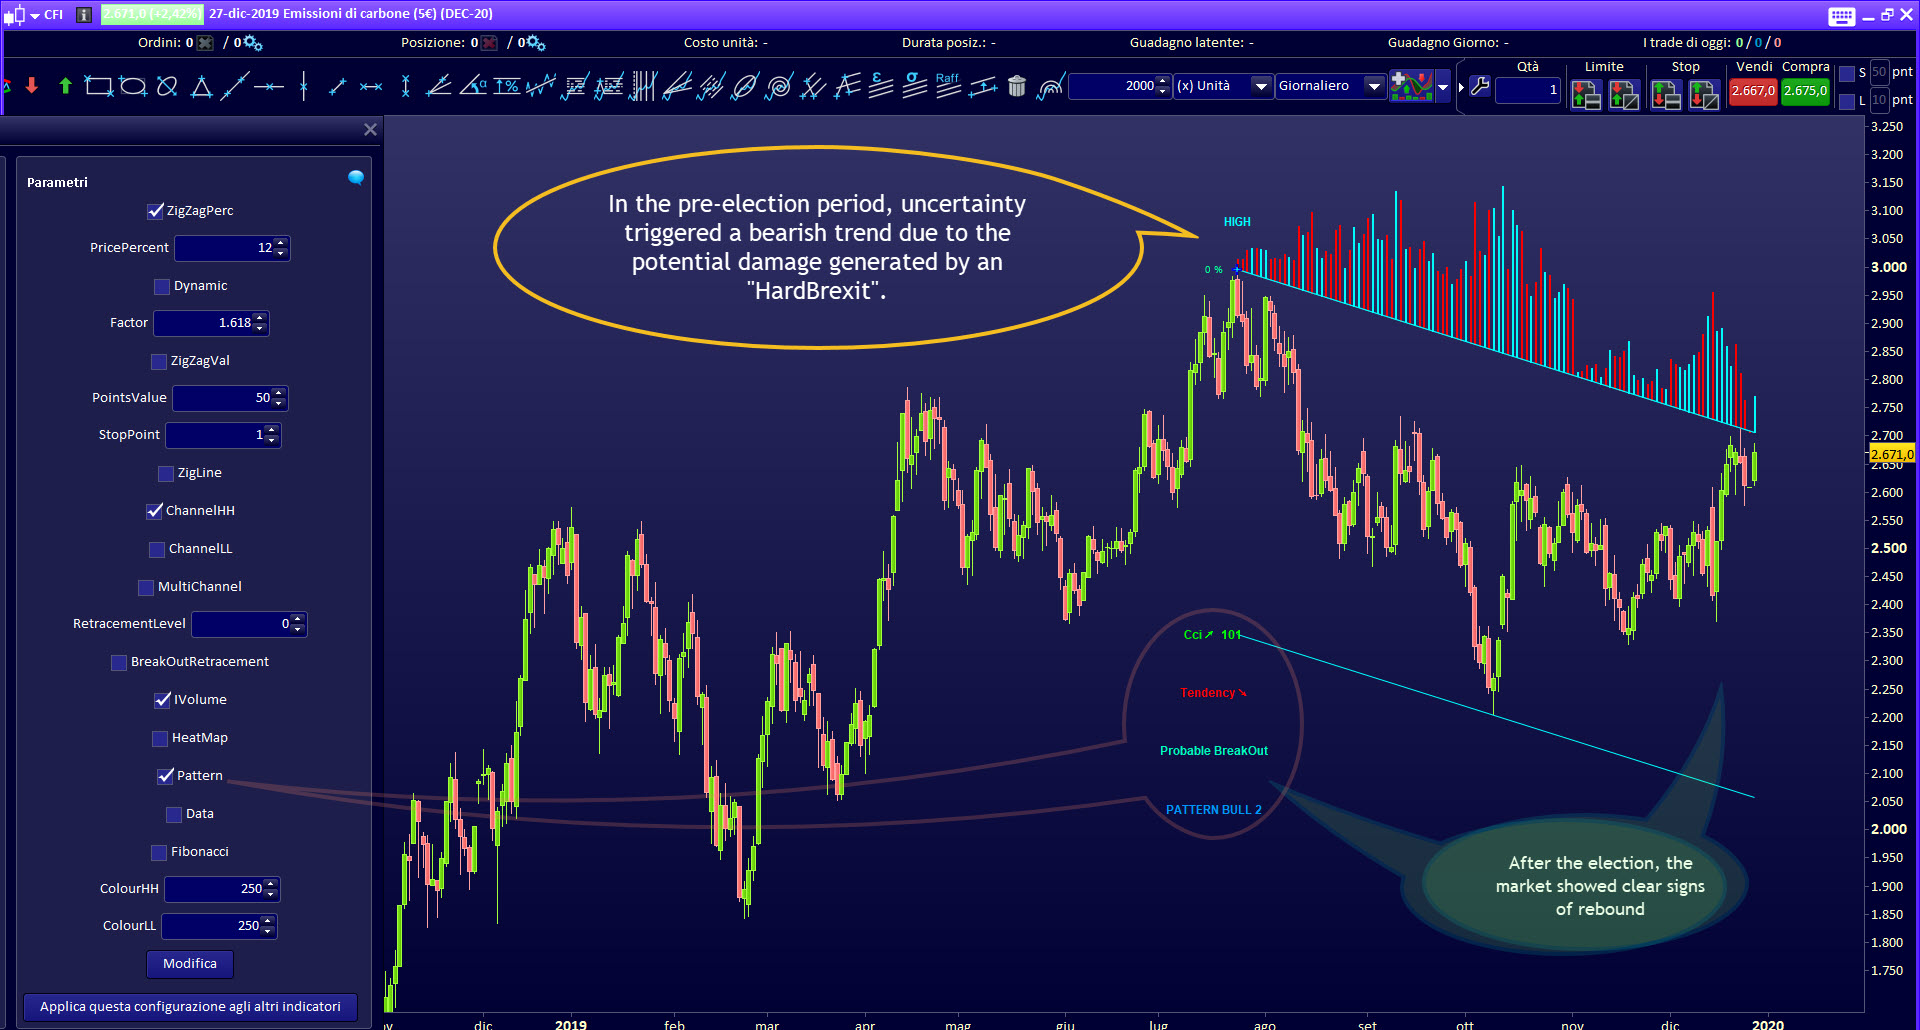
RECOGNITION OF RECURRING GRAPHIC PATTERN
This function is very useful for receiving information on the market situation. The most recurrent figures are 4, or 8 if they consider both directions to carry out the buy-sell operations on the markets.
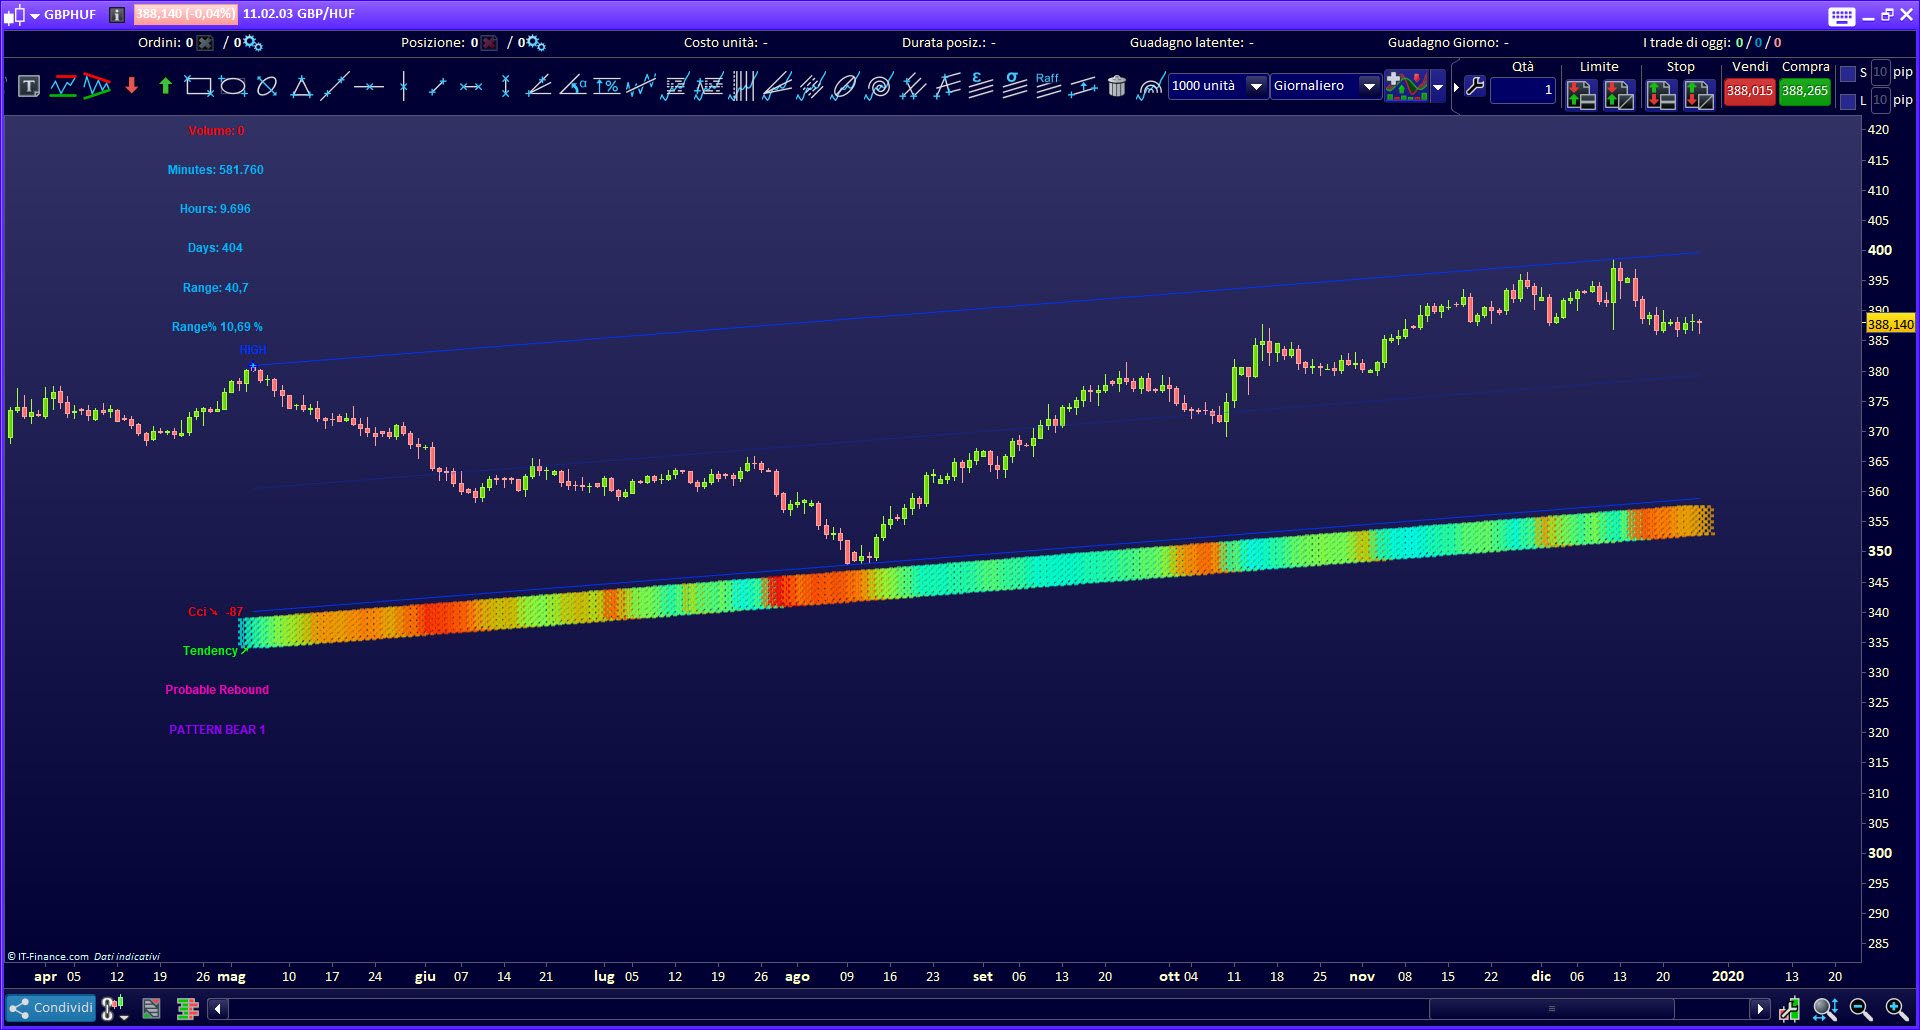
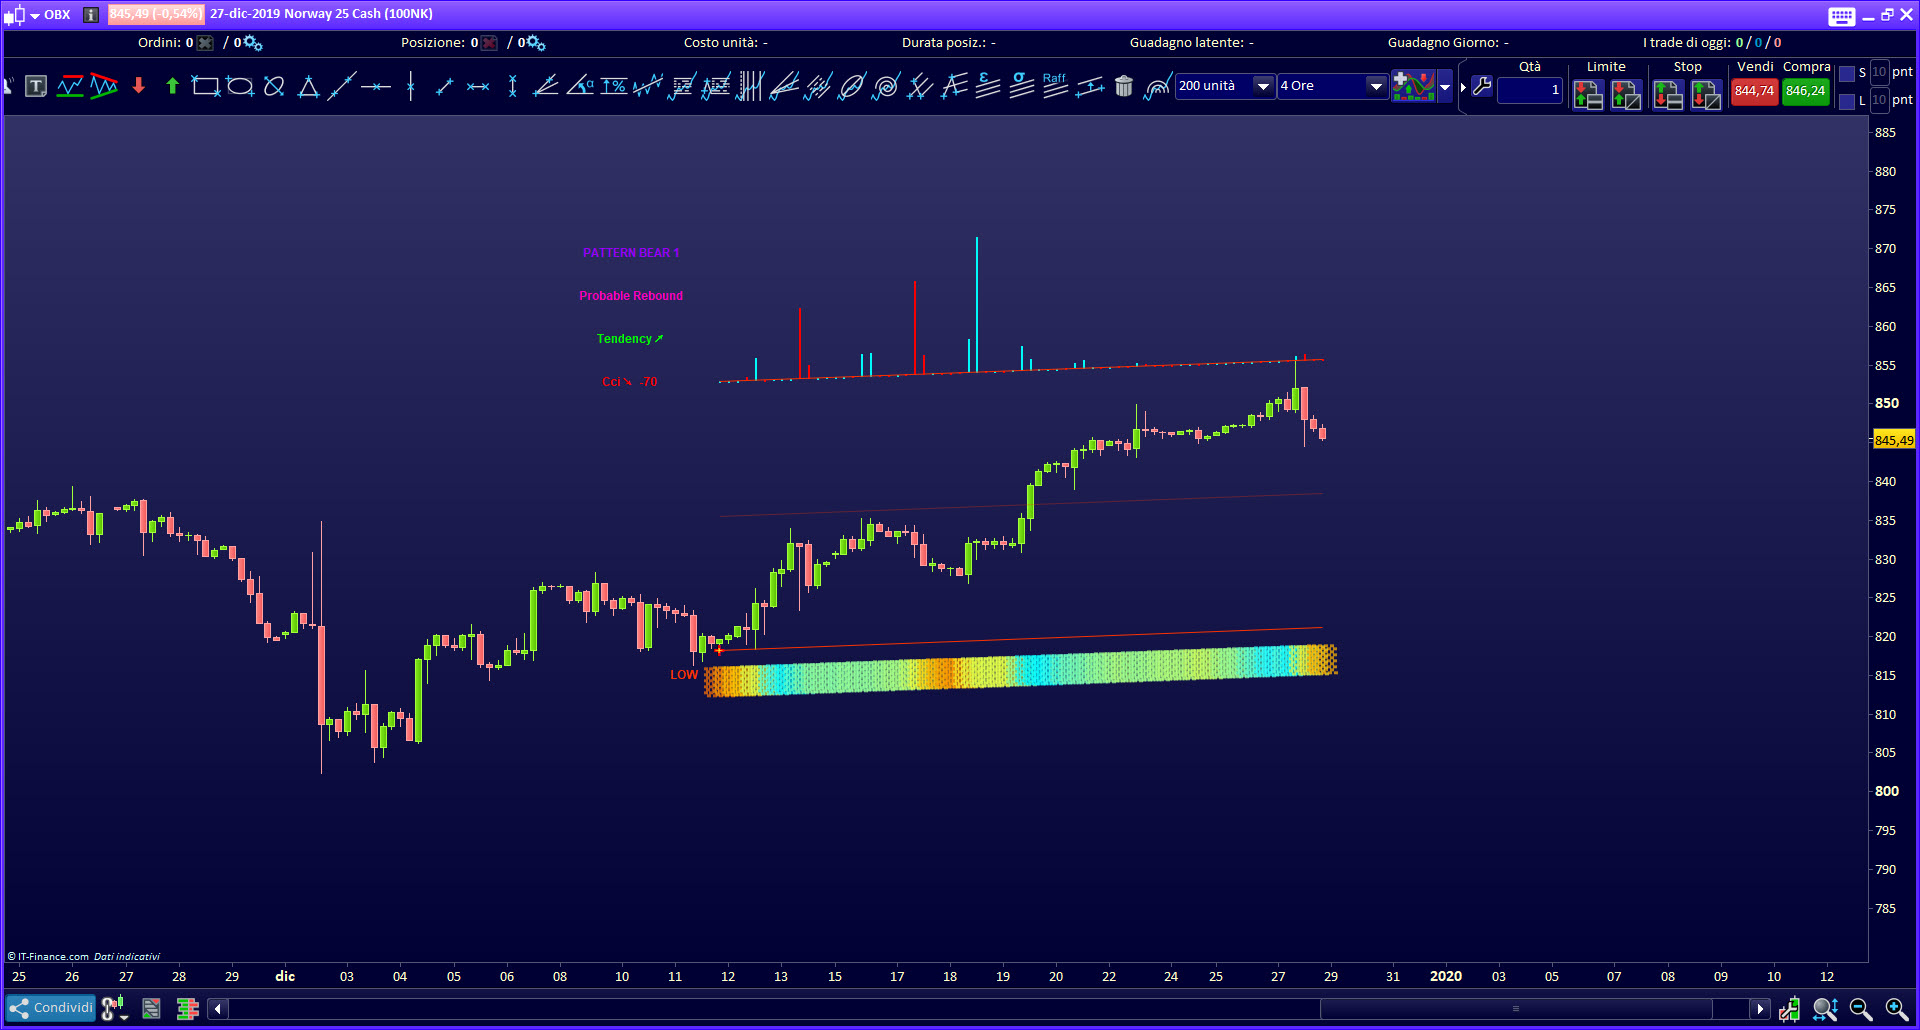
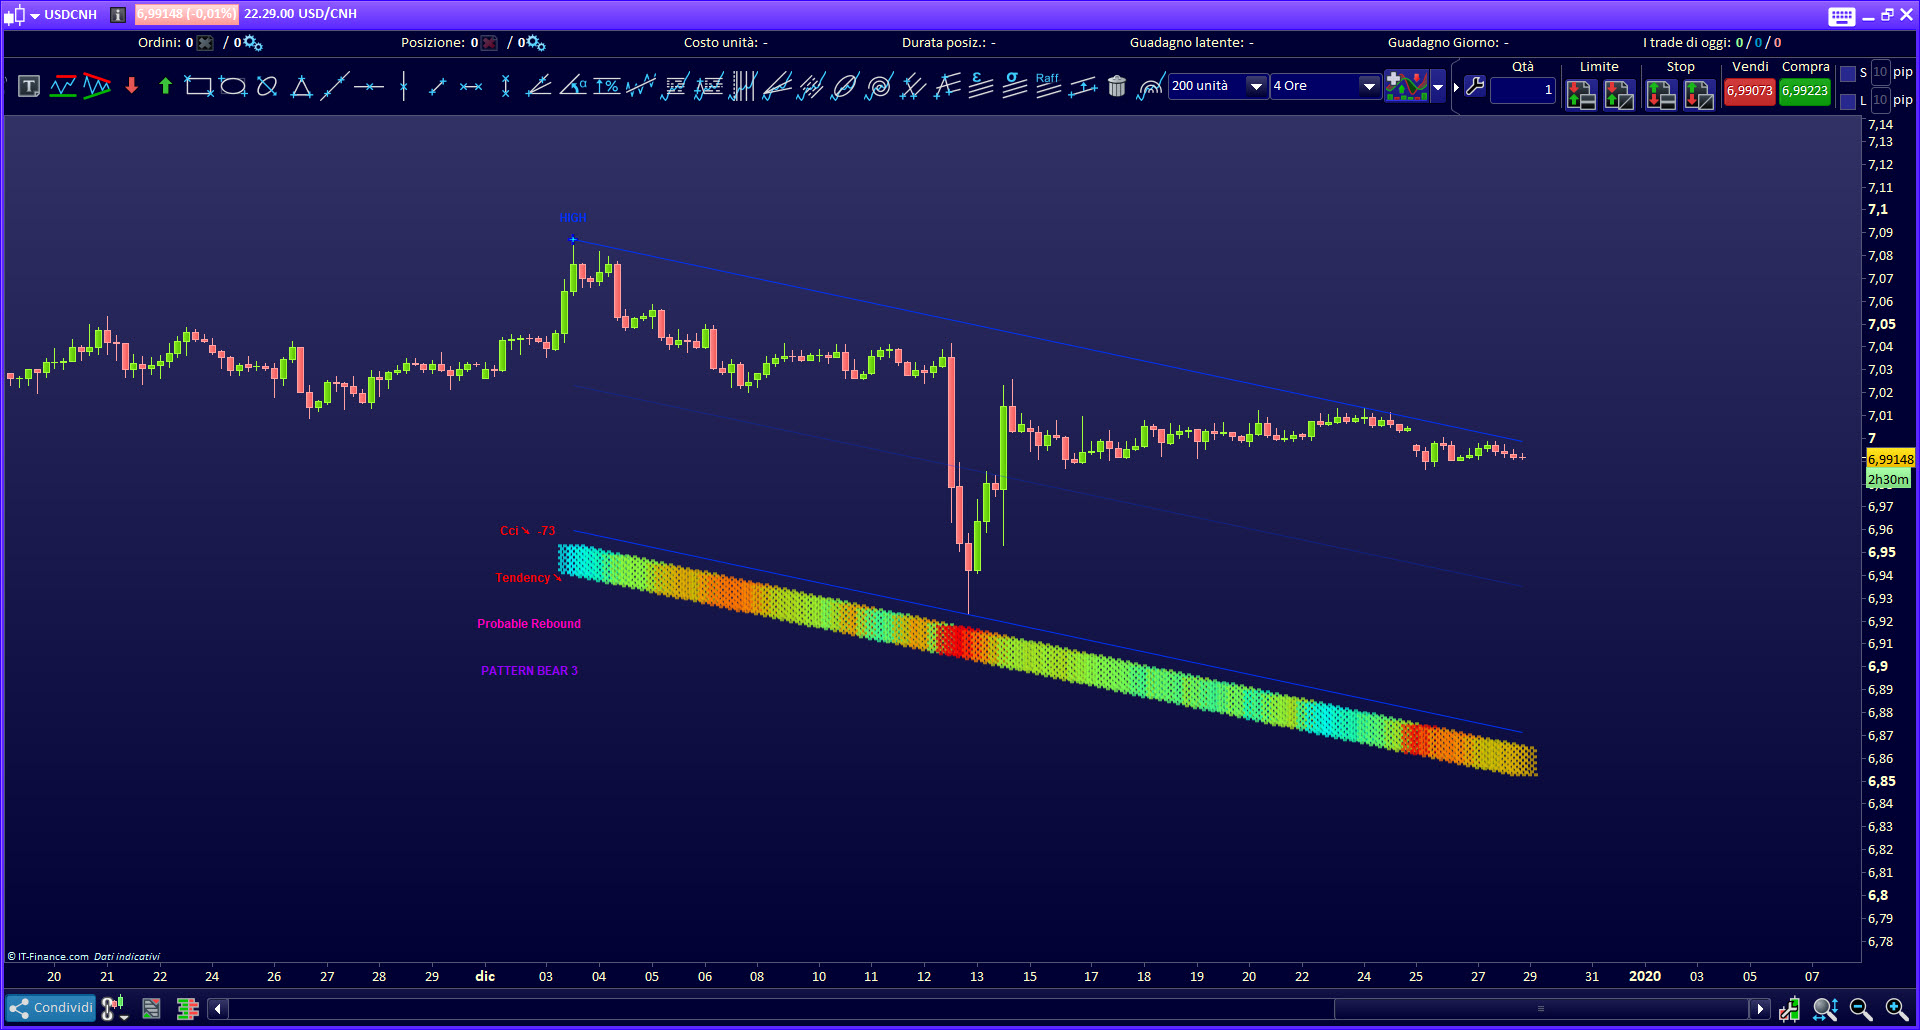
- Pattern1 : Detect Trend REVERSAL PATTERN as Probable Rebound in counterTrend
- ↗ Probable Bullish Rebound against inferior trend line. The channel is bearish
- ↘ Probable Bearish Rebound against superior trend line. The channel is bullish –
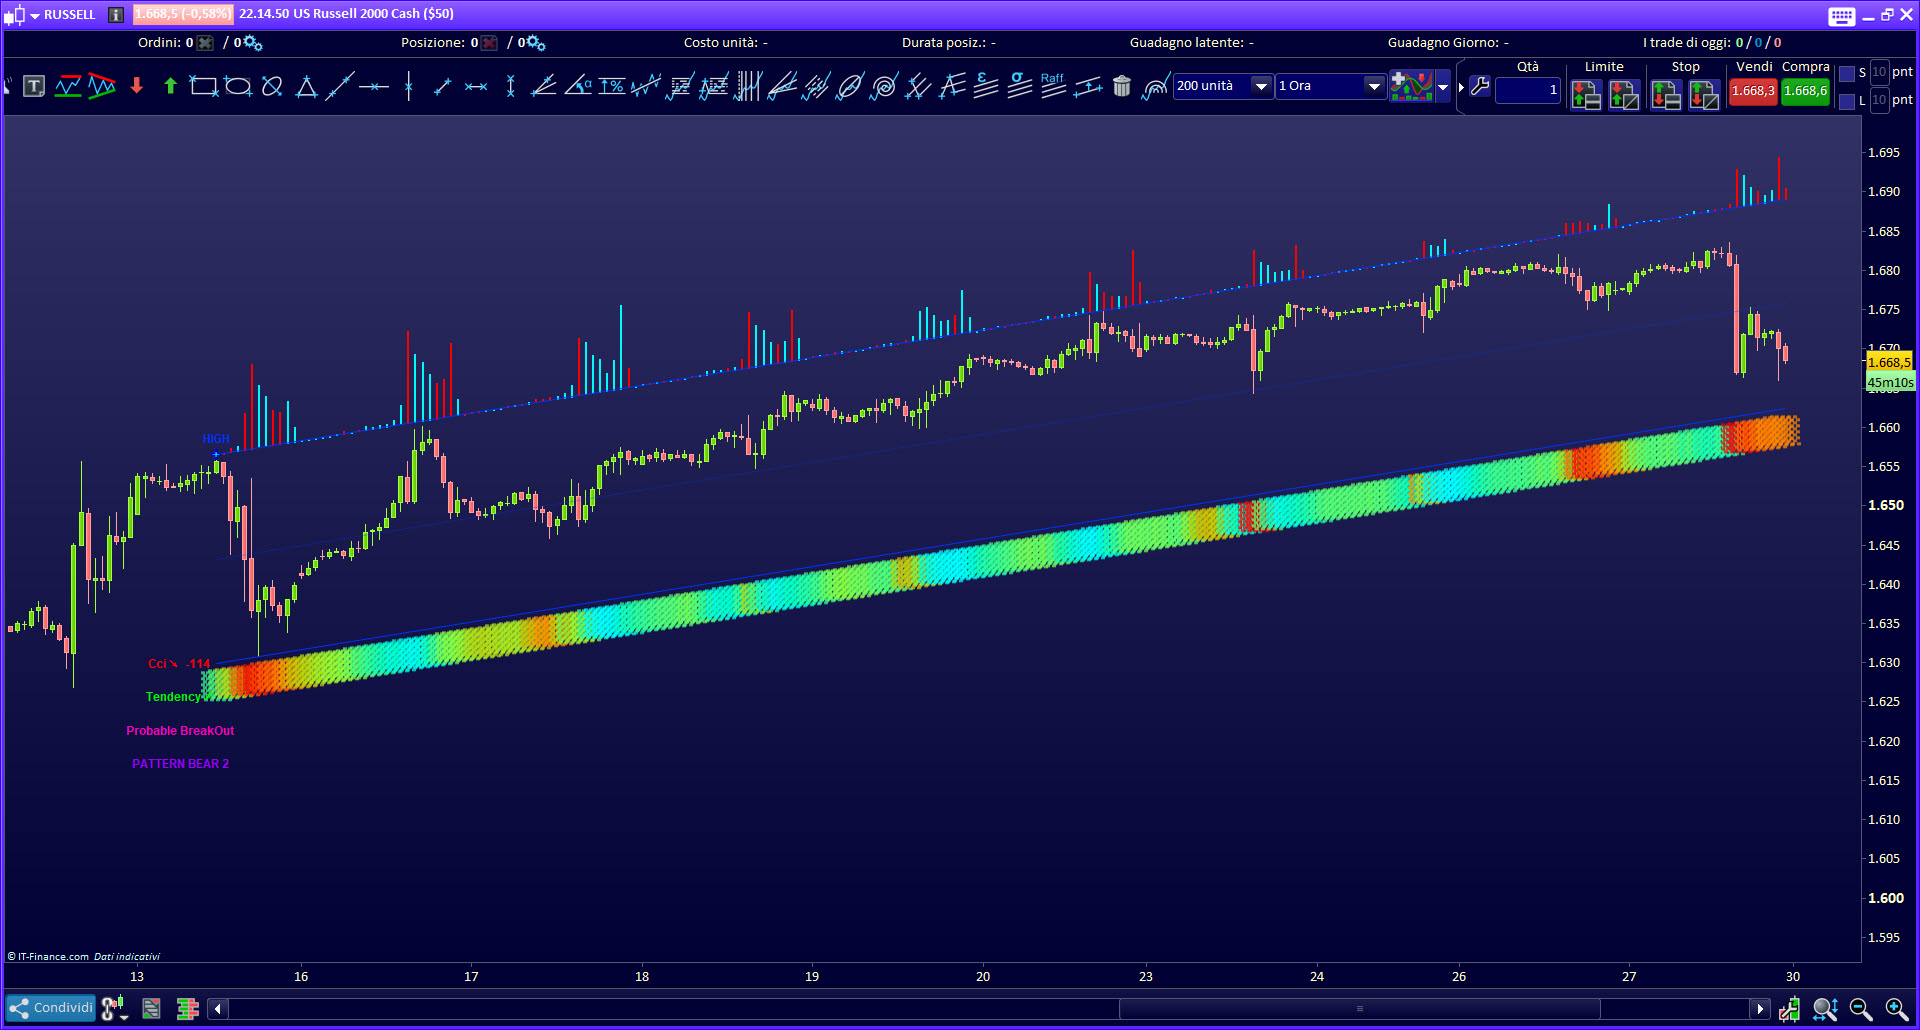
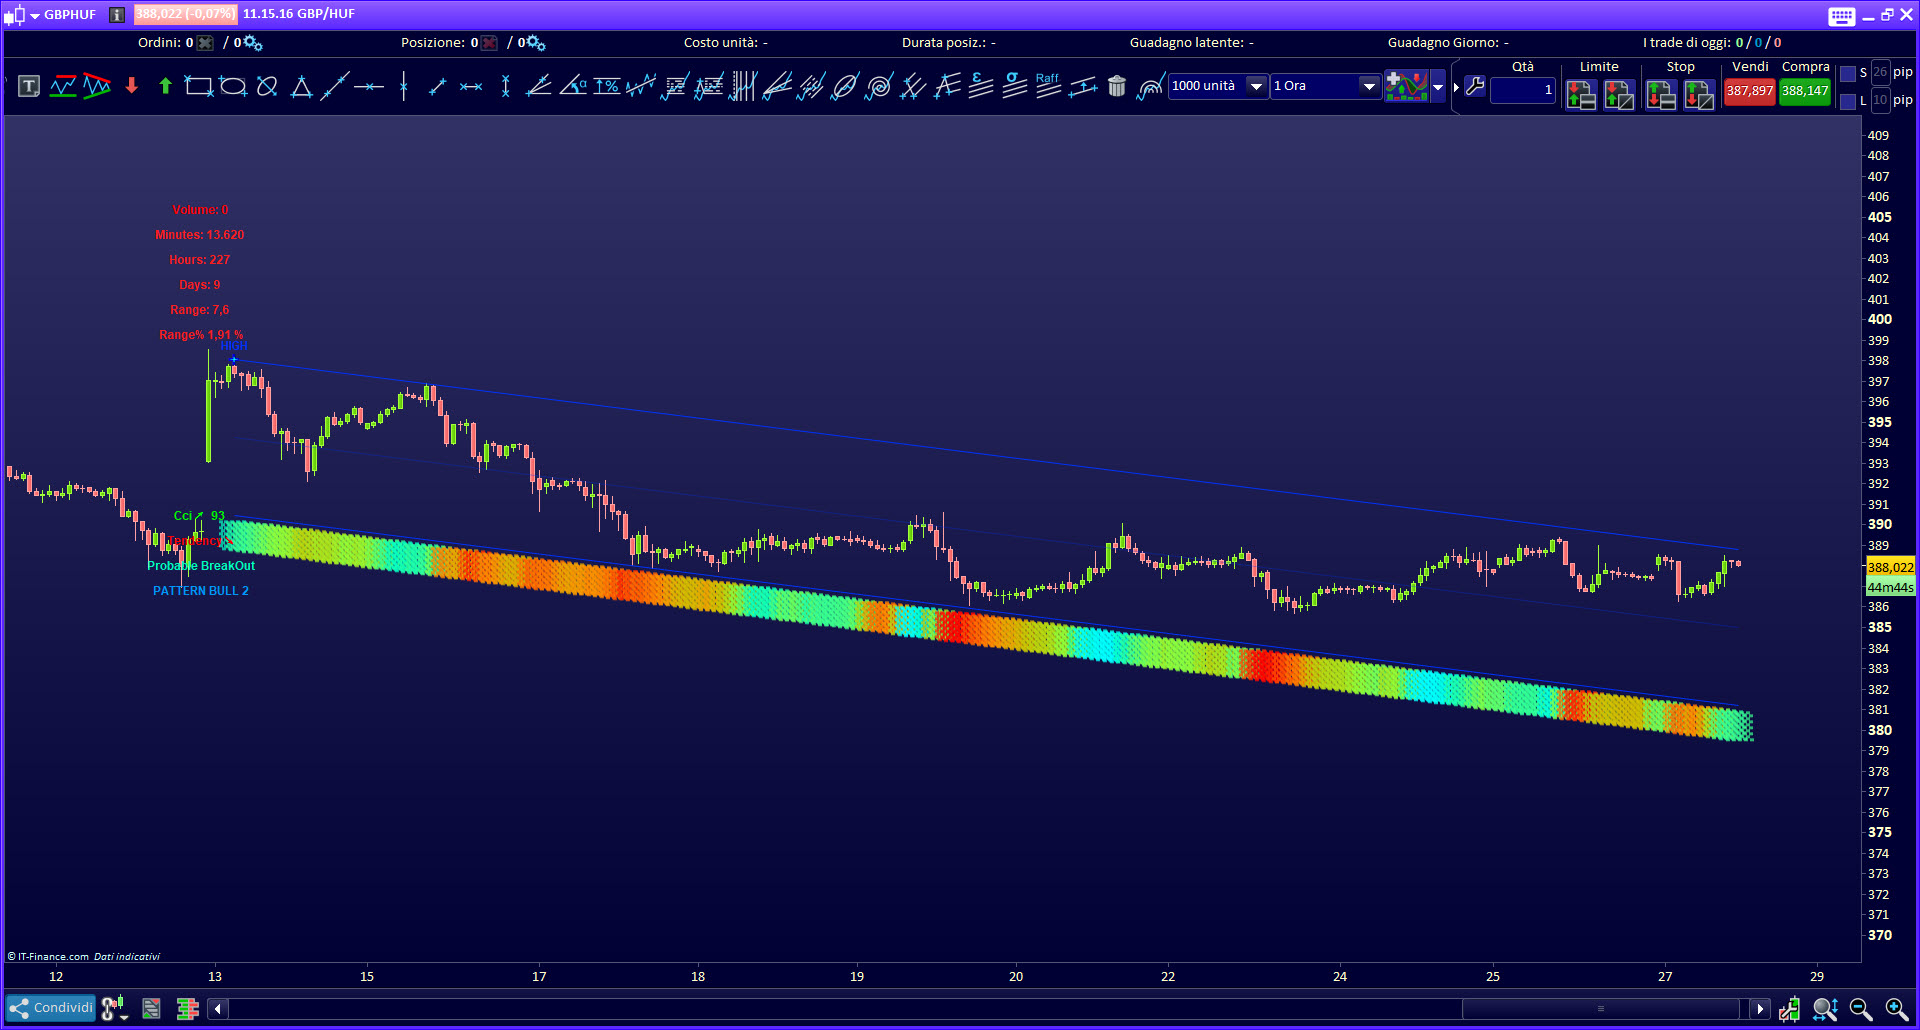
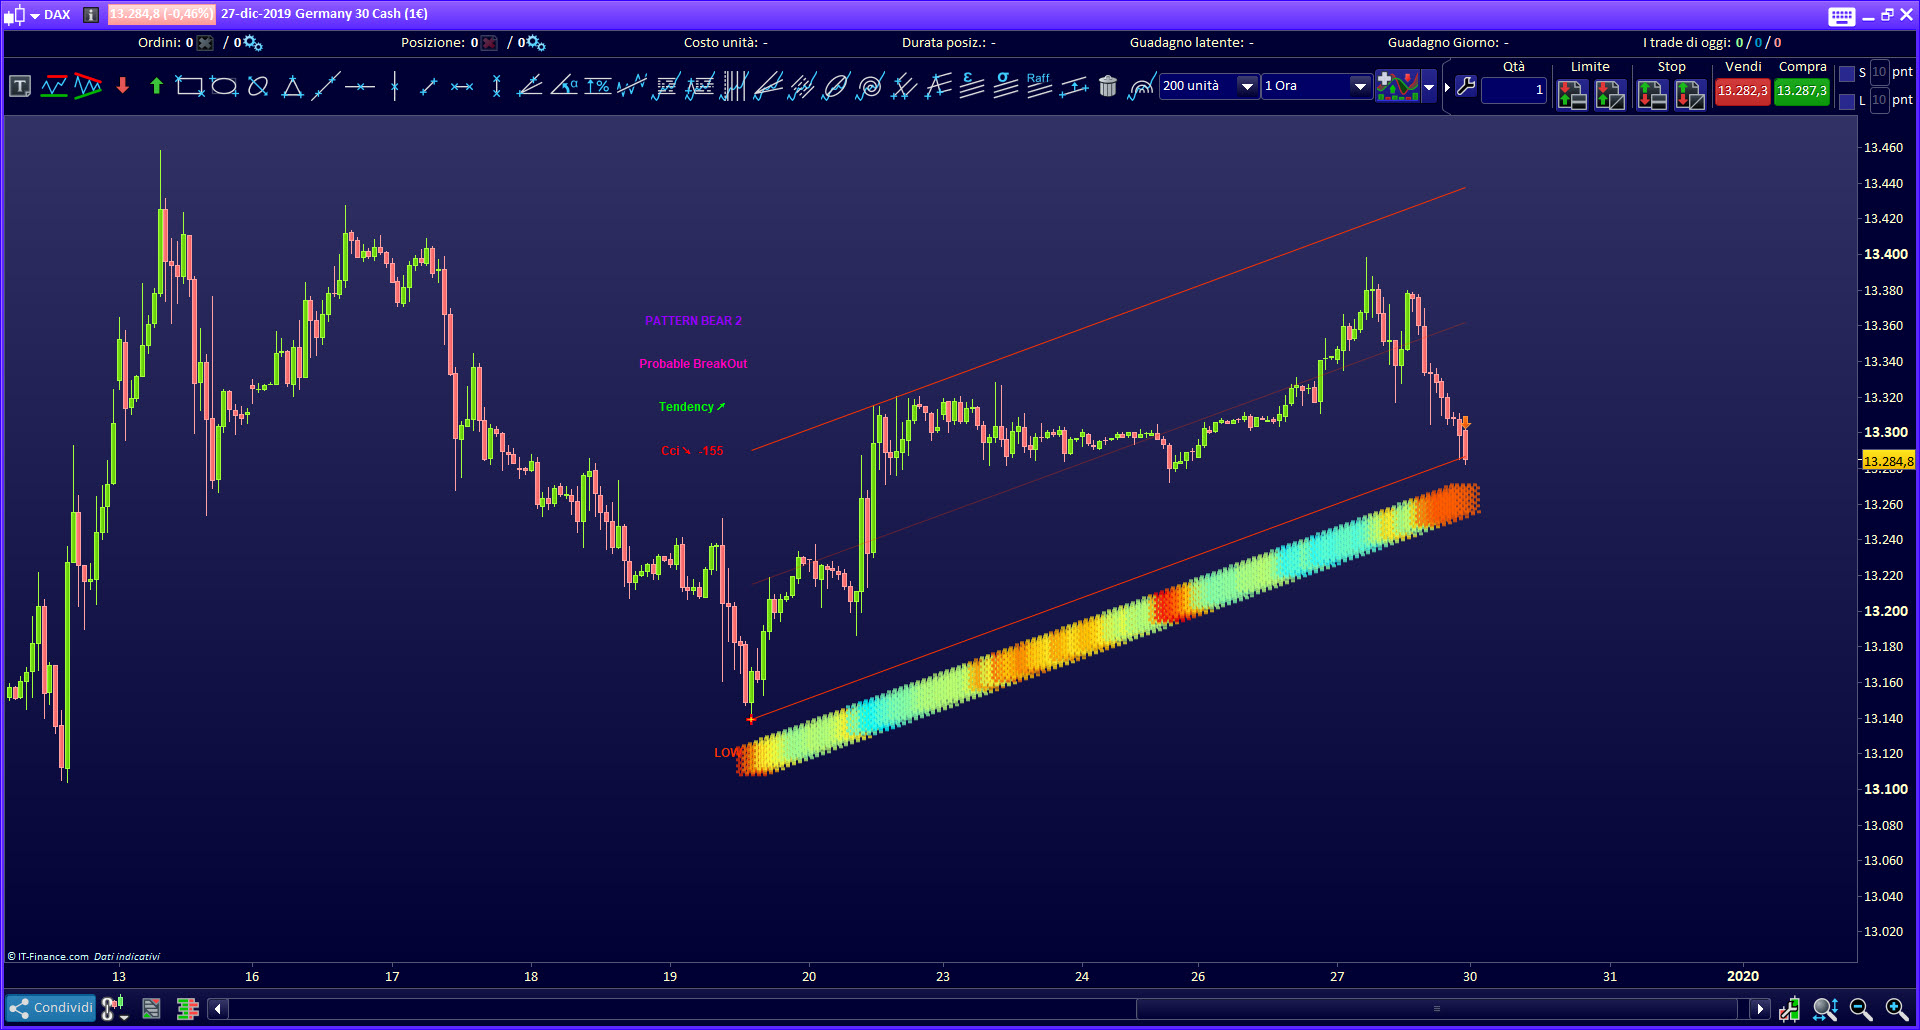
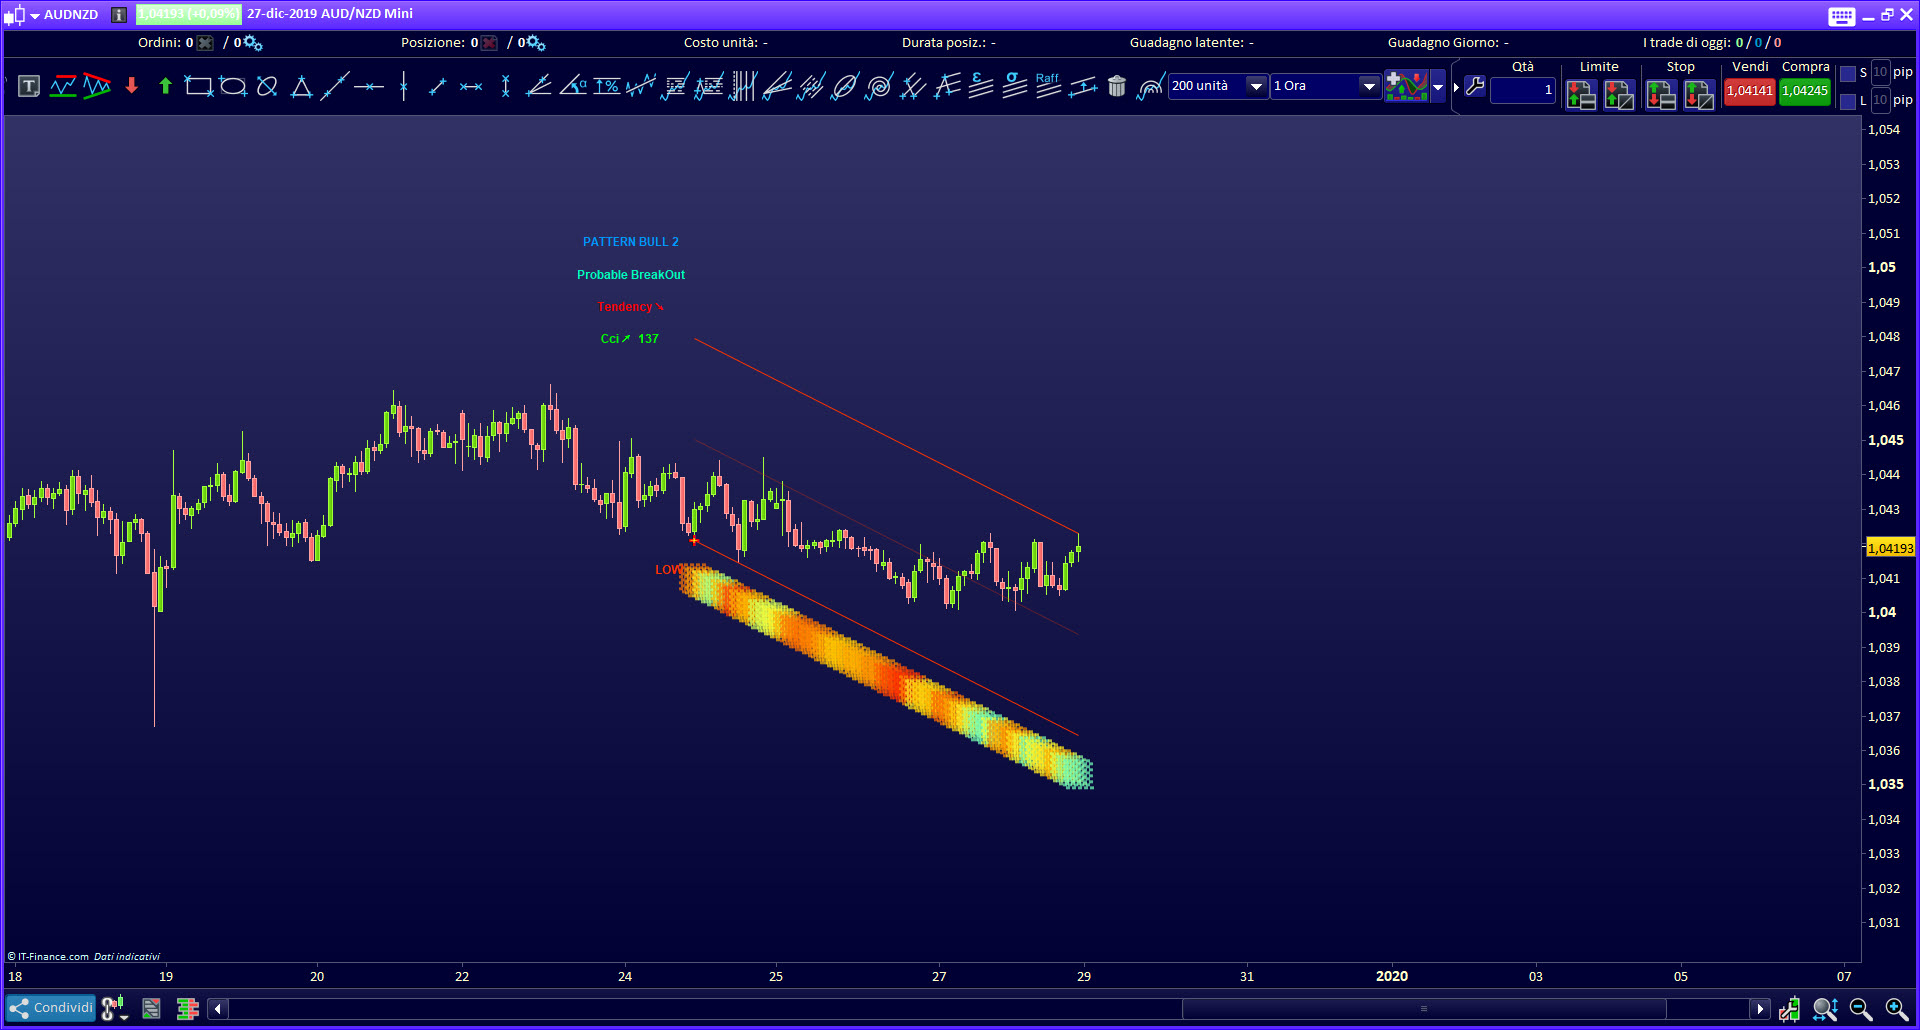
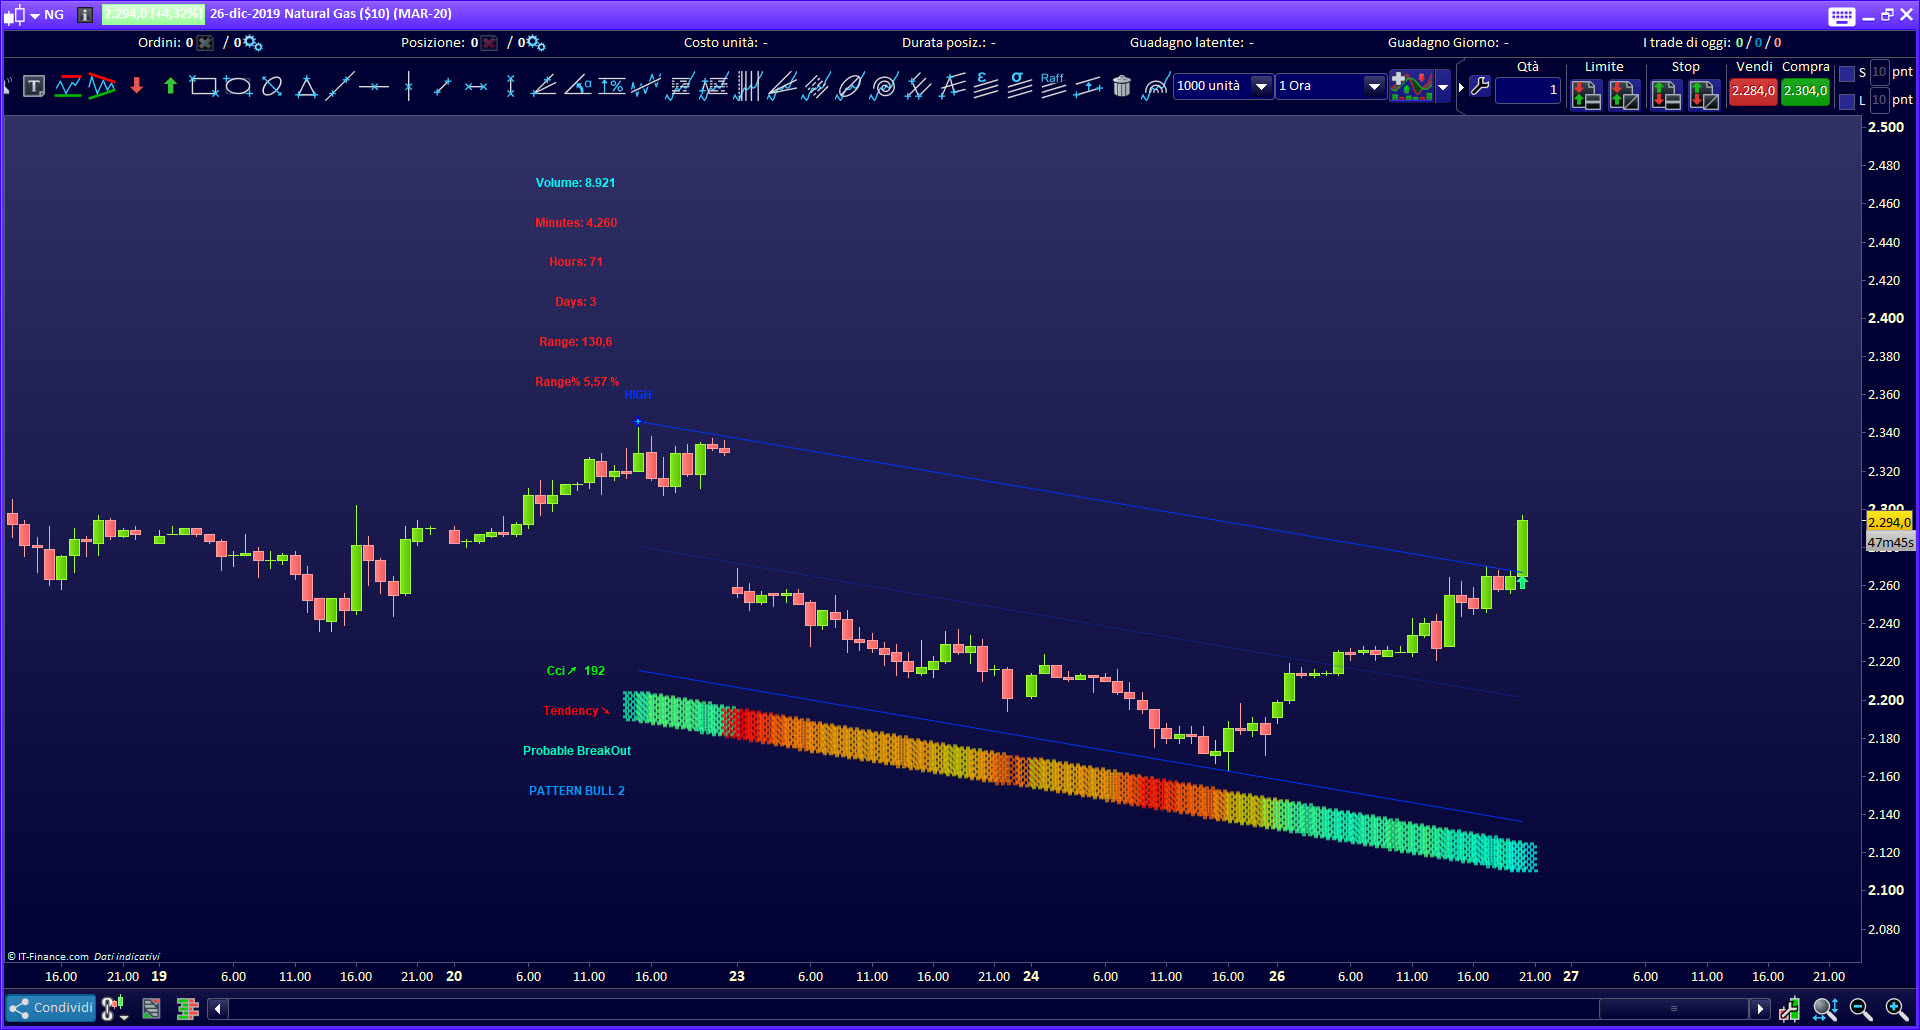
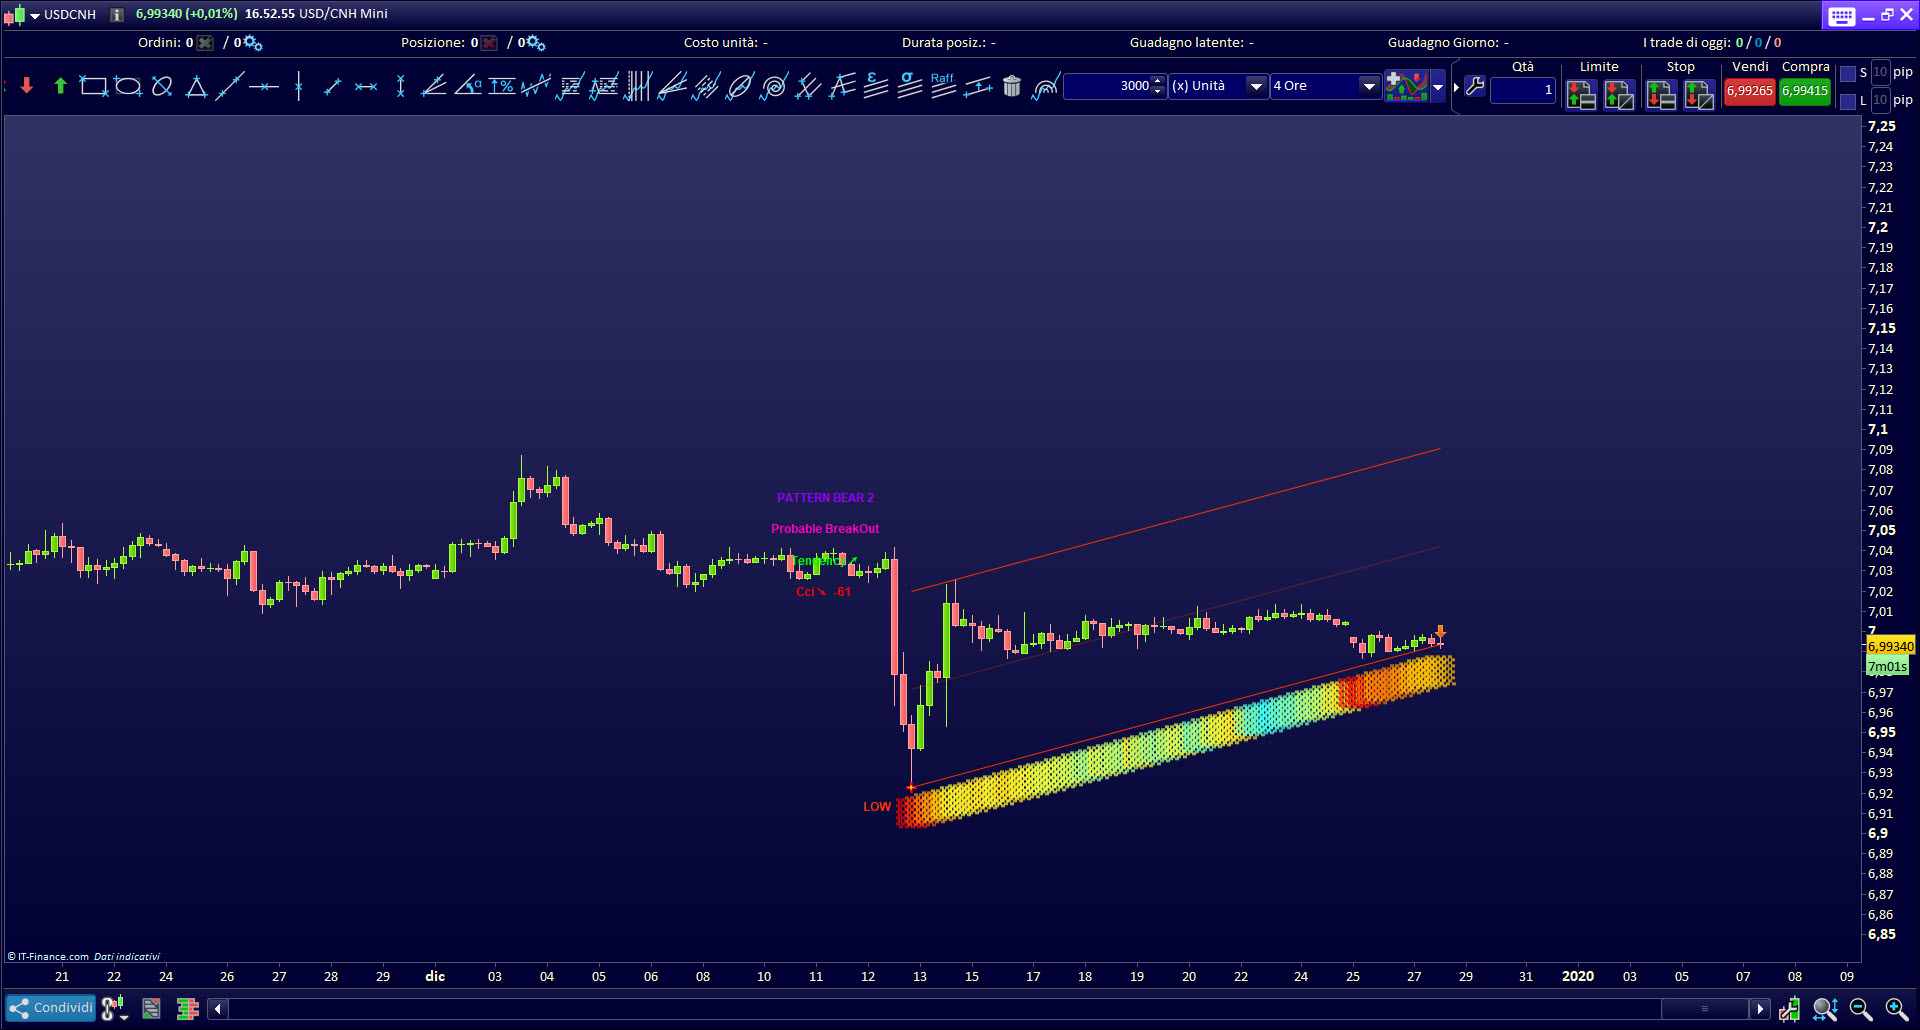
- Pattern2 : Detect Trend REVERSAL PATTERN as Probable breakOut in counterTrend
- ↗ Probable Bullish BreakOut and reversion. The channel is bearish
- ↘ Probable Bearish BreakOut and reversion. The channel is bullish
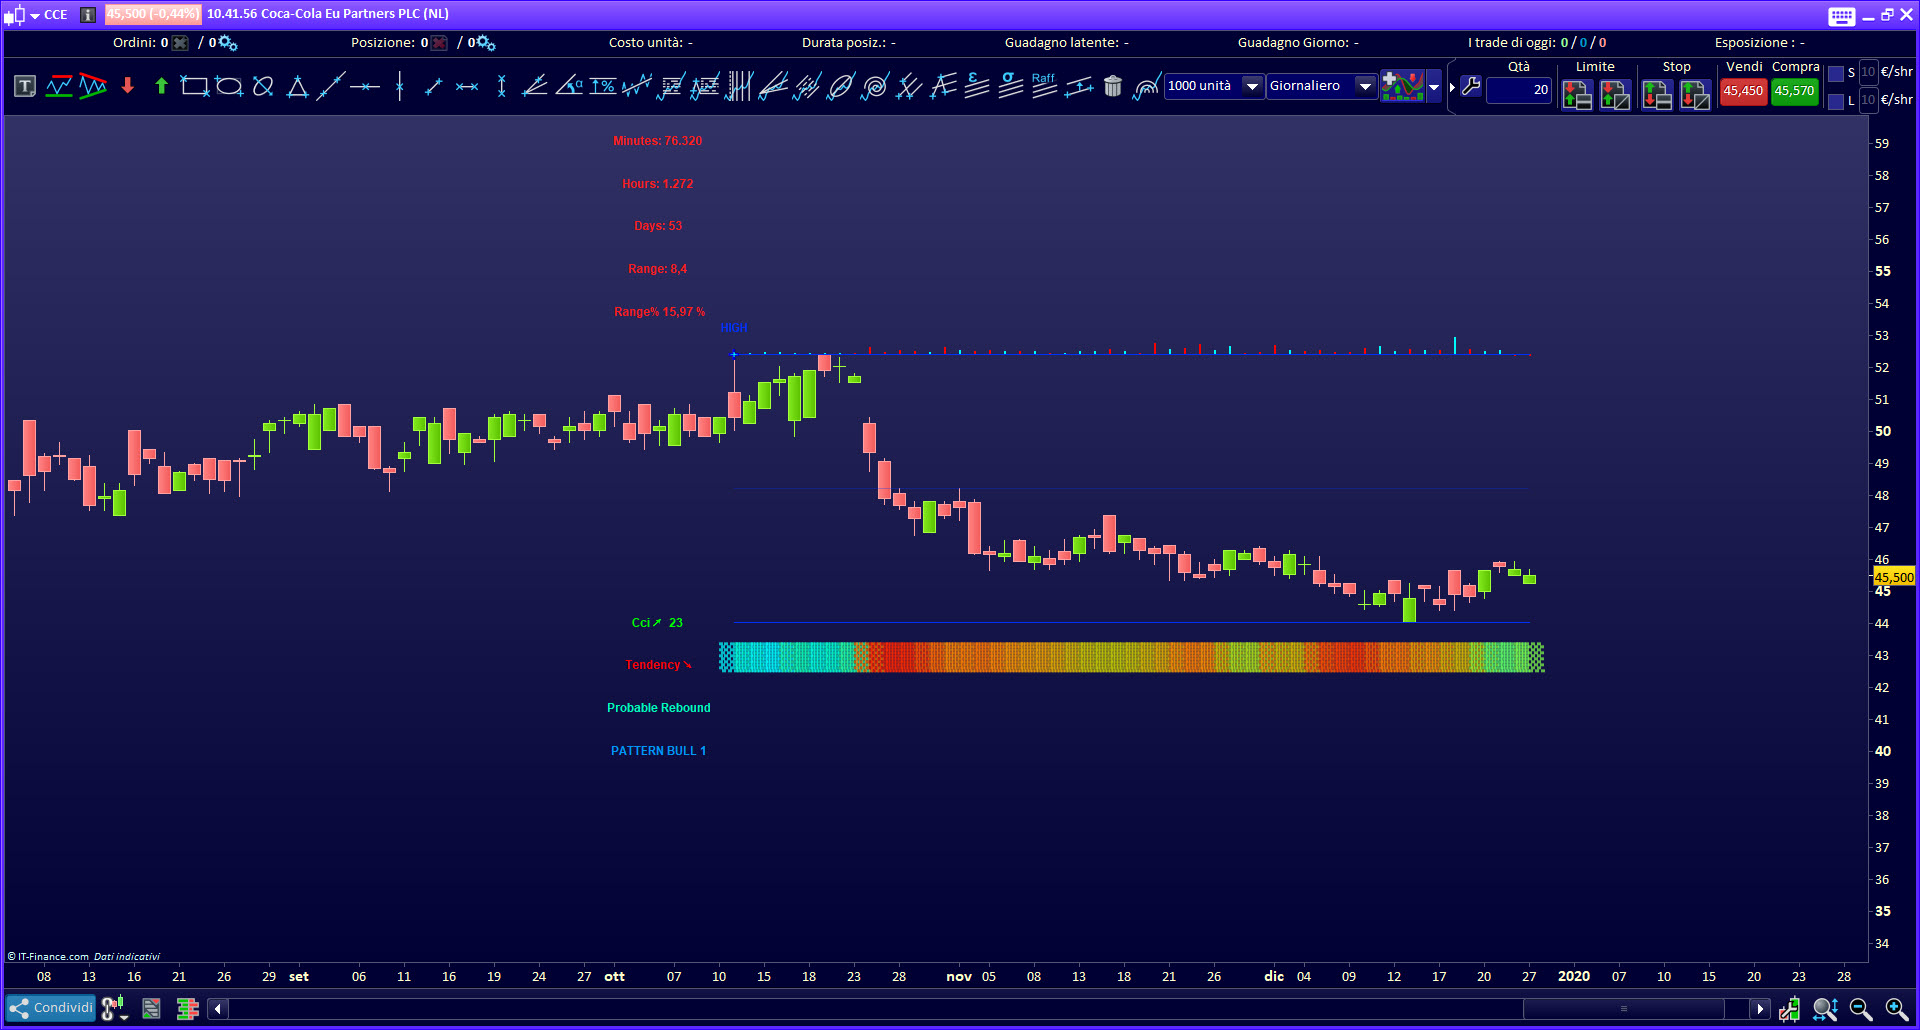
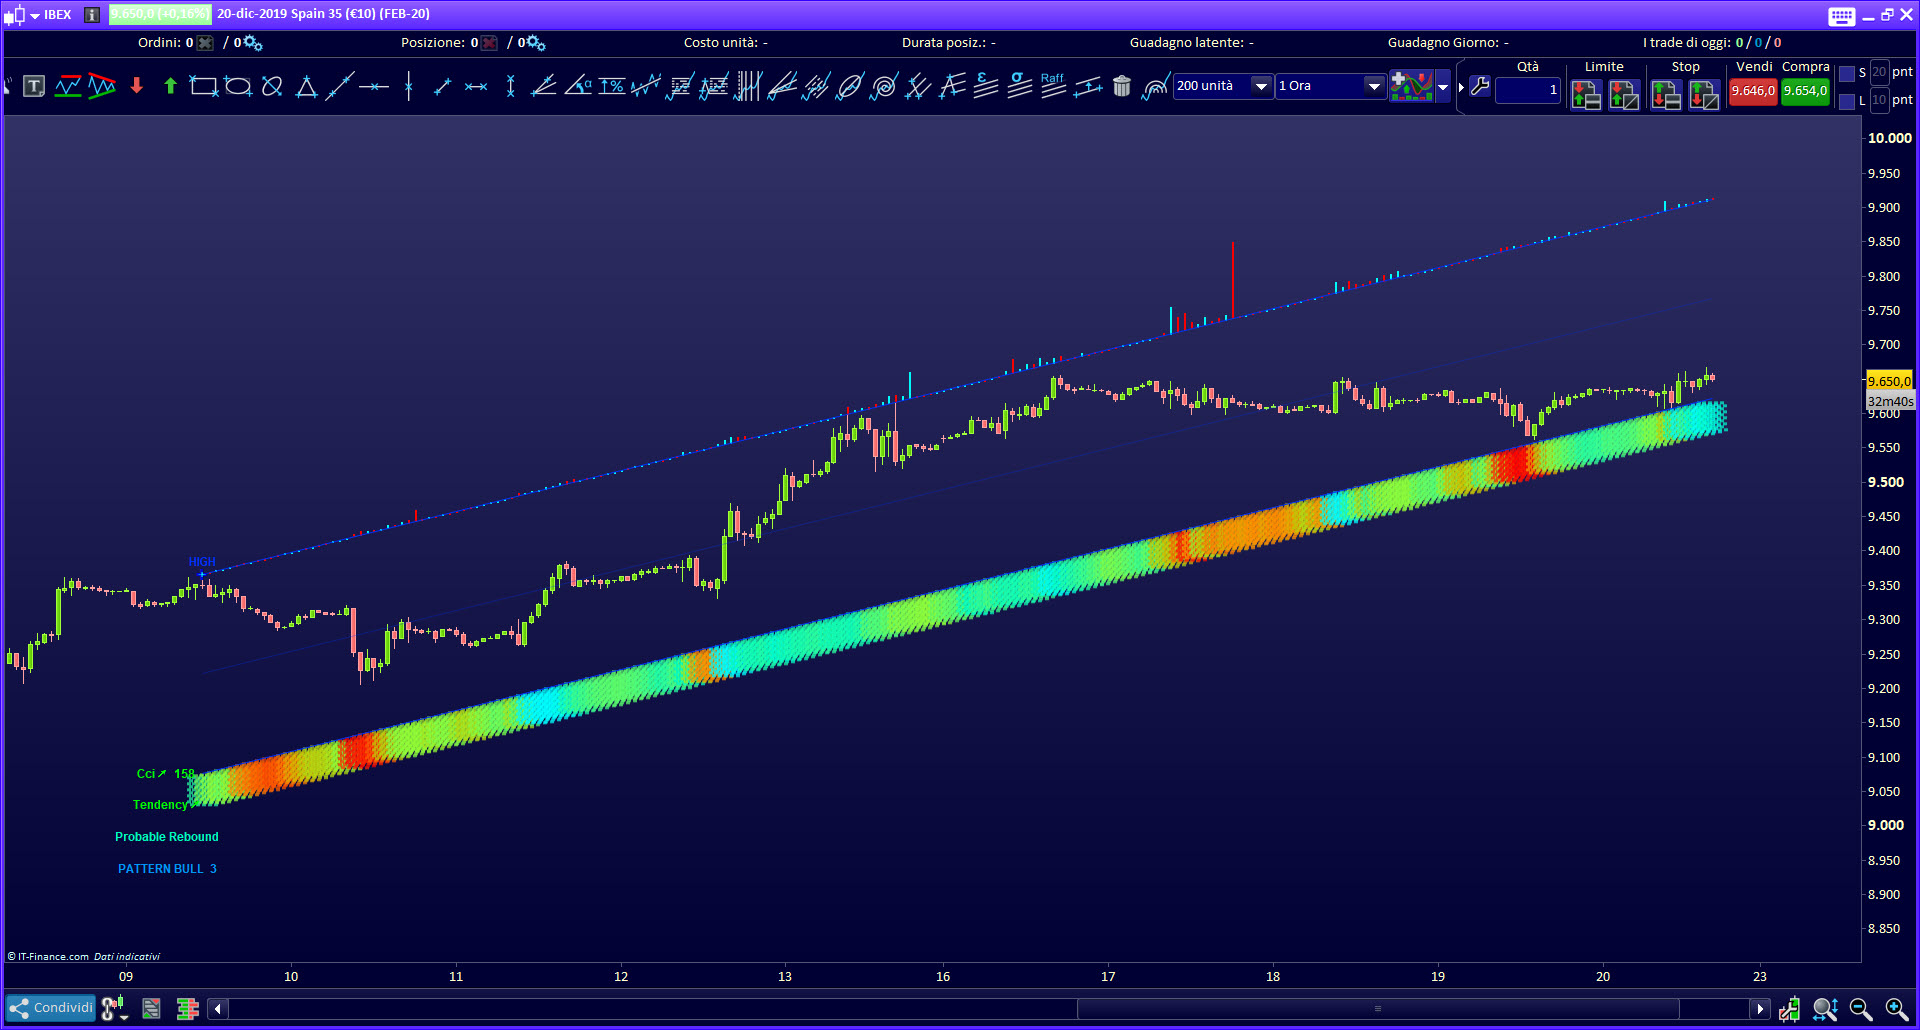
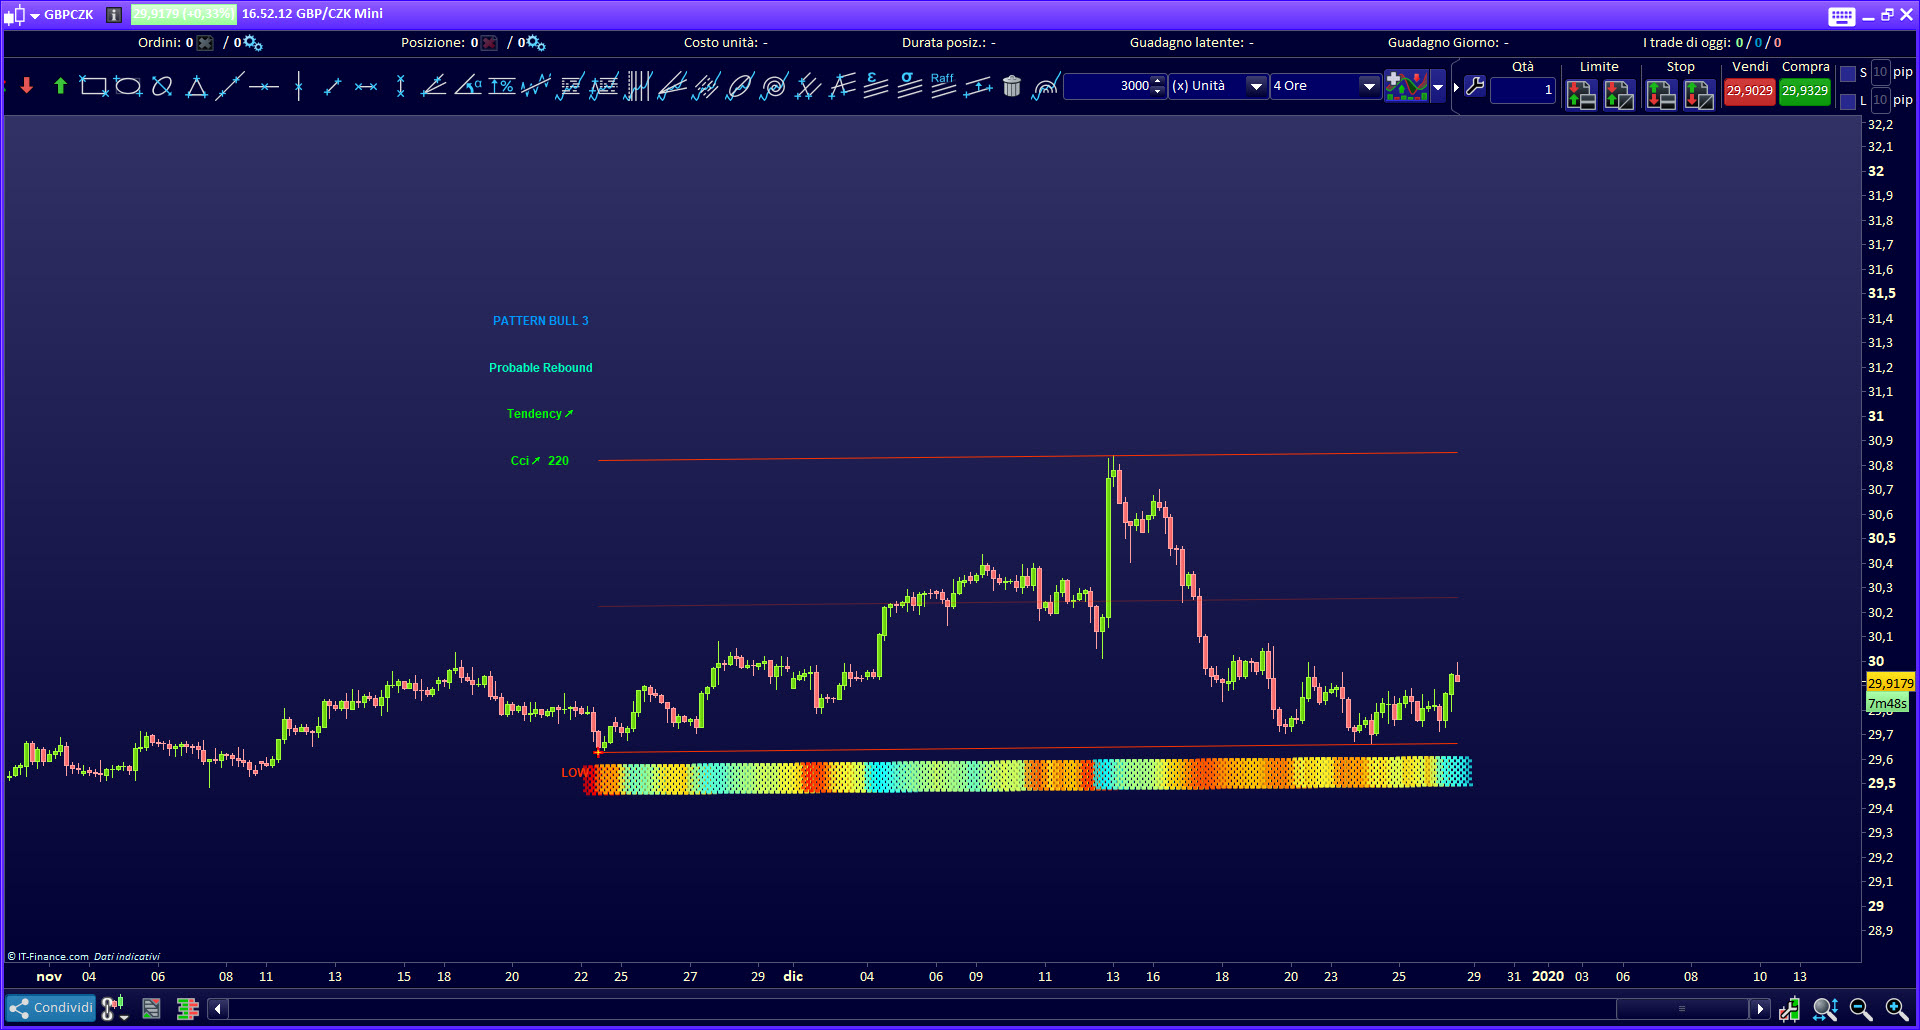
- Pattern3 : Detect Trend FOLLOWING PATTERN as Probable Rebound in Trend
- ↗ Probable Bullish Rebound. The channel is bullish
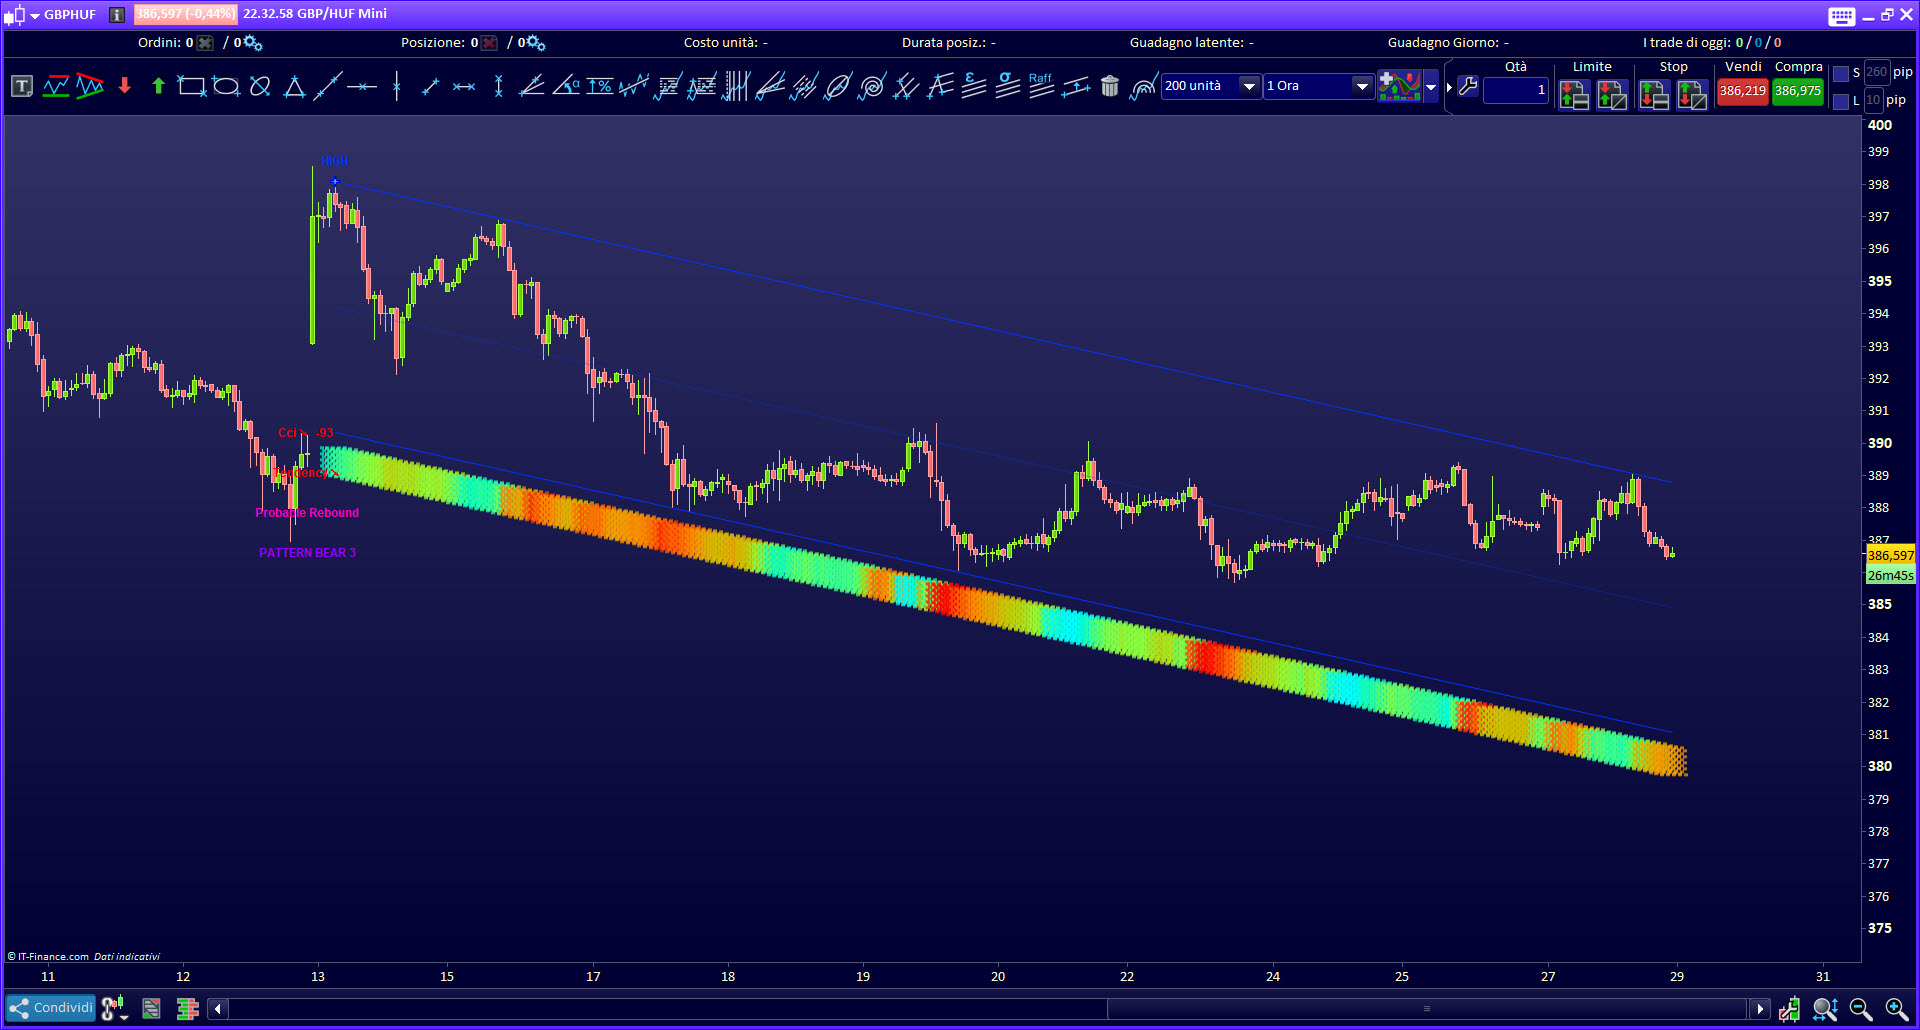
- ↘ Probable Bearish Rebound. The channel is bearish
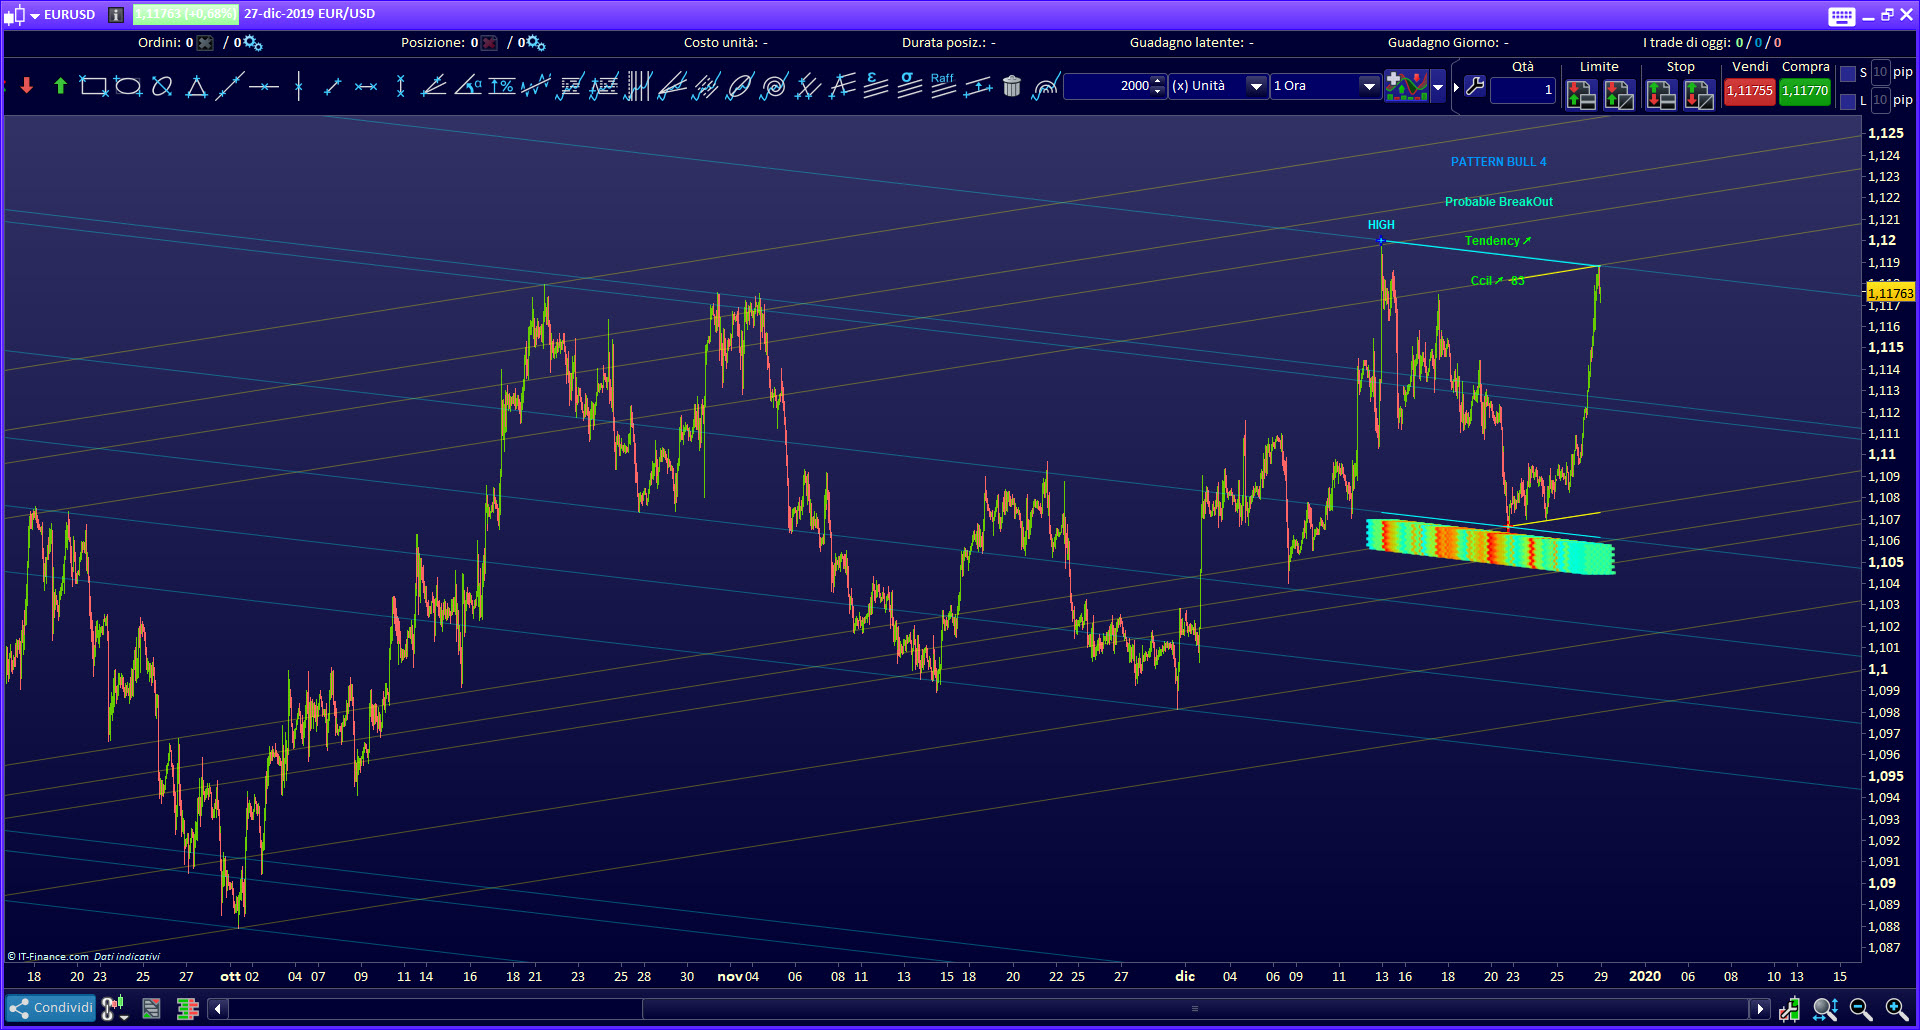
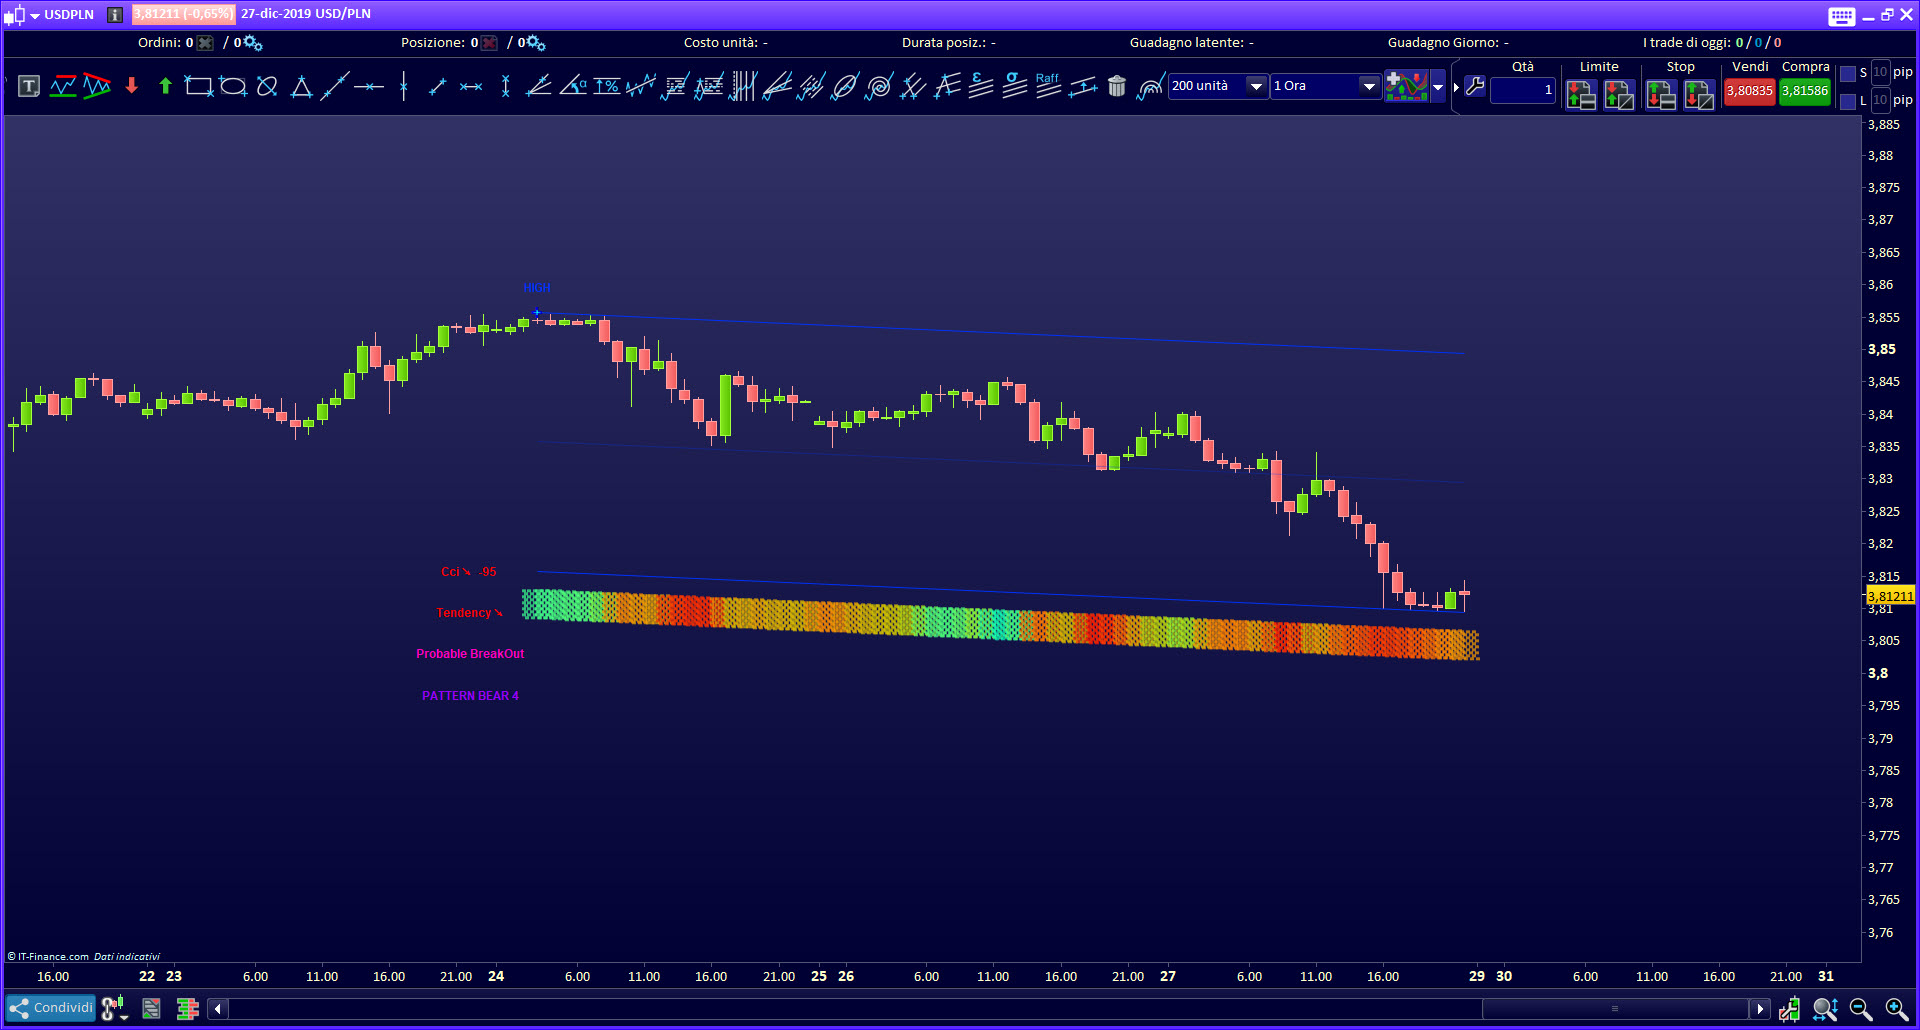
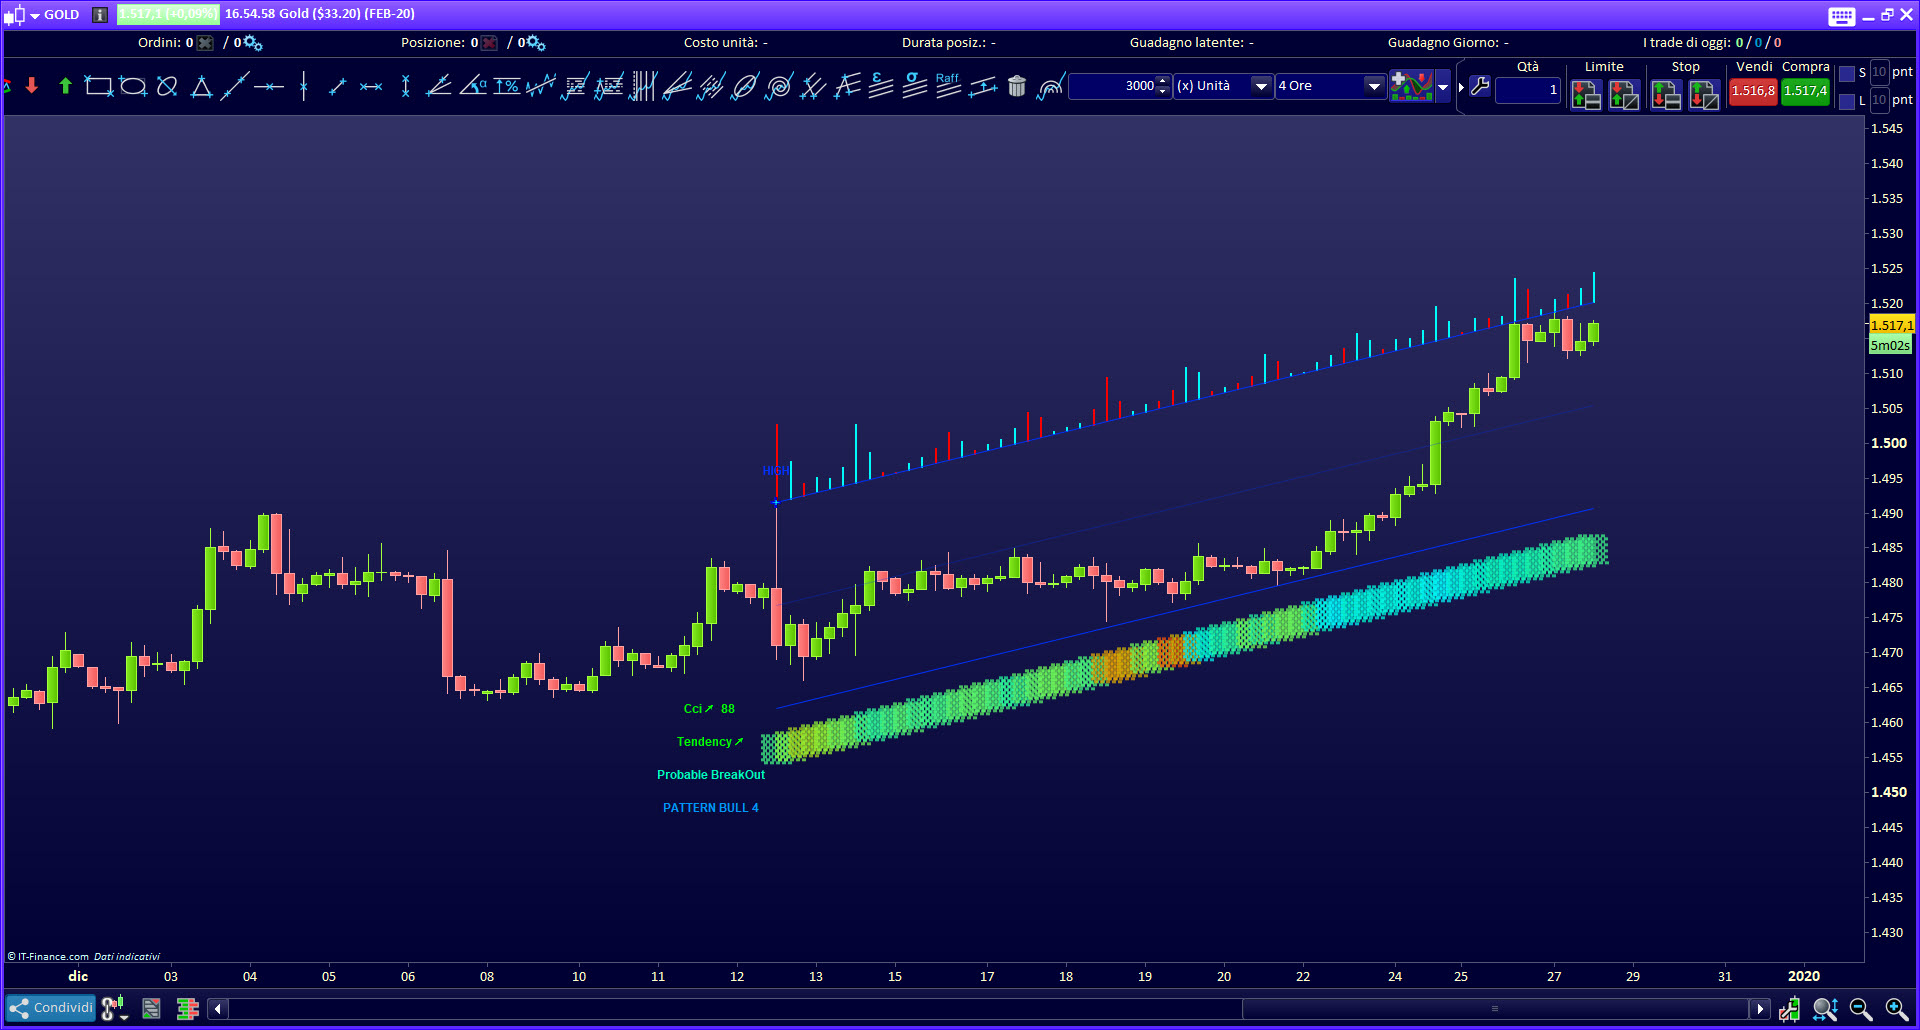
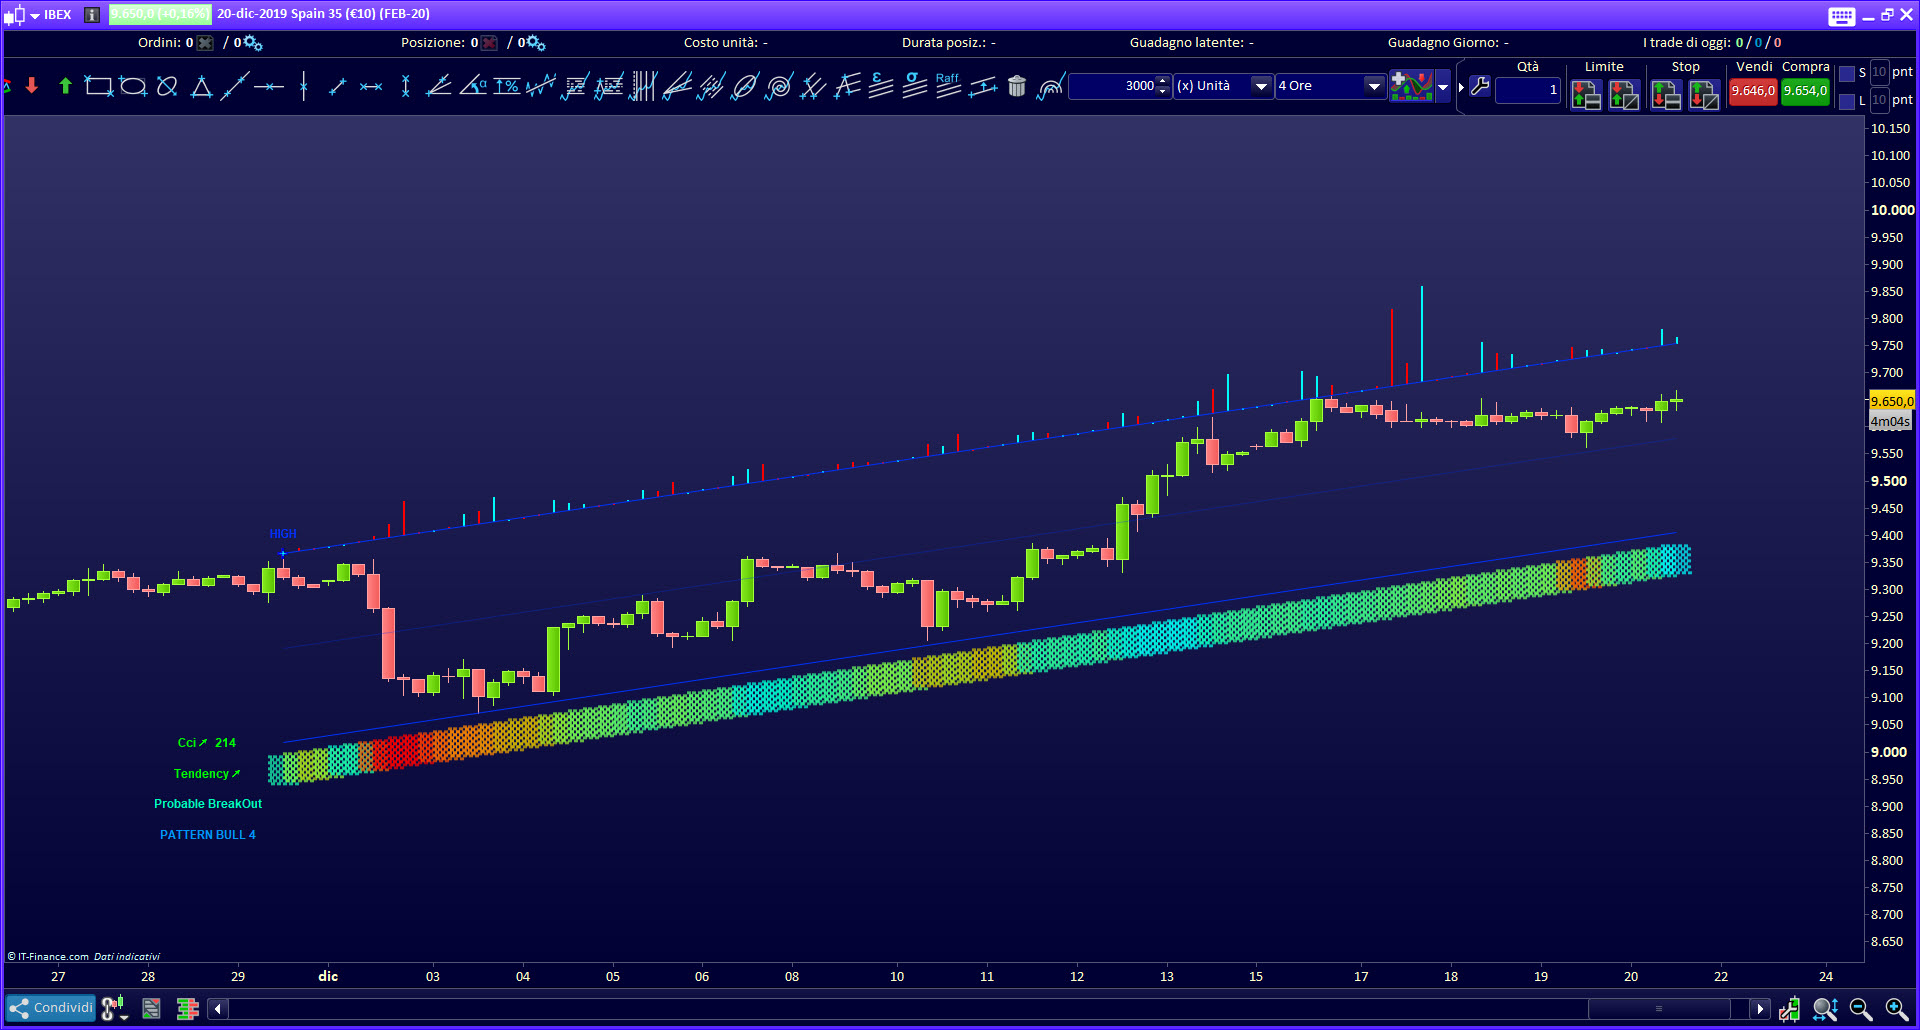
- Pattern4 :Detect Trend FOLLOWING PATTERN as Probable breakOut in Trend
- ↗ Probable Bullish BreakOut and Continuation. The channel is bullish
- ↘ Probable Bearish BreakOut and Continuation. The channel is bearish
All the following patterns are available in the screener’s indicator
PATTERN n° 1
-
- Pattern 1 Bear
-

- Pattern 1 Bull
-
- Pattern 1 Bear
-
- Pattern 1 Bull
PATTERN n° 2
-
- Pattern n.2 Bear
-
- Pattern n.2 Bull
-
- Pattern n.2 Bear
-
- Pattern n.2 Bull
PATTERN n° 3
-
- Pattern n.3 Bear
-
- Pattern n.3 Bull
-
- Pattern n.3 Bear
-
- Pattern n.3 Bull
PATTERN n° 4
-
- Pattern n.4 Bear
-
- Pattern n.4 Bull
-

- Pattern n.4 Bear
-
- Pattern n.4 Bull
PATTERN n° 0
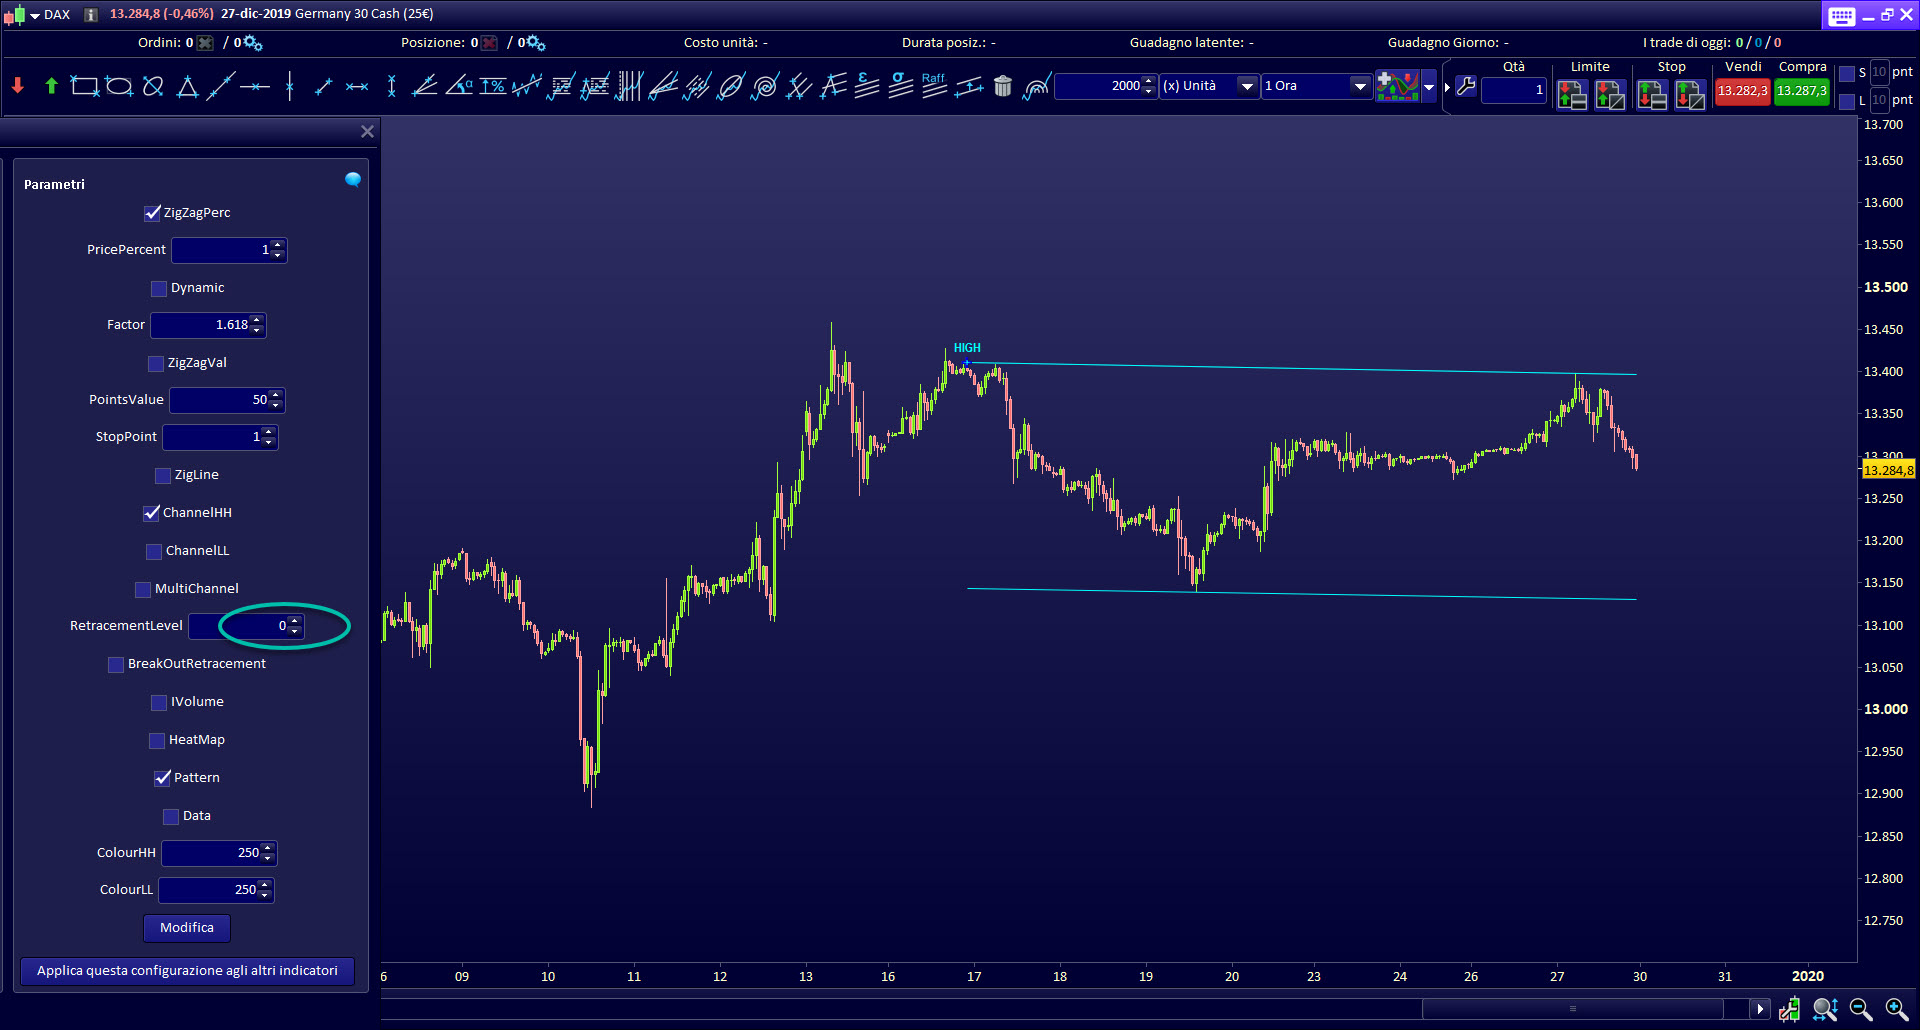
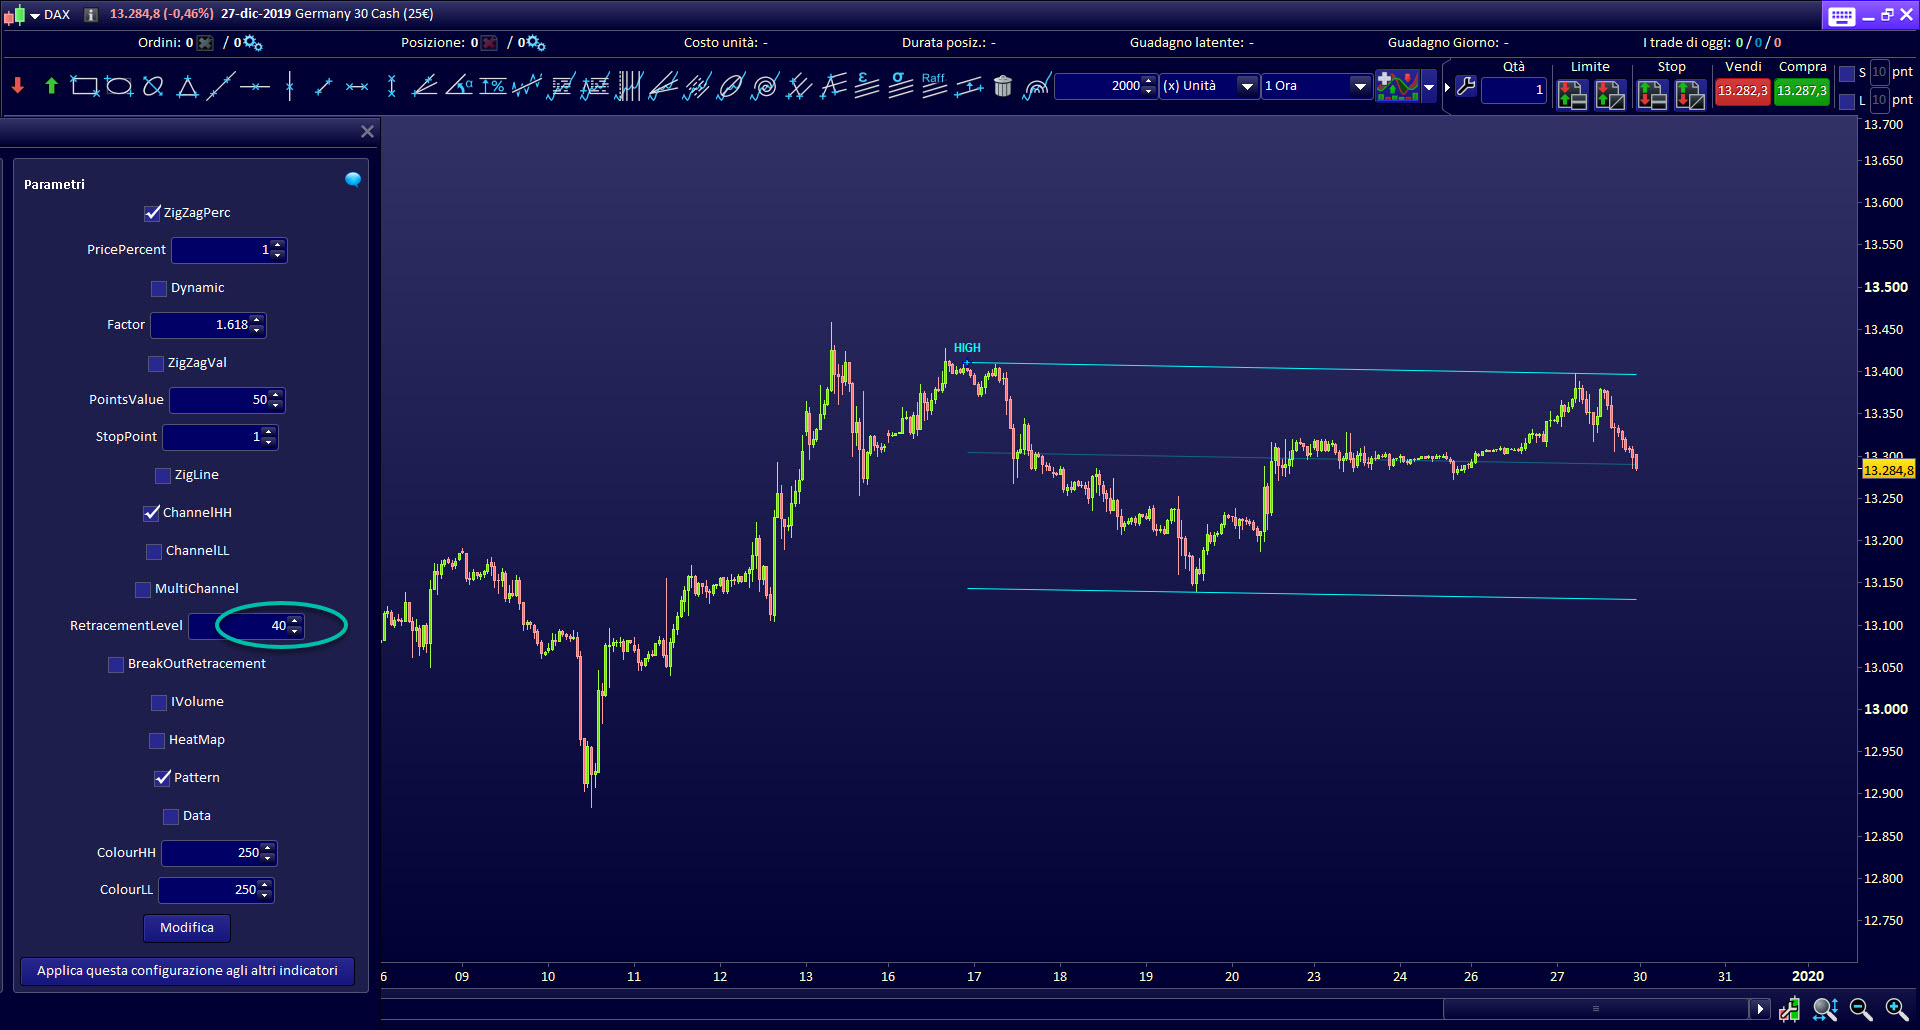
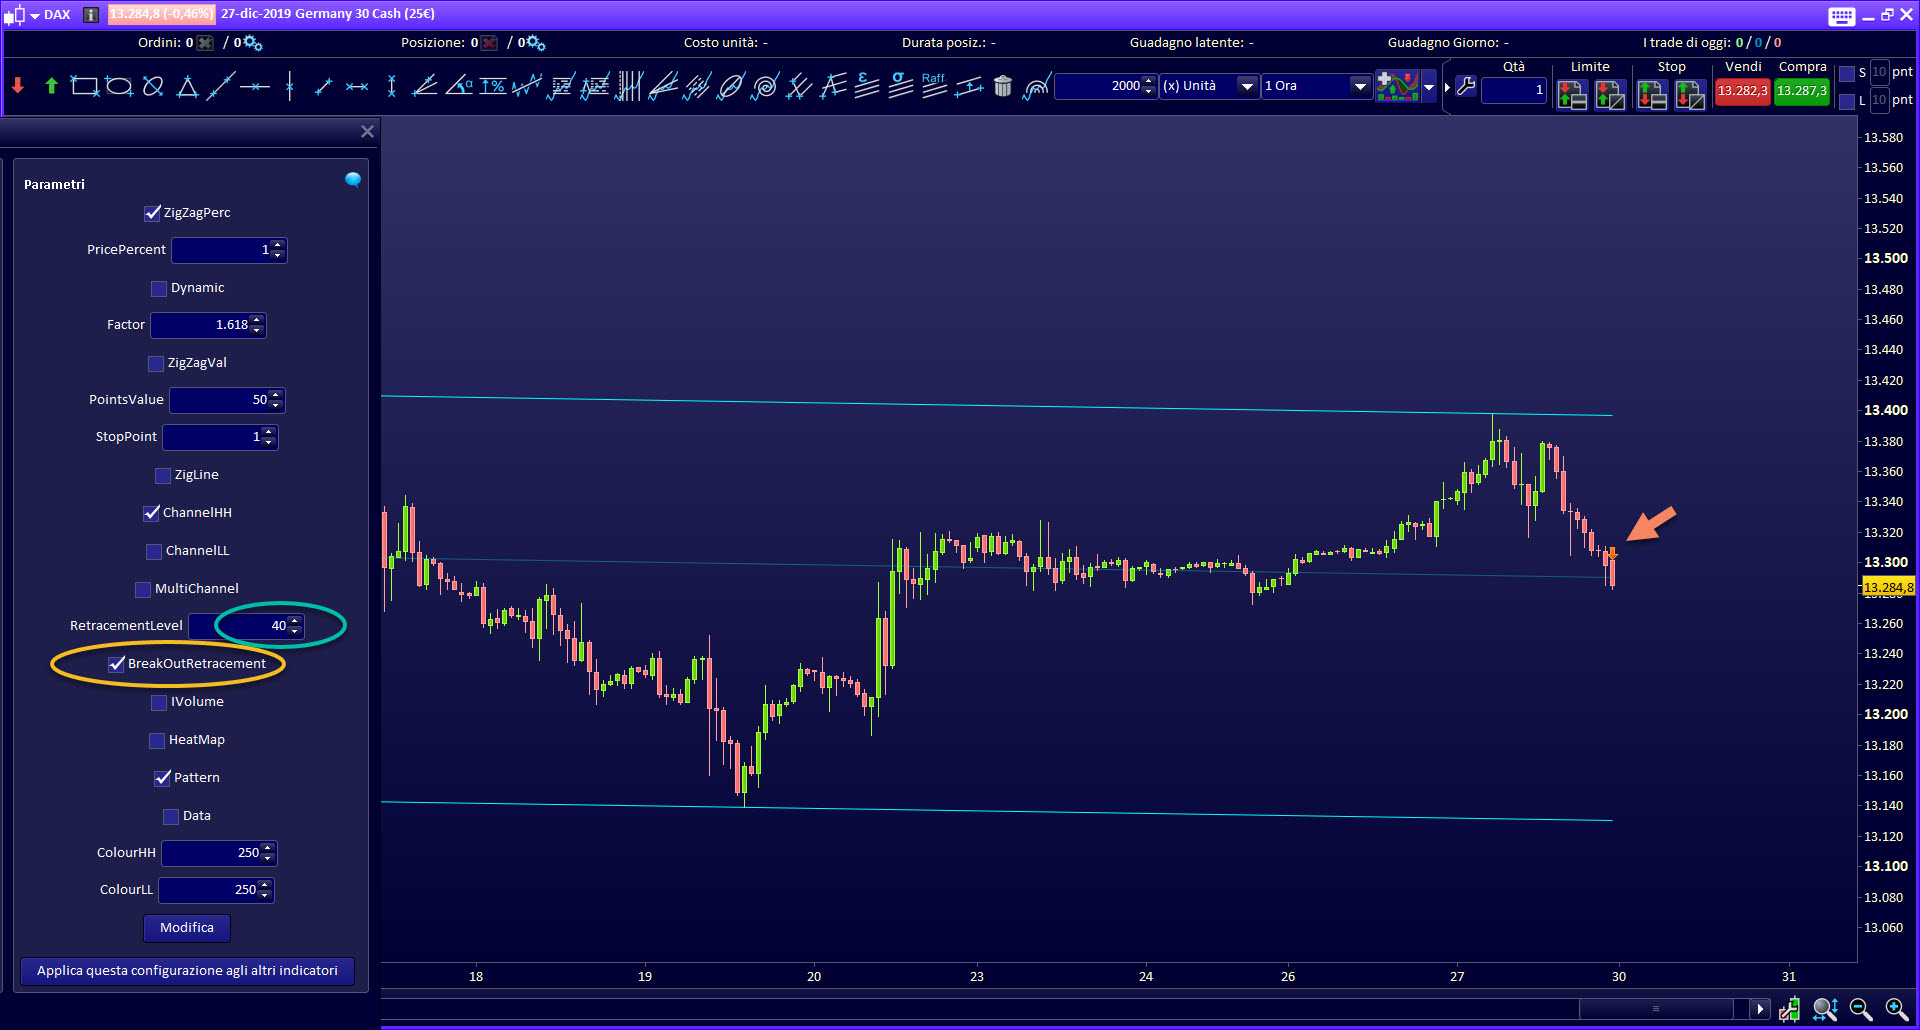
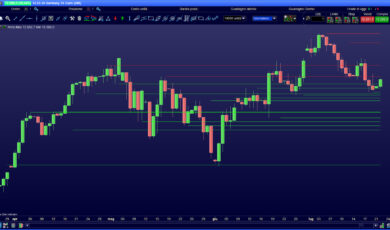
RETRACEMENT and BREAKOUT RETRACEMENT
The retracement function allows you to plot the trend line on the graph for the chosen percentage retracement. It works like the Fibonacci channel, and Fibonacci values can also be used.
If the BreakOutRetracement function is active, if the price performs a BreakOut, a signal will be generated.
This function is also available in the screener.
-
- TechChannel indicator Retracement
-
- TechChannel indicator Retracement
-
- TechChannel indicator Retracement
-
- TechChannel indicator Retracement
-

- TechChannel indicator Retracement
-

- TechChannel indicator Retracement
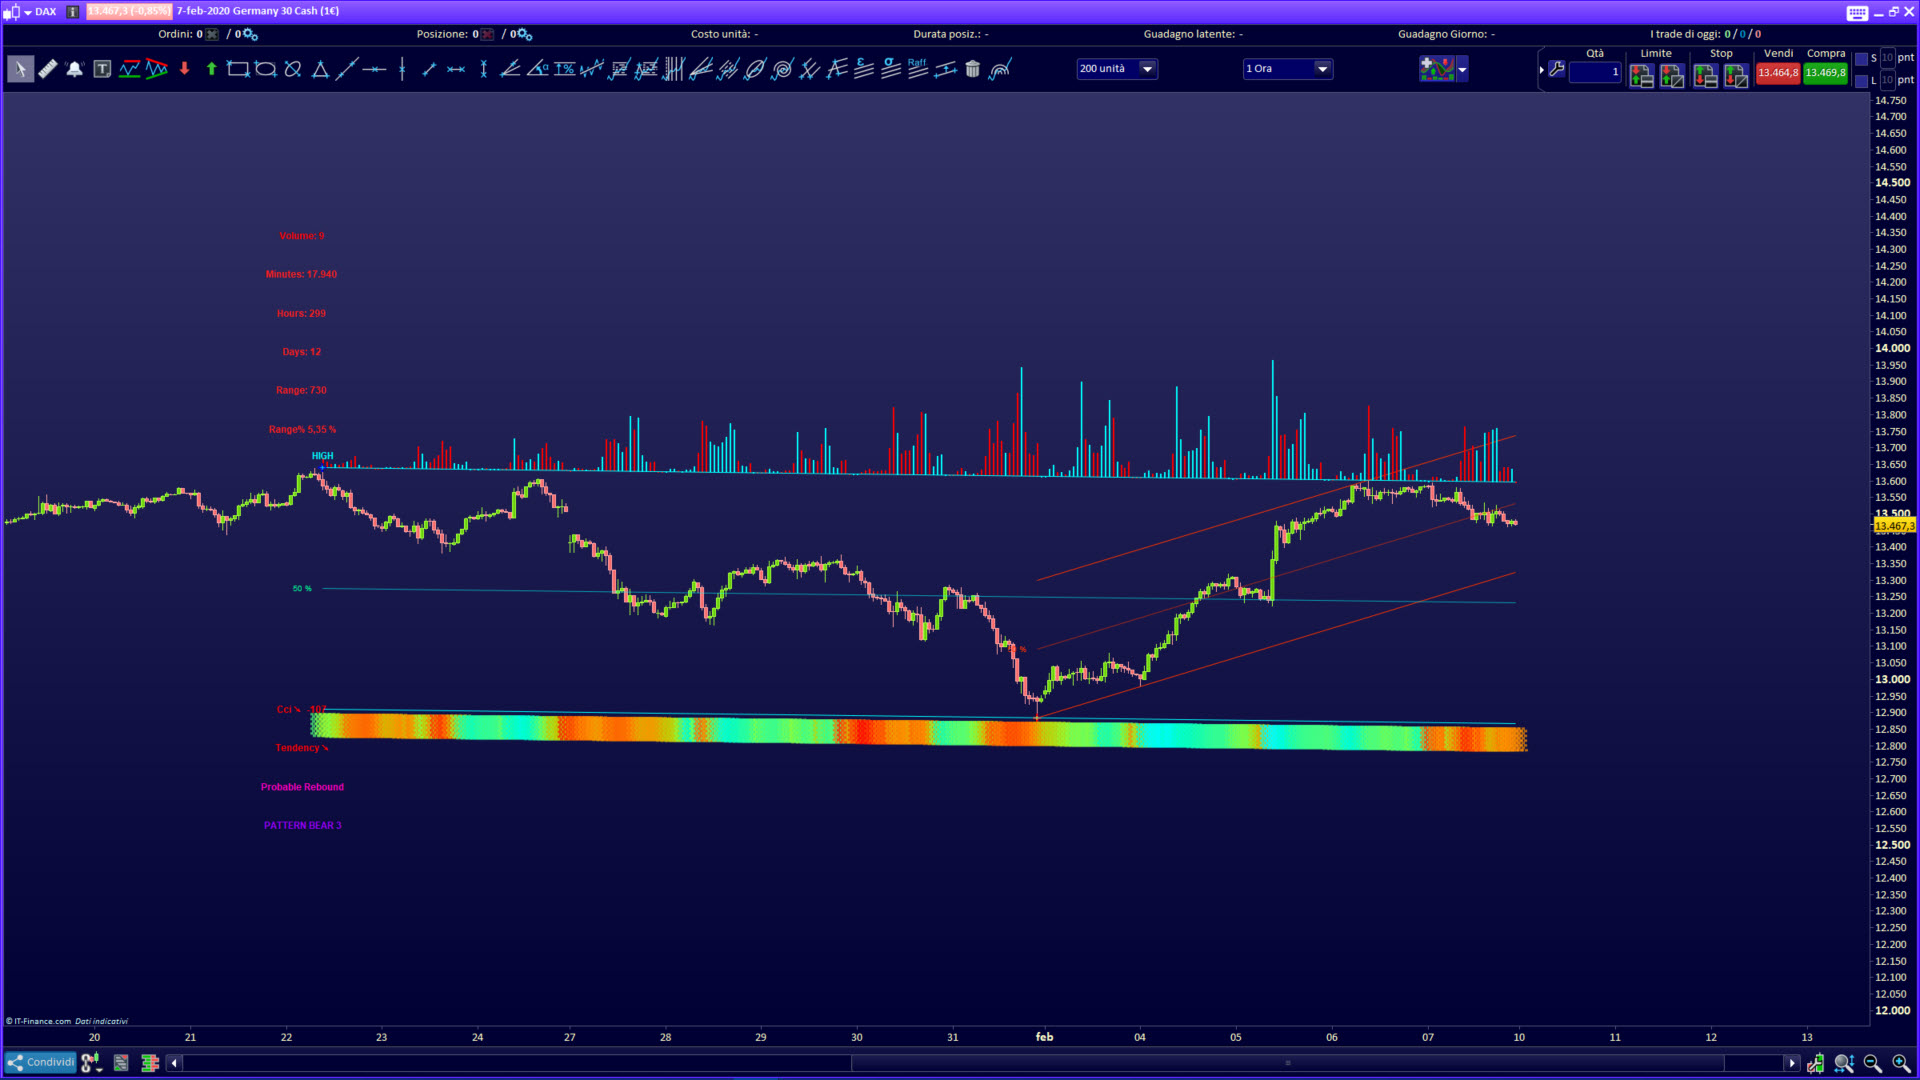
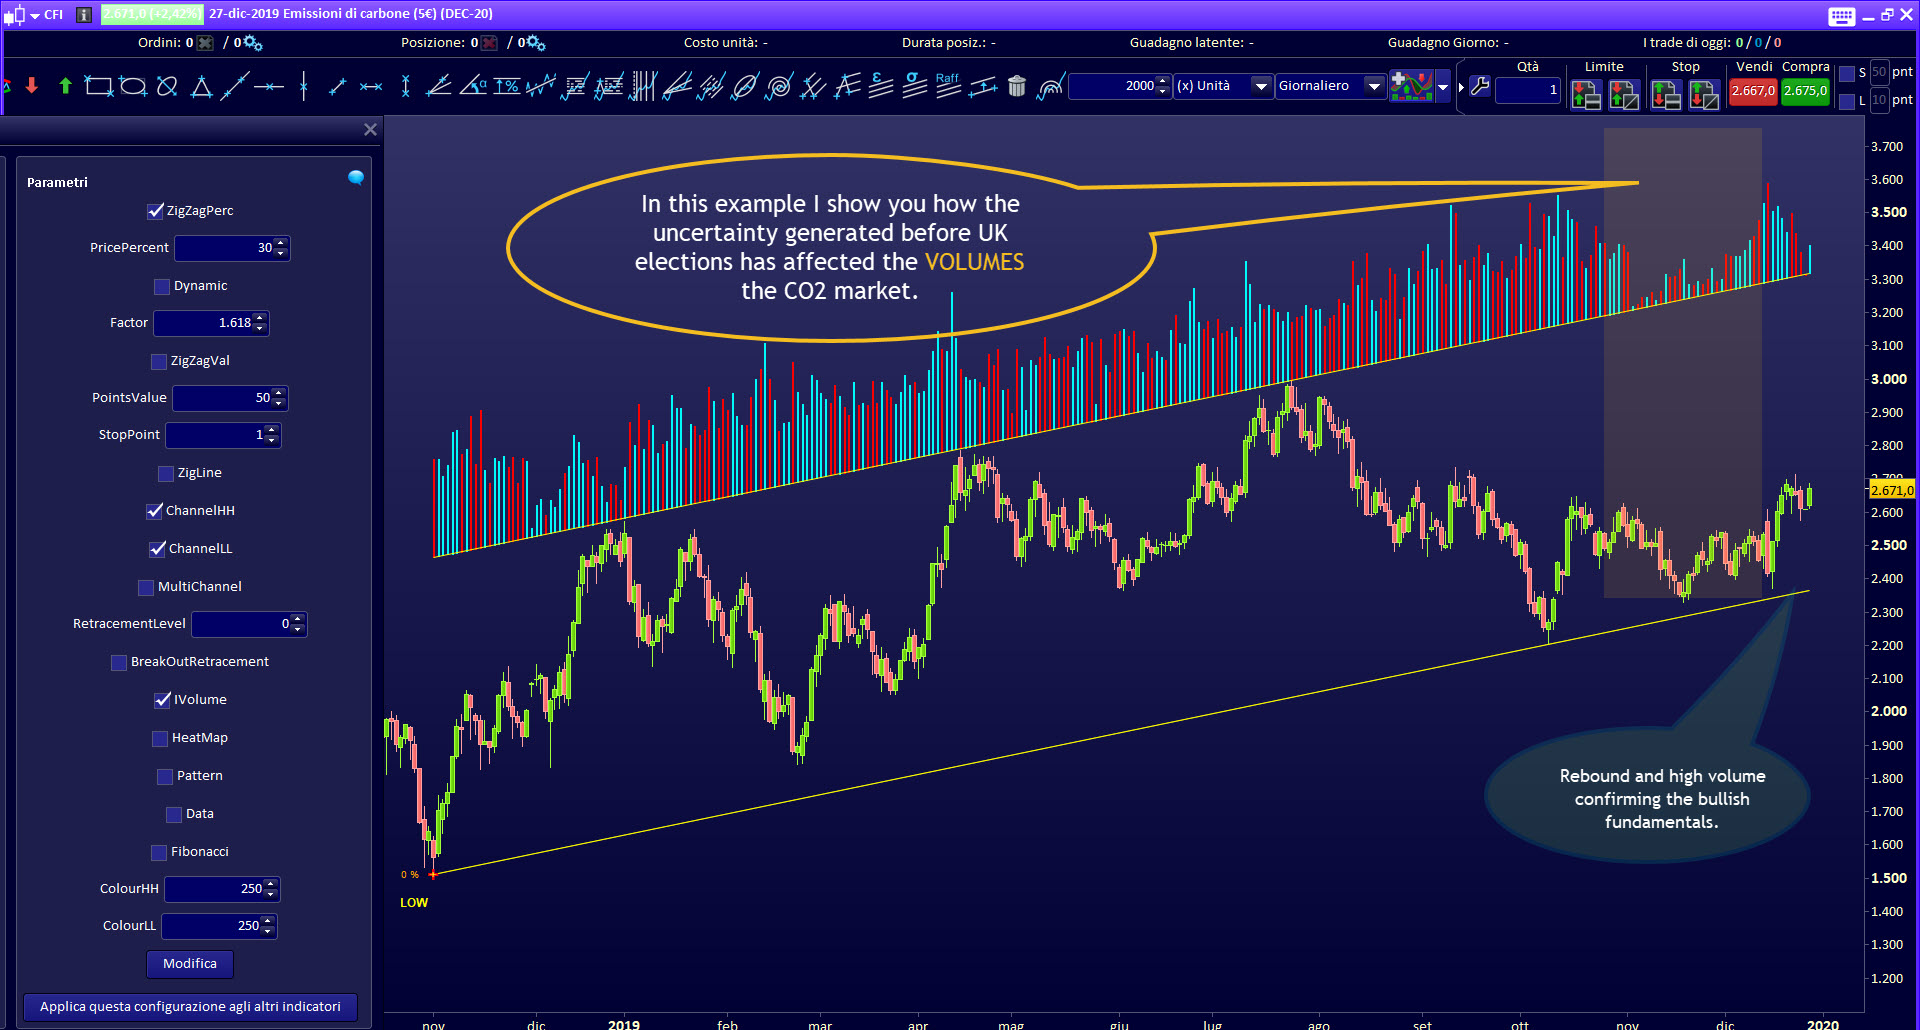
I-VOLUME
The I-Volume function allows you to trace the volume histogram on the top trend line.
It is good to remember that volumes are a fundamental indication for understanding market movements. Volumes don’t work very well for stock market indices, but they are very useful on
Commodity markets, and on individual stocks.
-
- TechChannel indicator Volume
-
- TechChannel indicator Volume
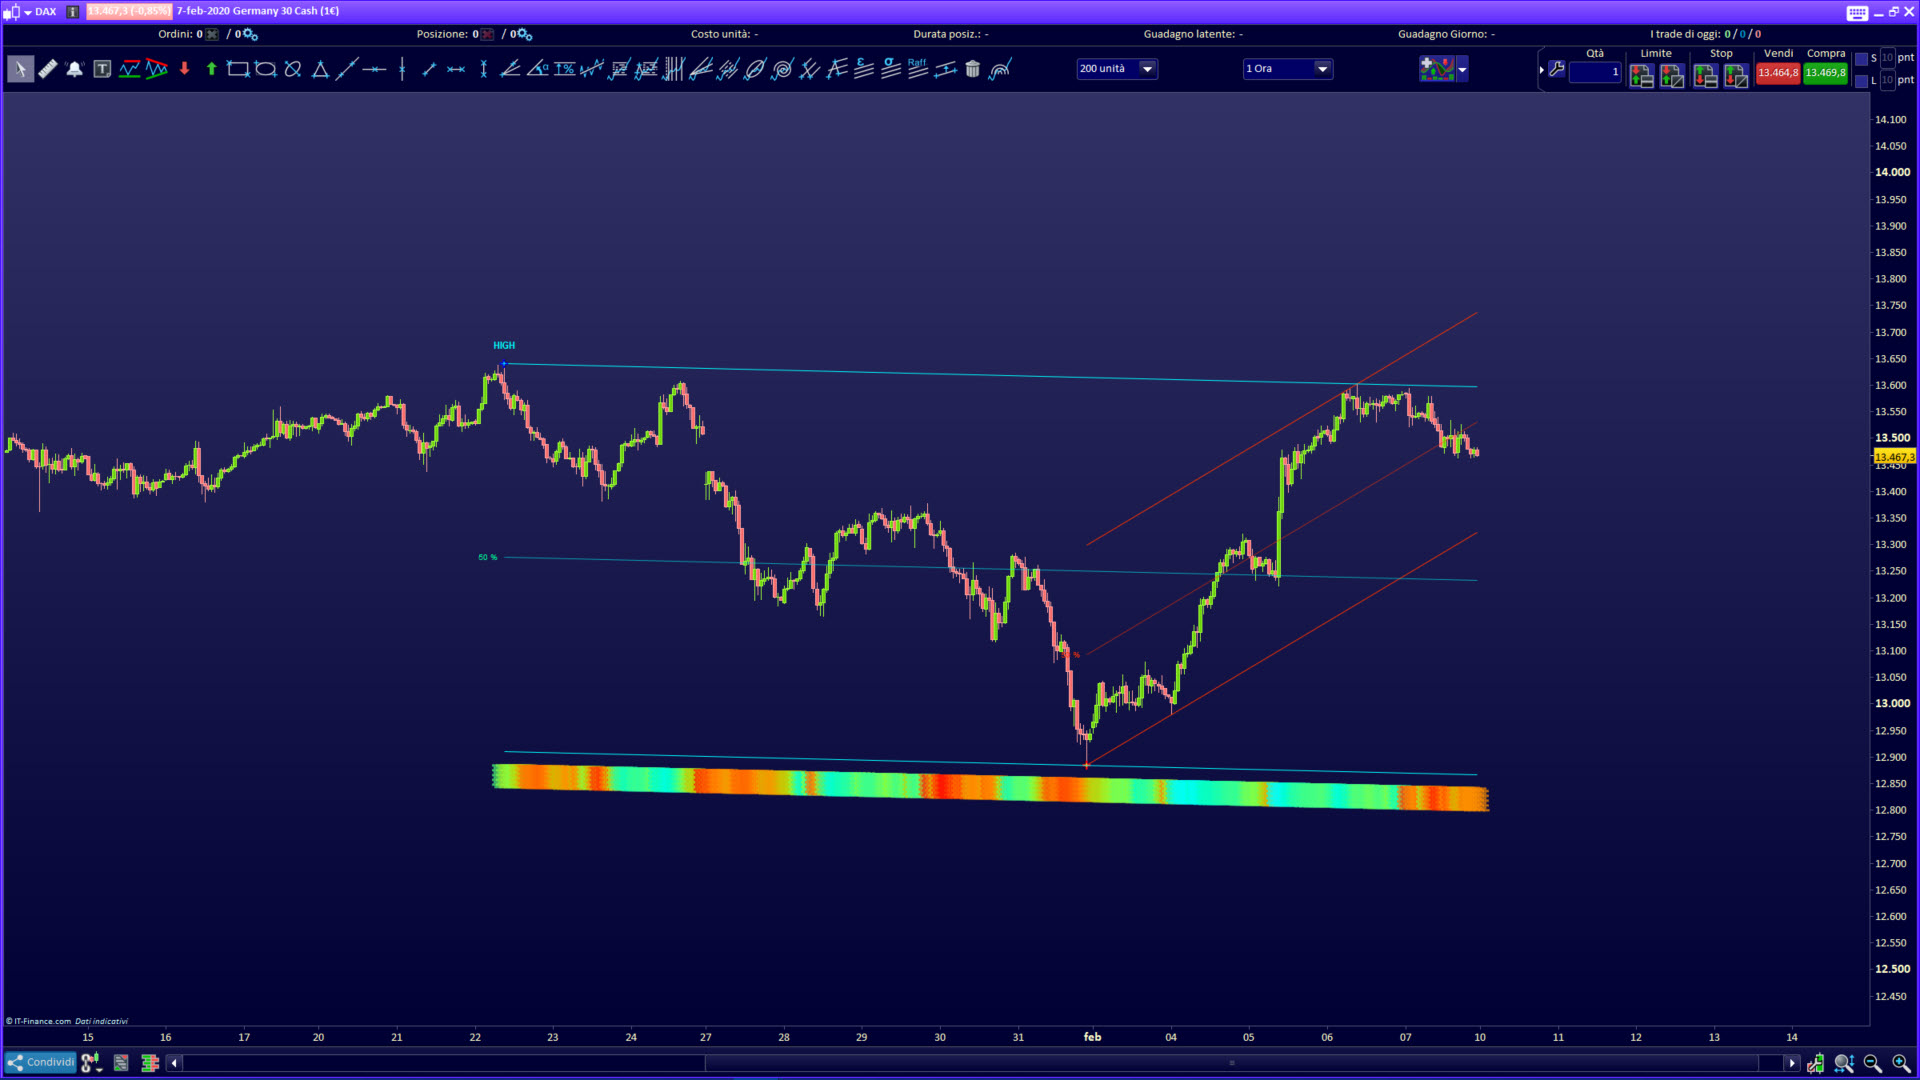
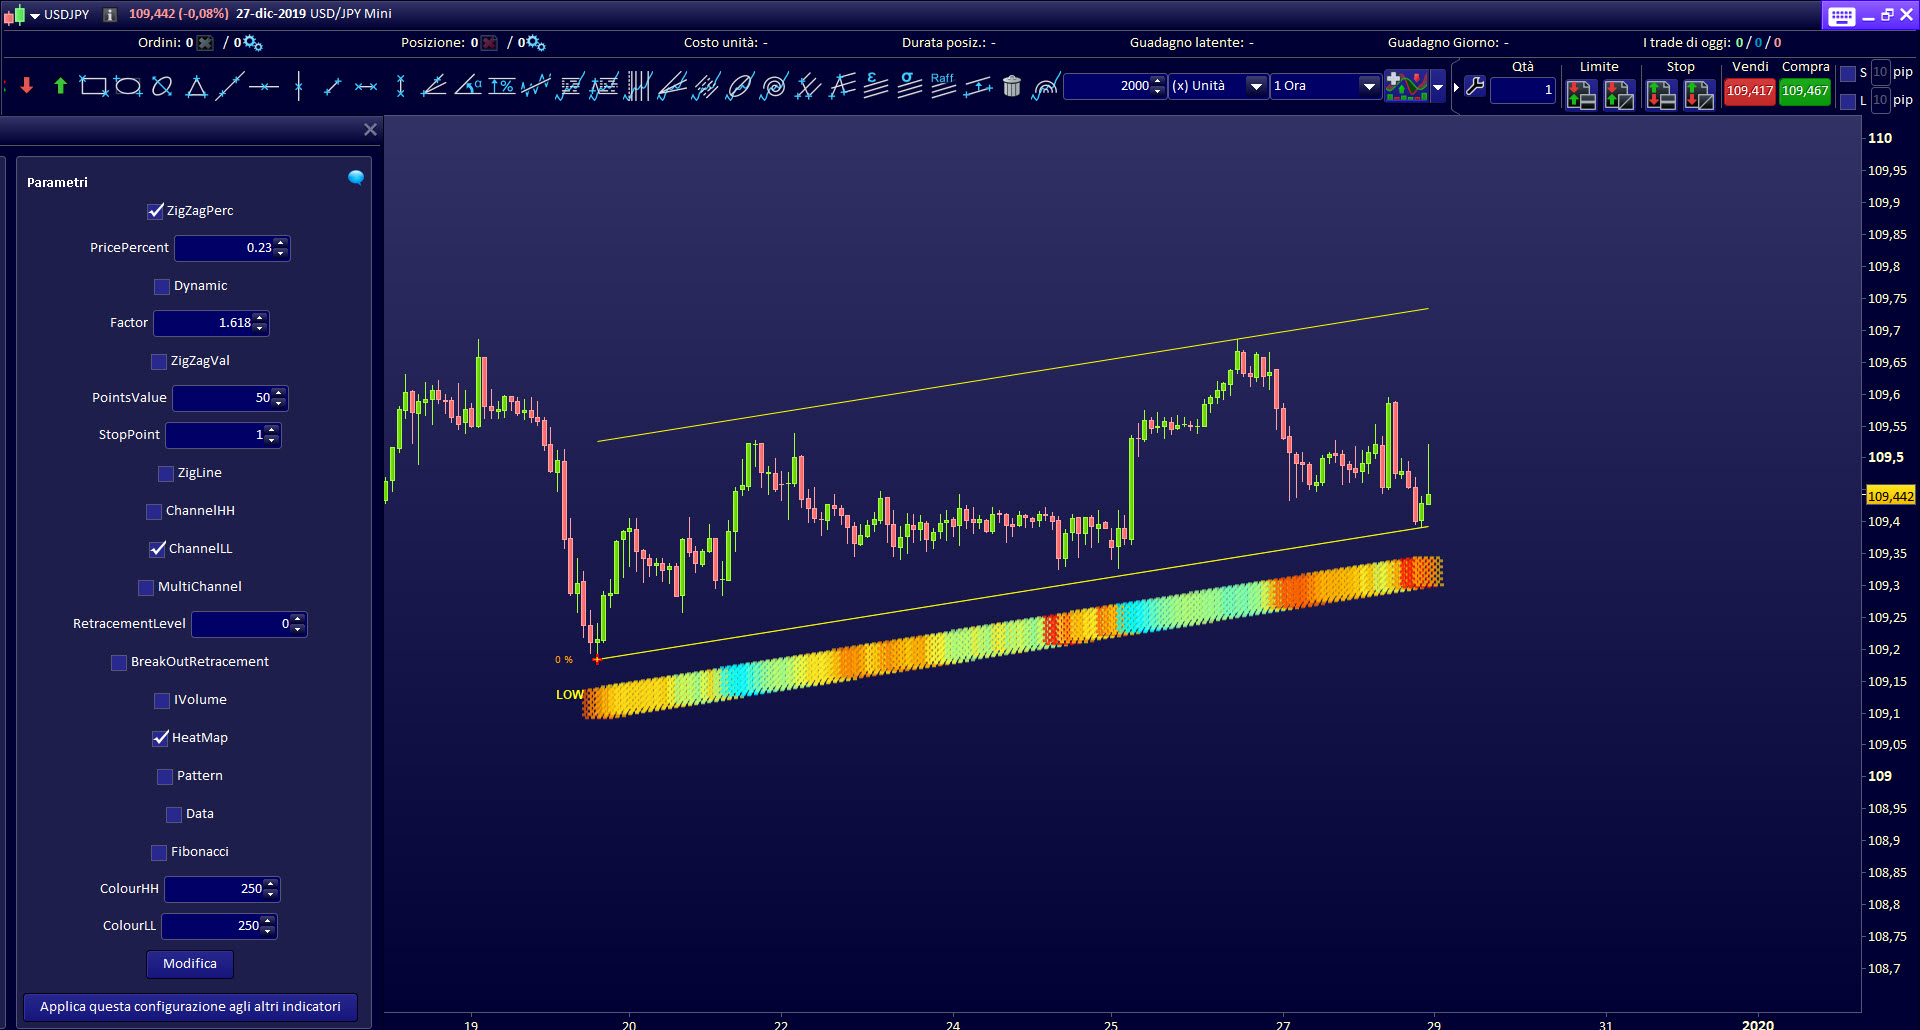
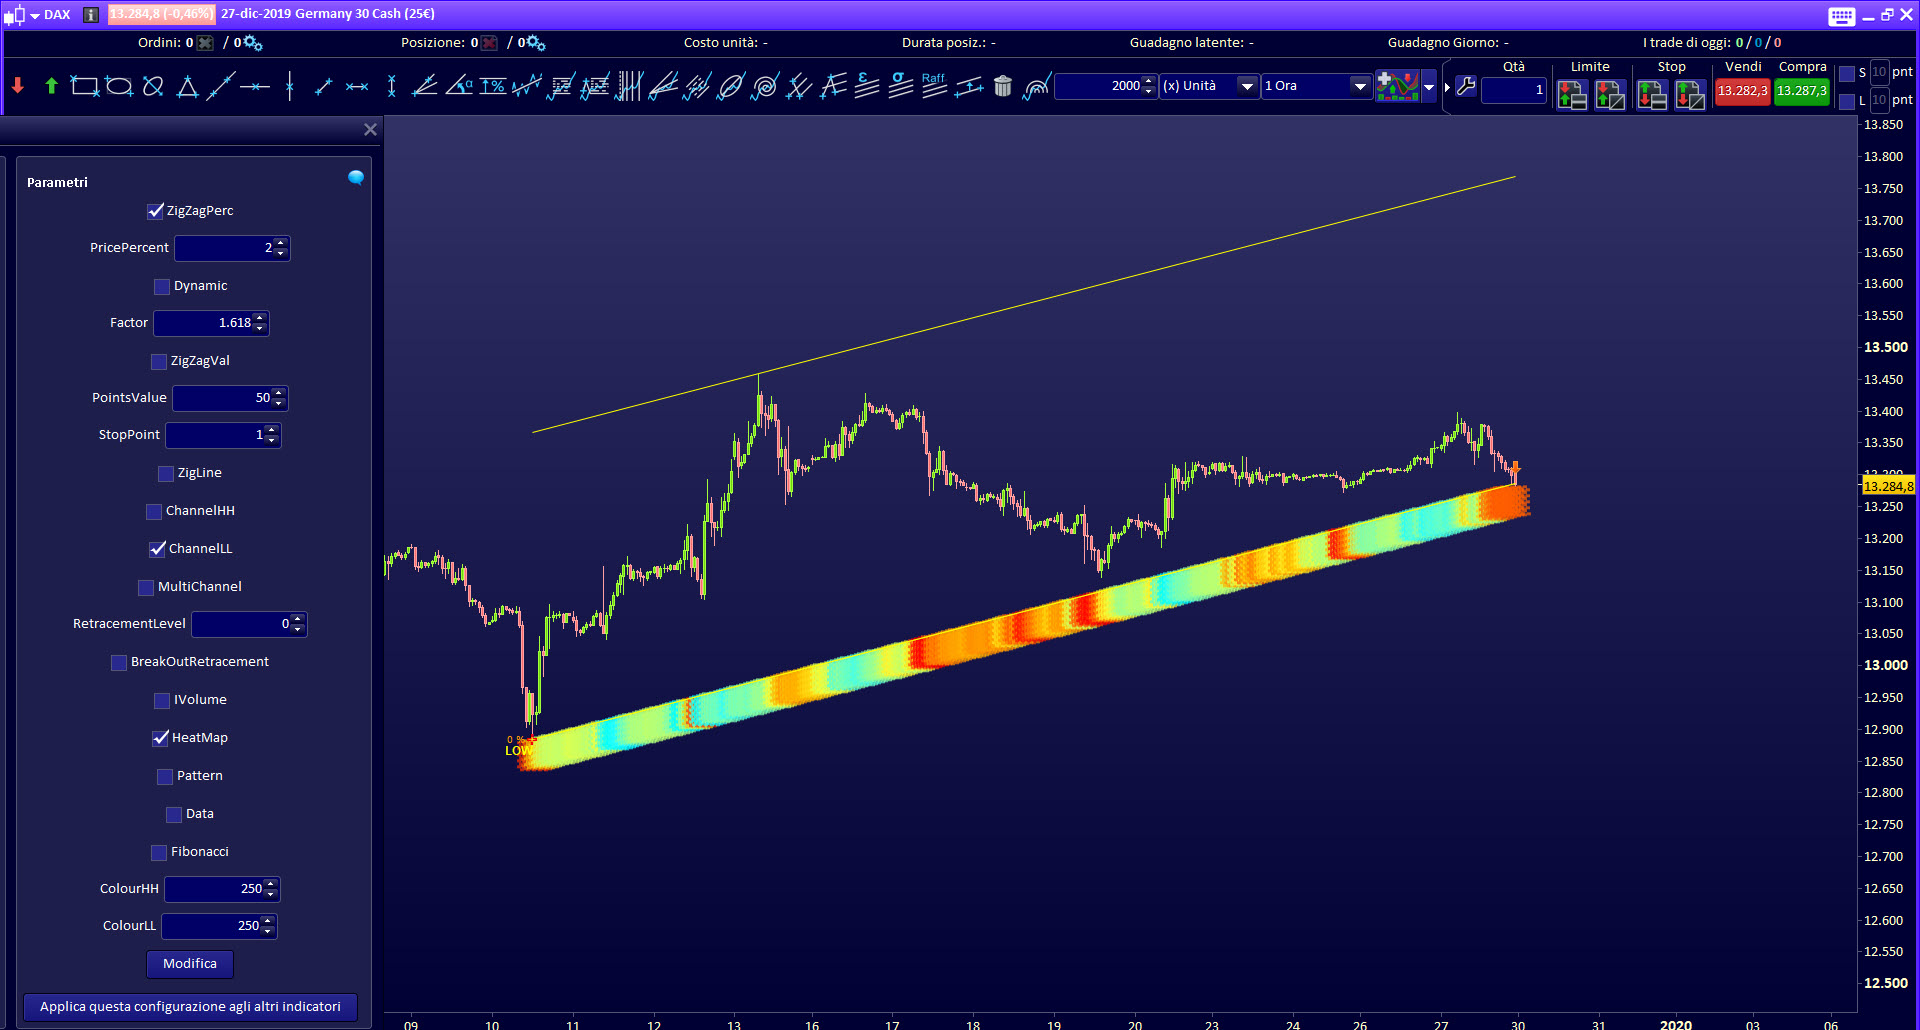
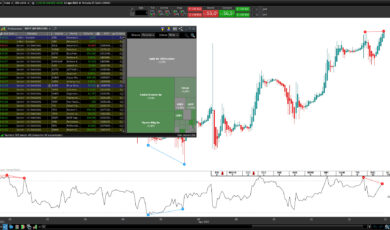
HEATMAP
The Heat Map of the Tech Channel indicator is based on the values of the commodity channel index. The CCI is a very useful oscillator to understand if the market is overbought or oversold, and it
is one of the most elderly oscillators.
The Map has a range of colors ranging from dark red for the oversold values to light turquoise for the overbought values.
-
- TechChannel indicator Heat map
-
- TechChannel indicator Heat map
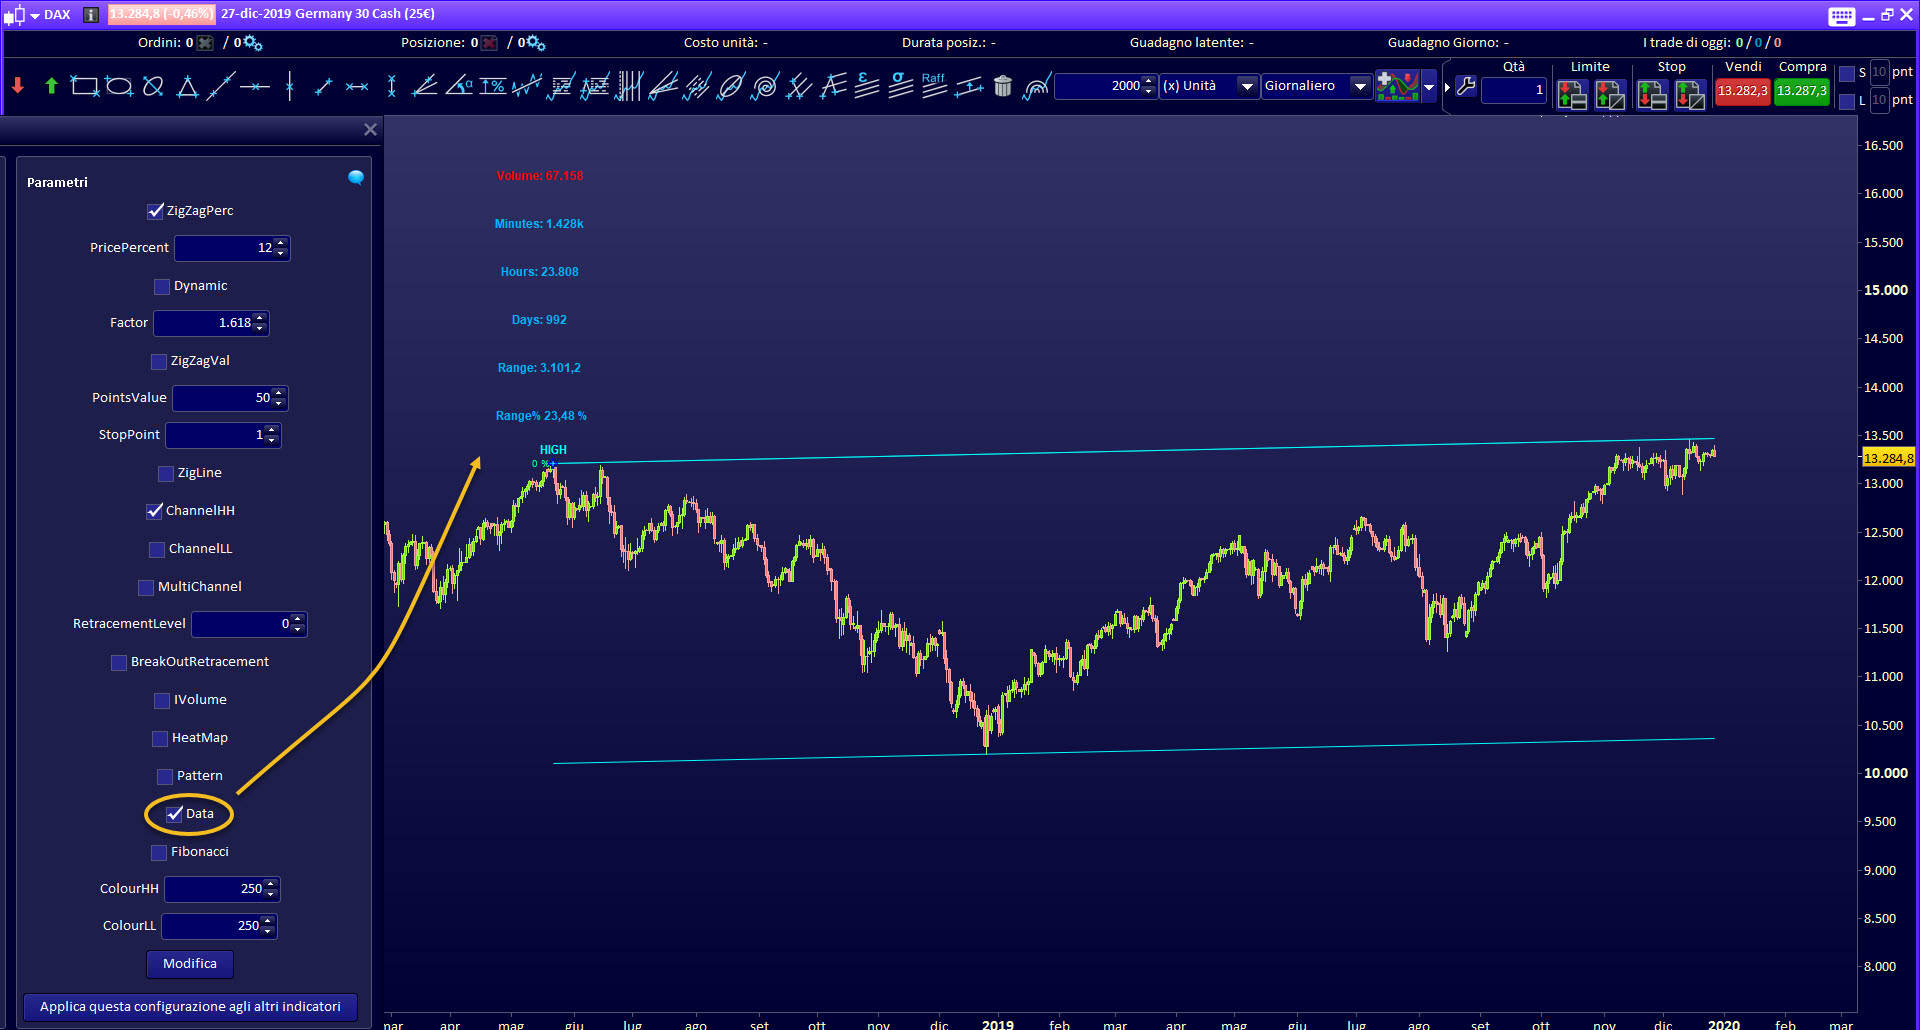
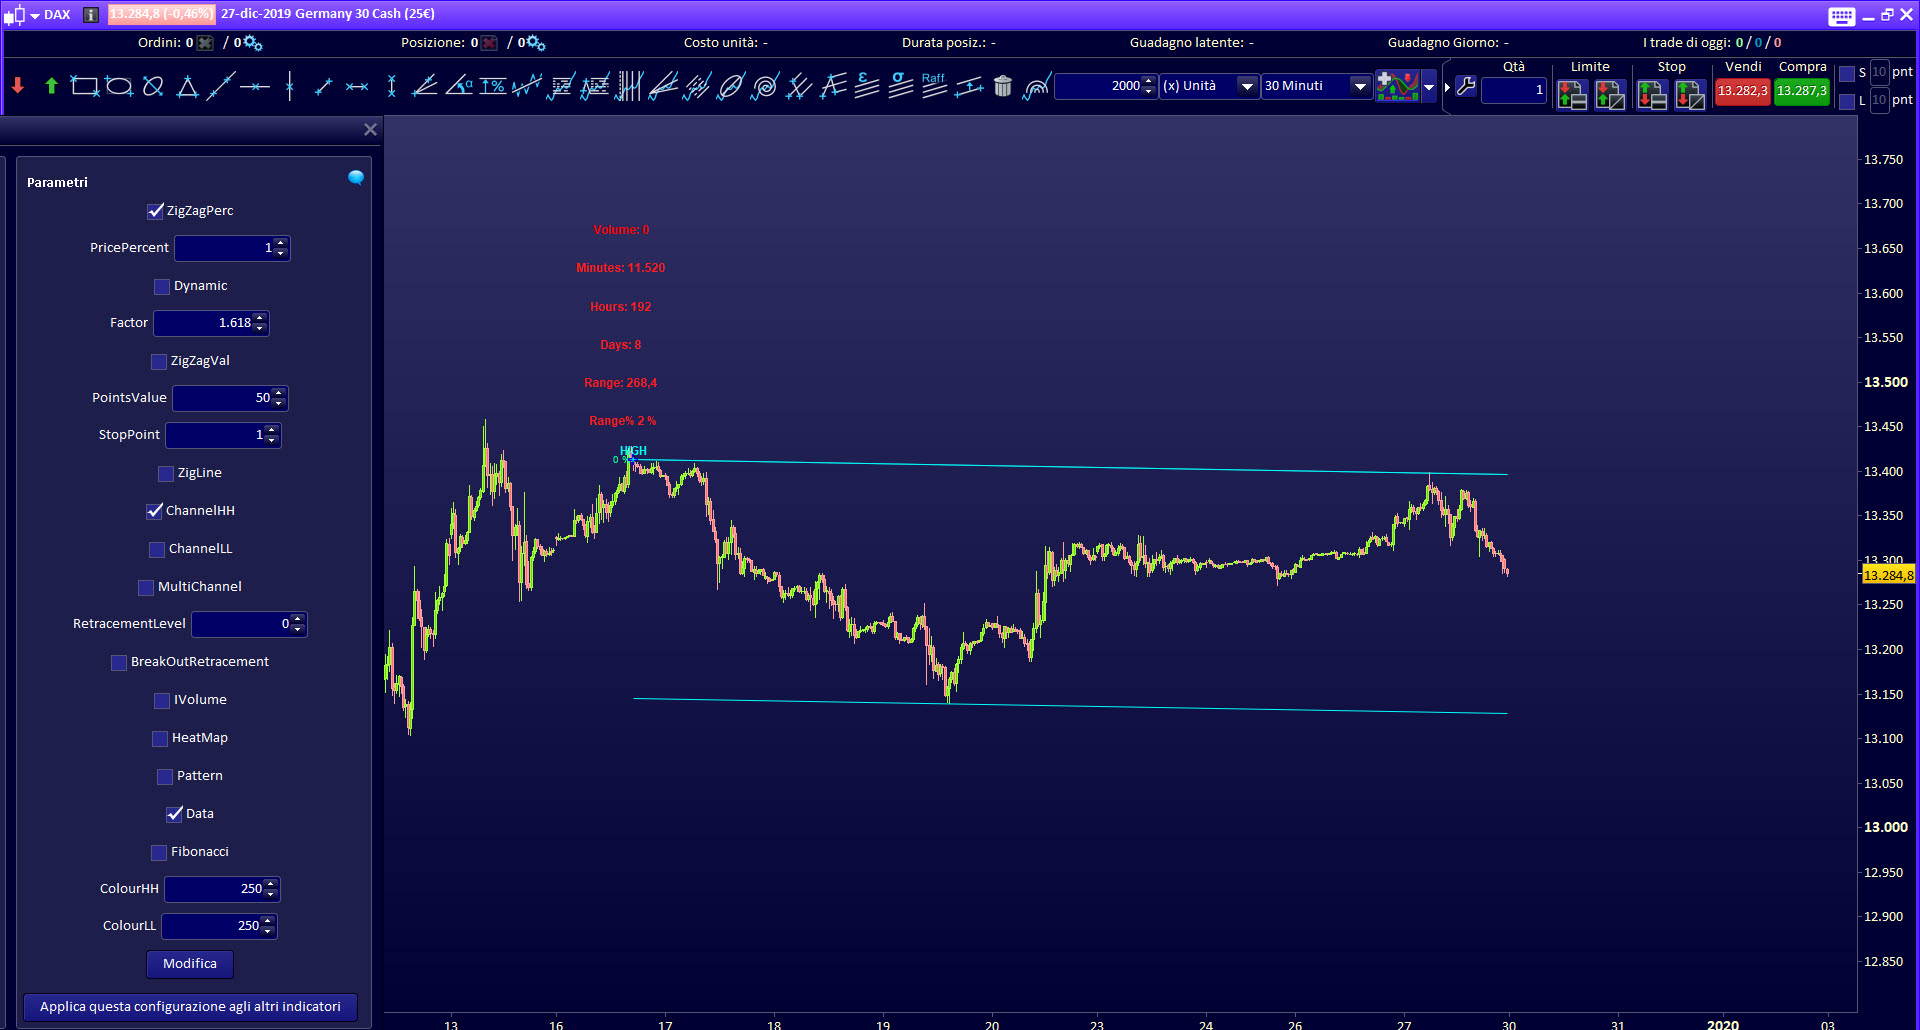
CHANNEL TEMPORAL AND SPATIAL DATA
Allows you to control the time and space parameters of the channel, the duration in: days, hours, and minutes, and the range in percentage and in points.
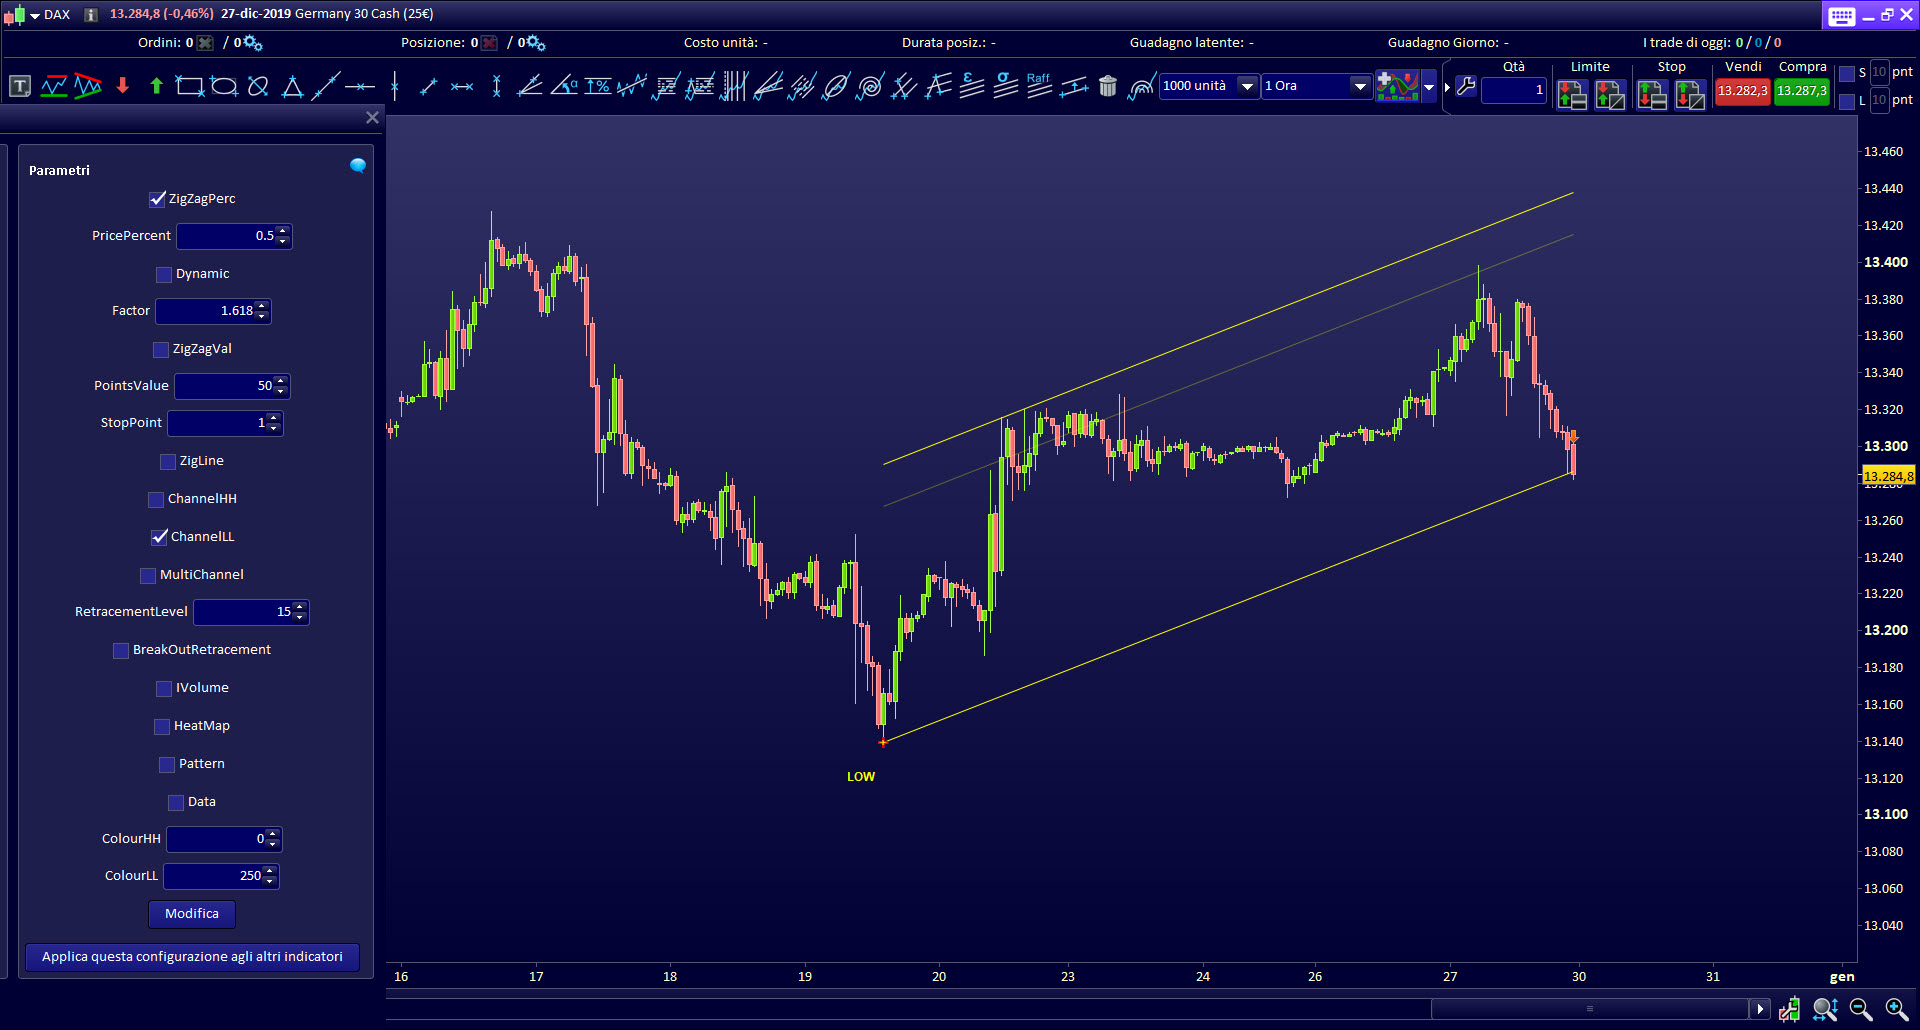
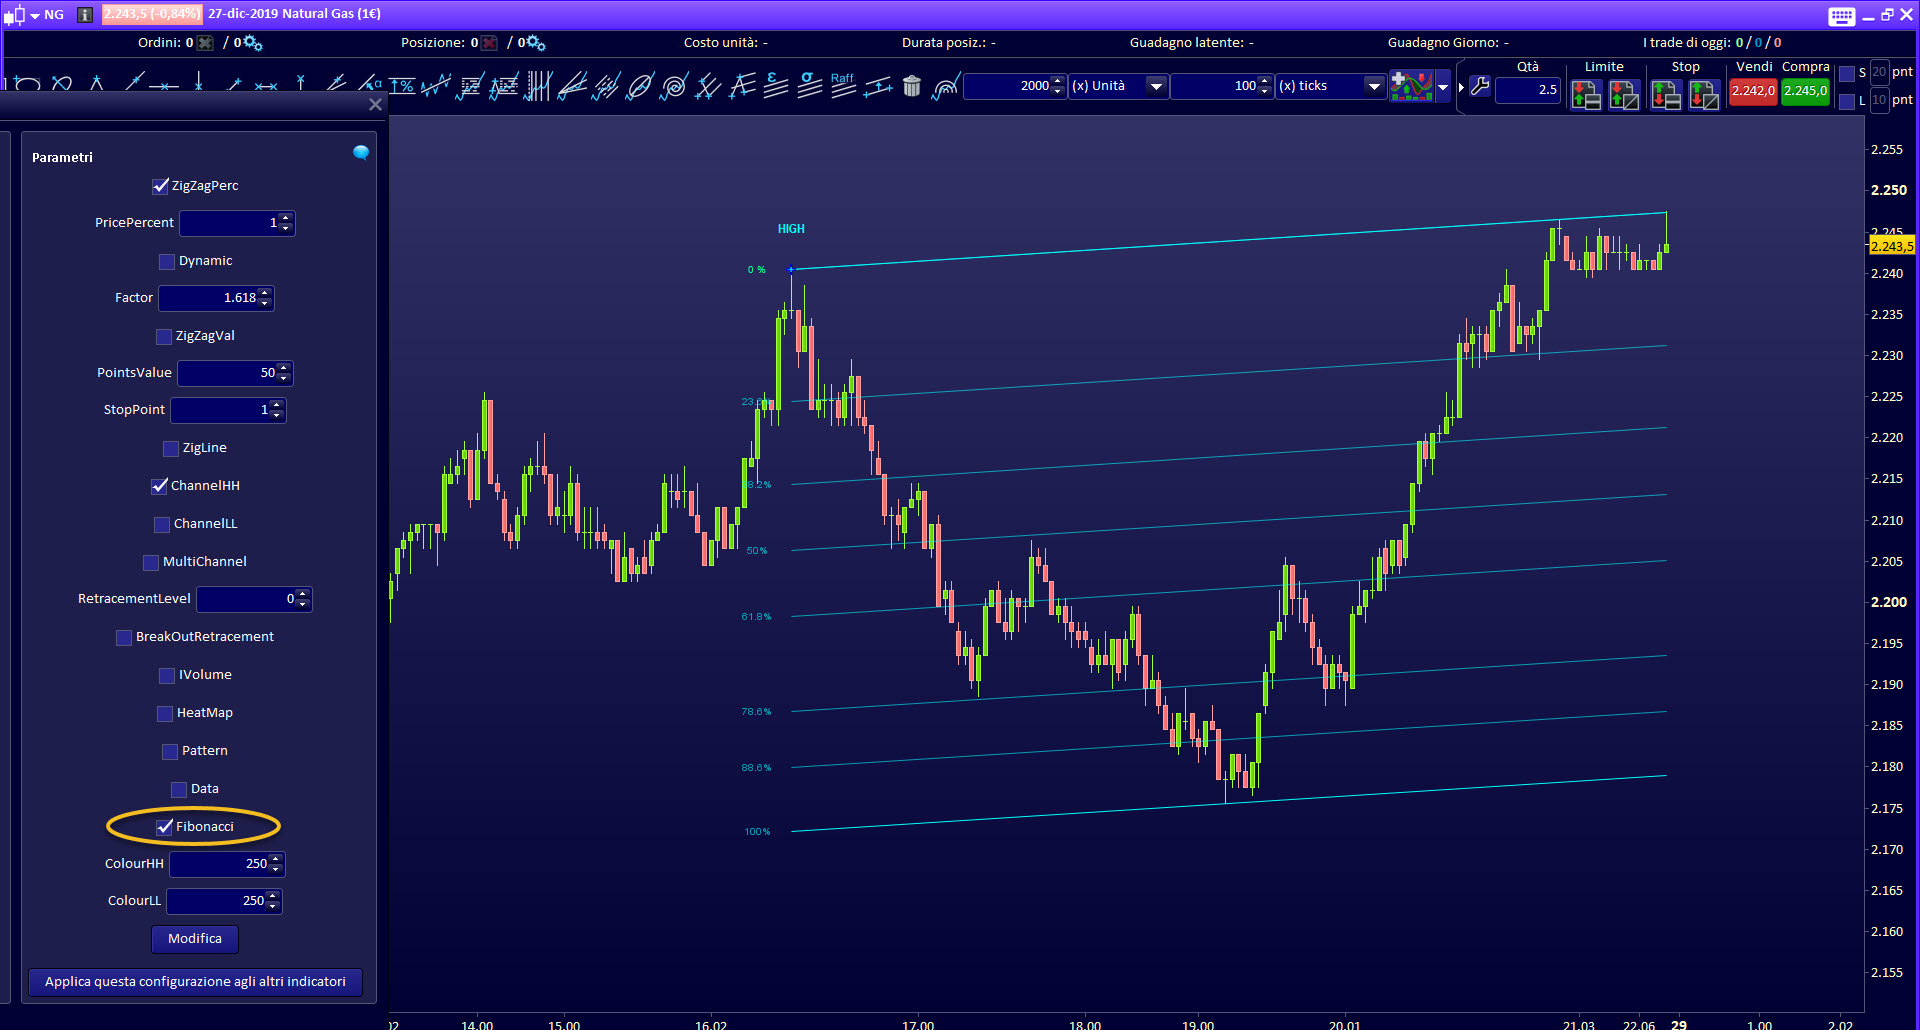
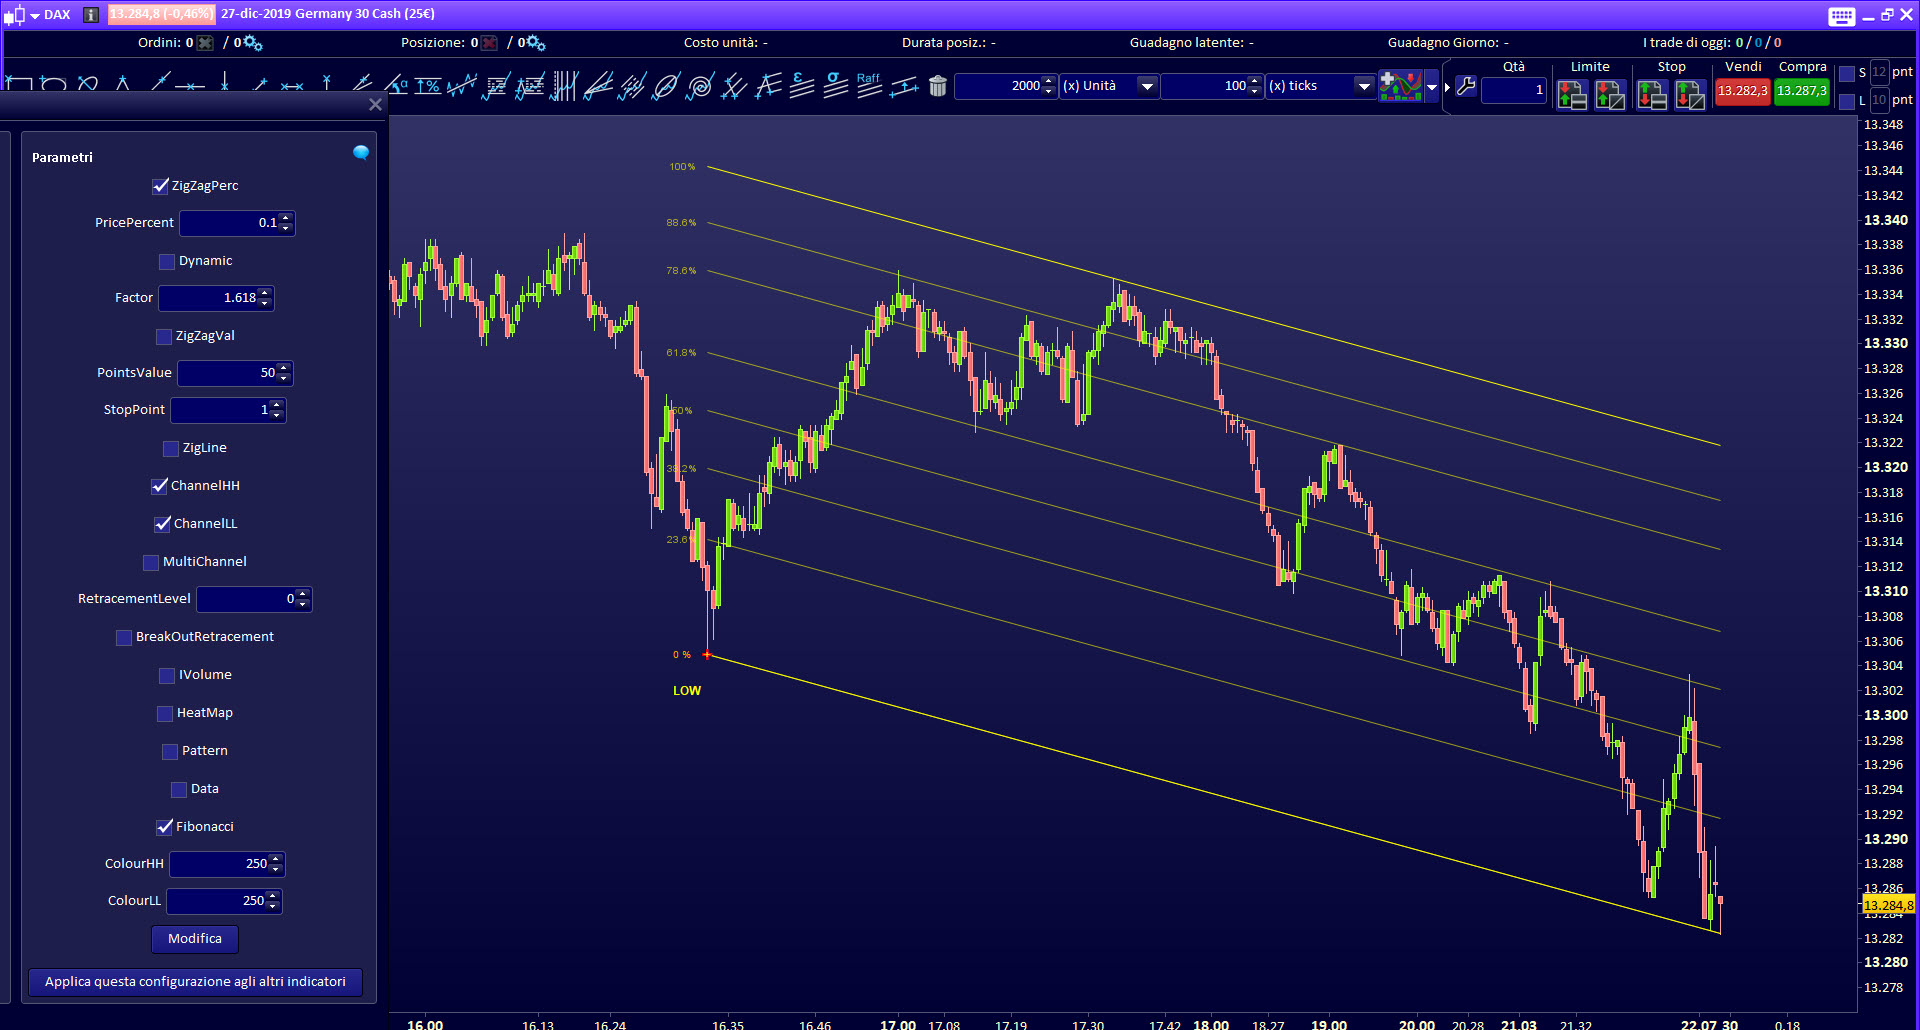
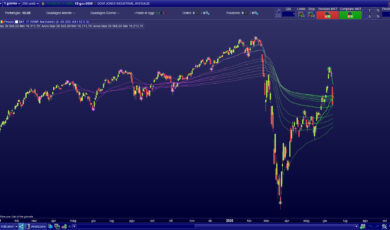
FIBONACCI
You can plot Fibonacci retracements channel on the graph.
-
- TechChannel indicator Fibonacci
-
- TechChannel indicator Fibonacci
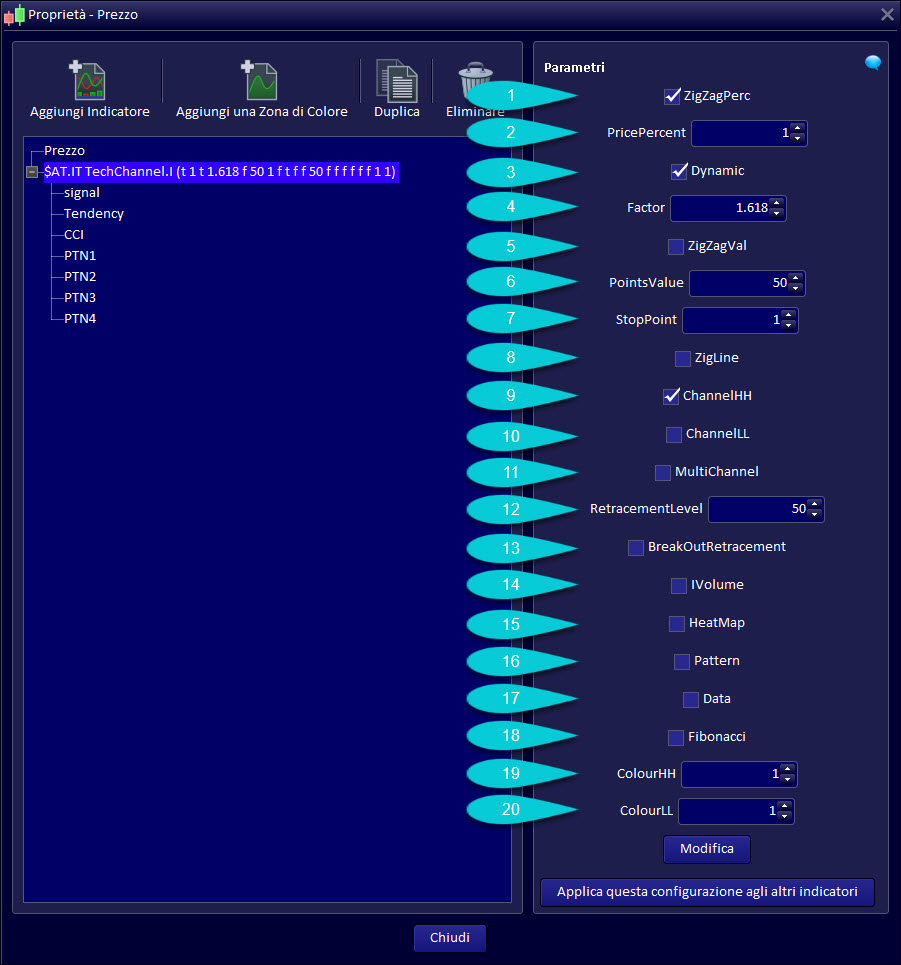
Interface of the Tech Channel indicator:
- ZigZagPerc : Enable or disable the PricePercent variable.
- PricePercent: Value of the percentage difference between a new high and a new low. This variable affects the size of the Pattern.
- Dynamic: Enable or disable the dynamic variable.
- Factor: Variable of the “Dynamic” function, this function allows automatic detection of patterns based on market volatility.
- ZigZagVal: Enabled or disabled the PointsValue variable.
- PointsValue: Value of the difference expressed in points, between a new maximum and a new minimum. This variable affects the size of the Pattern.
- StopPoint: delay n° bars, the upadate of last point of the segment.
- ZigLine: show Zig Zag line, to set the parameters quickly.
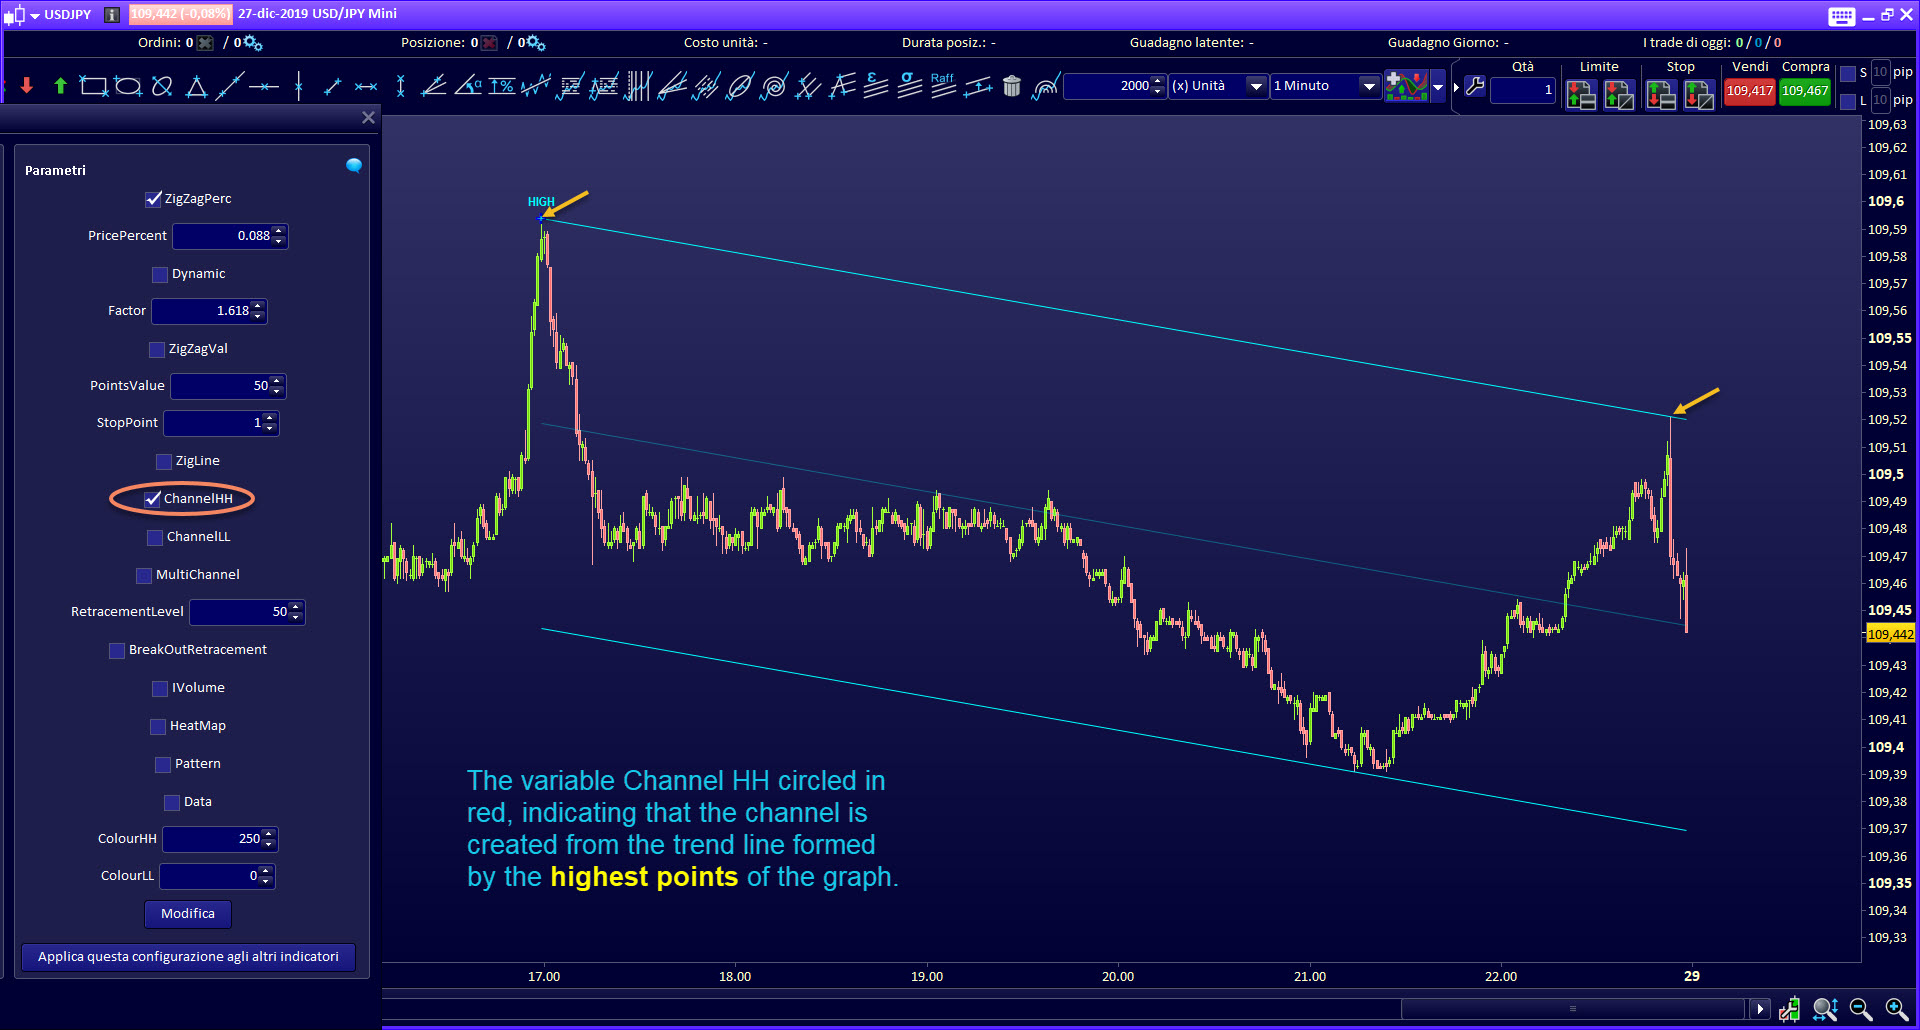
- ChannelHH: Enabled or disabled the channel based on the top trendline
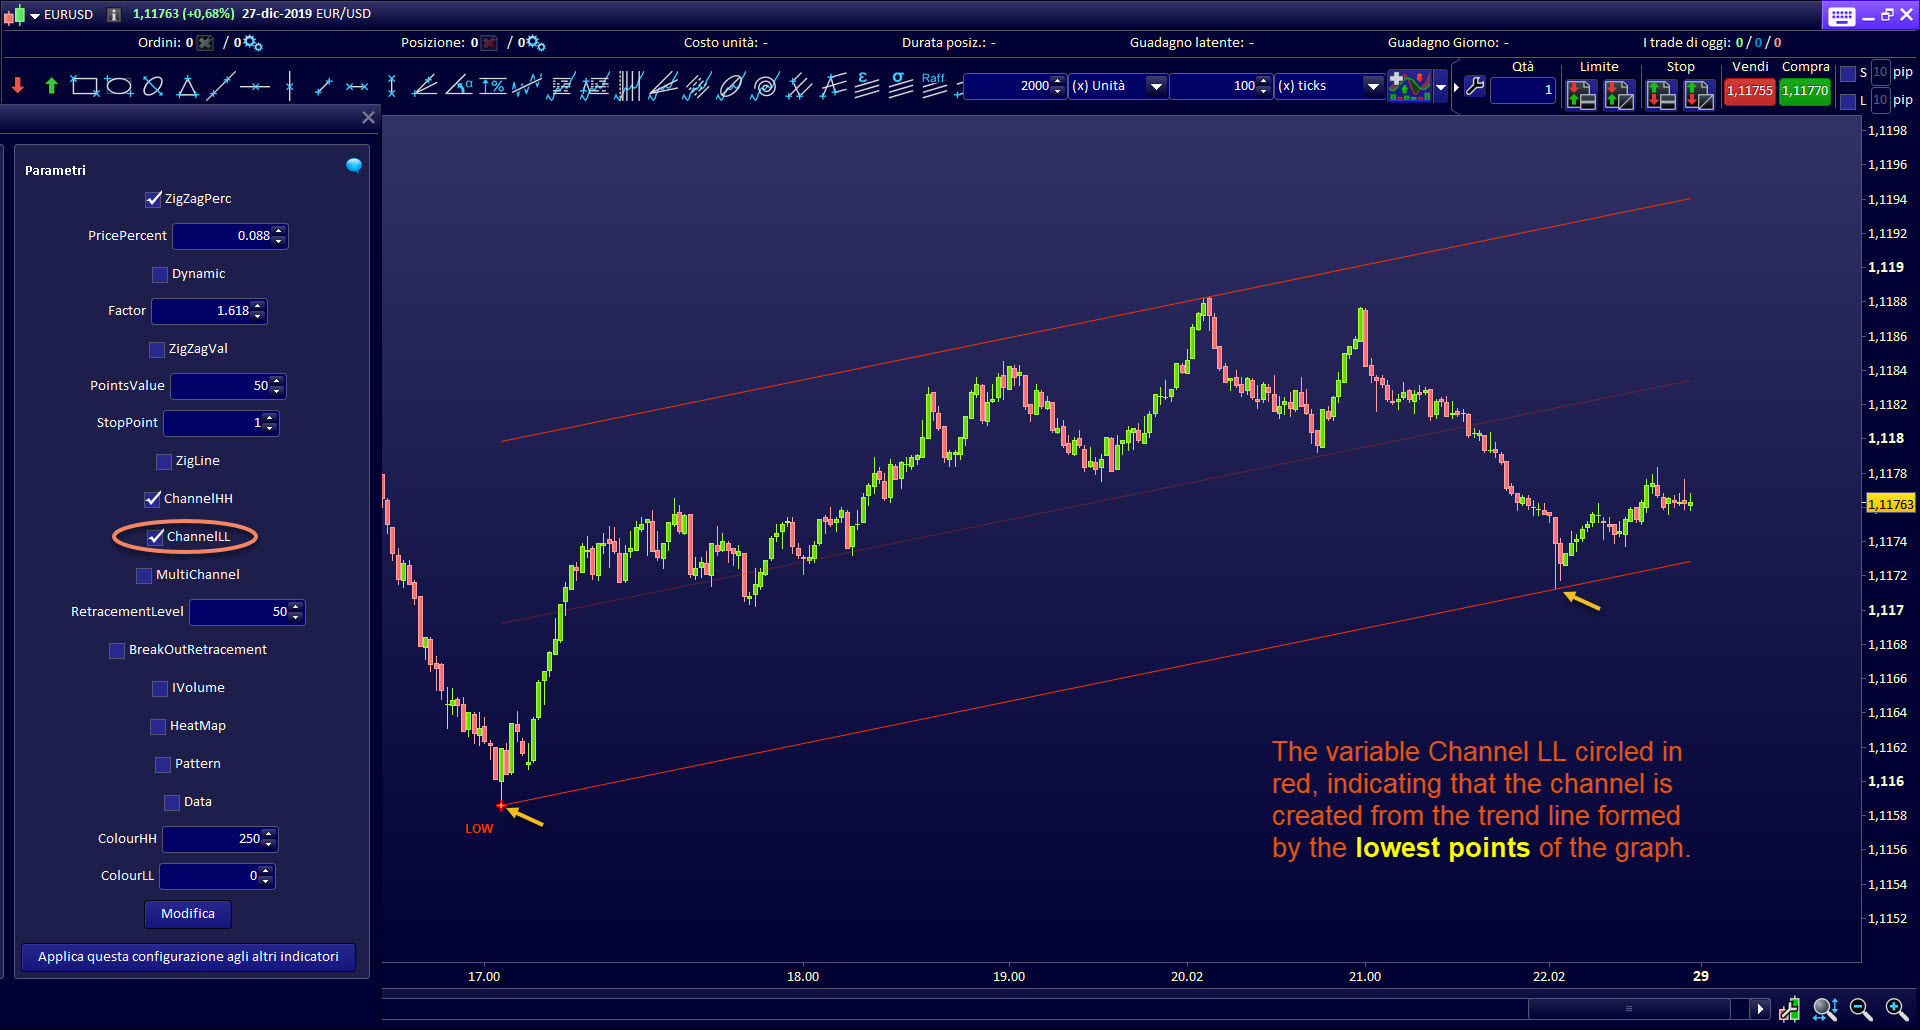
- ChannelLL: Enabled or disabled the channel based on the bottom trendline
- MultyChannel: Enabled or disabled multy channel function
- RetracementLevel: To set retracement percentage value of parallel trend line
- BreakOutRetracement: Enabled or disabled signal of retracement level break out
- I-Volume: Show volume on the top trend line
- HeatMap: Show HeatMap under the bottom trend line
- Pattern: Show the pattern when they are detected
- Data: Show temproal and spatial data of the cahnnel
- Fibonacci: Show Fibonacci retracement channel
- ColourHH: To set colours of the top trend line channel for range -255 to 255
- ColourLL: To set colours of the bottom trend line channel for range -255 to 255
Advantages of using the “Tech Channel indicator” :
- Automatically plot channel and multy channel on the graph ;
- Automatically plot heatmap trend on the graph ;
- Automatically plot volume on the graph ;
- Automatically plot temporal and spatial data of channel on the graph ;
- Recognition of recurring trading patterns for channel-loving traders!
- The oblique trend lines are active, and break out generates a signal
- Compatible with all ordinary timeframes !
- Patterns are completely customizable to suit your own trading style
- Does not repaint! The signal breakOut is given in real-time and allows you to operate without any delay
- Can be integrated into any indicator, using ProRealTime’s ProBuilder function
- Can be integrated into any automated trading strategy, using ProRealTime’s ProBackTest function to test strategies
- We offer for free the screener once you have bought this product.
Avis
Il n’y a pas encore d’avis.