
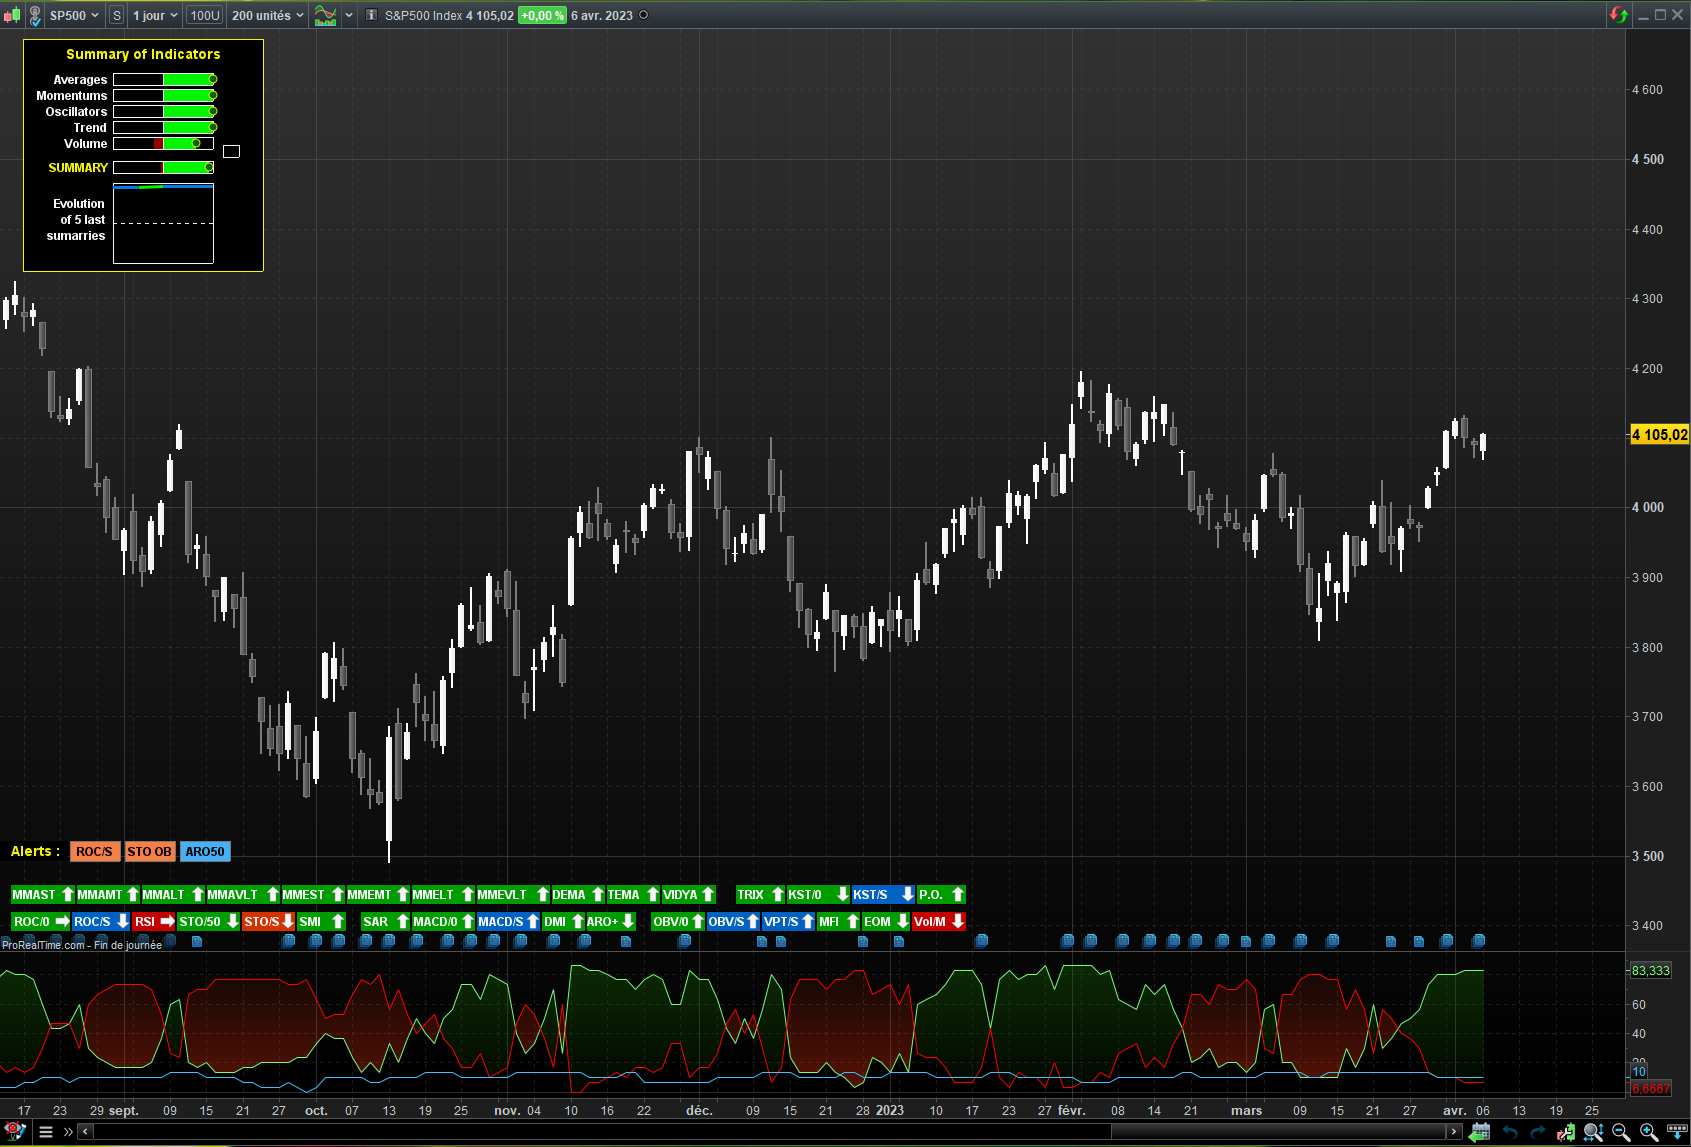
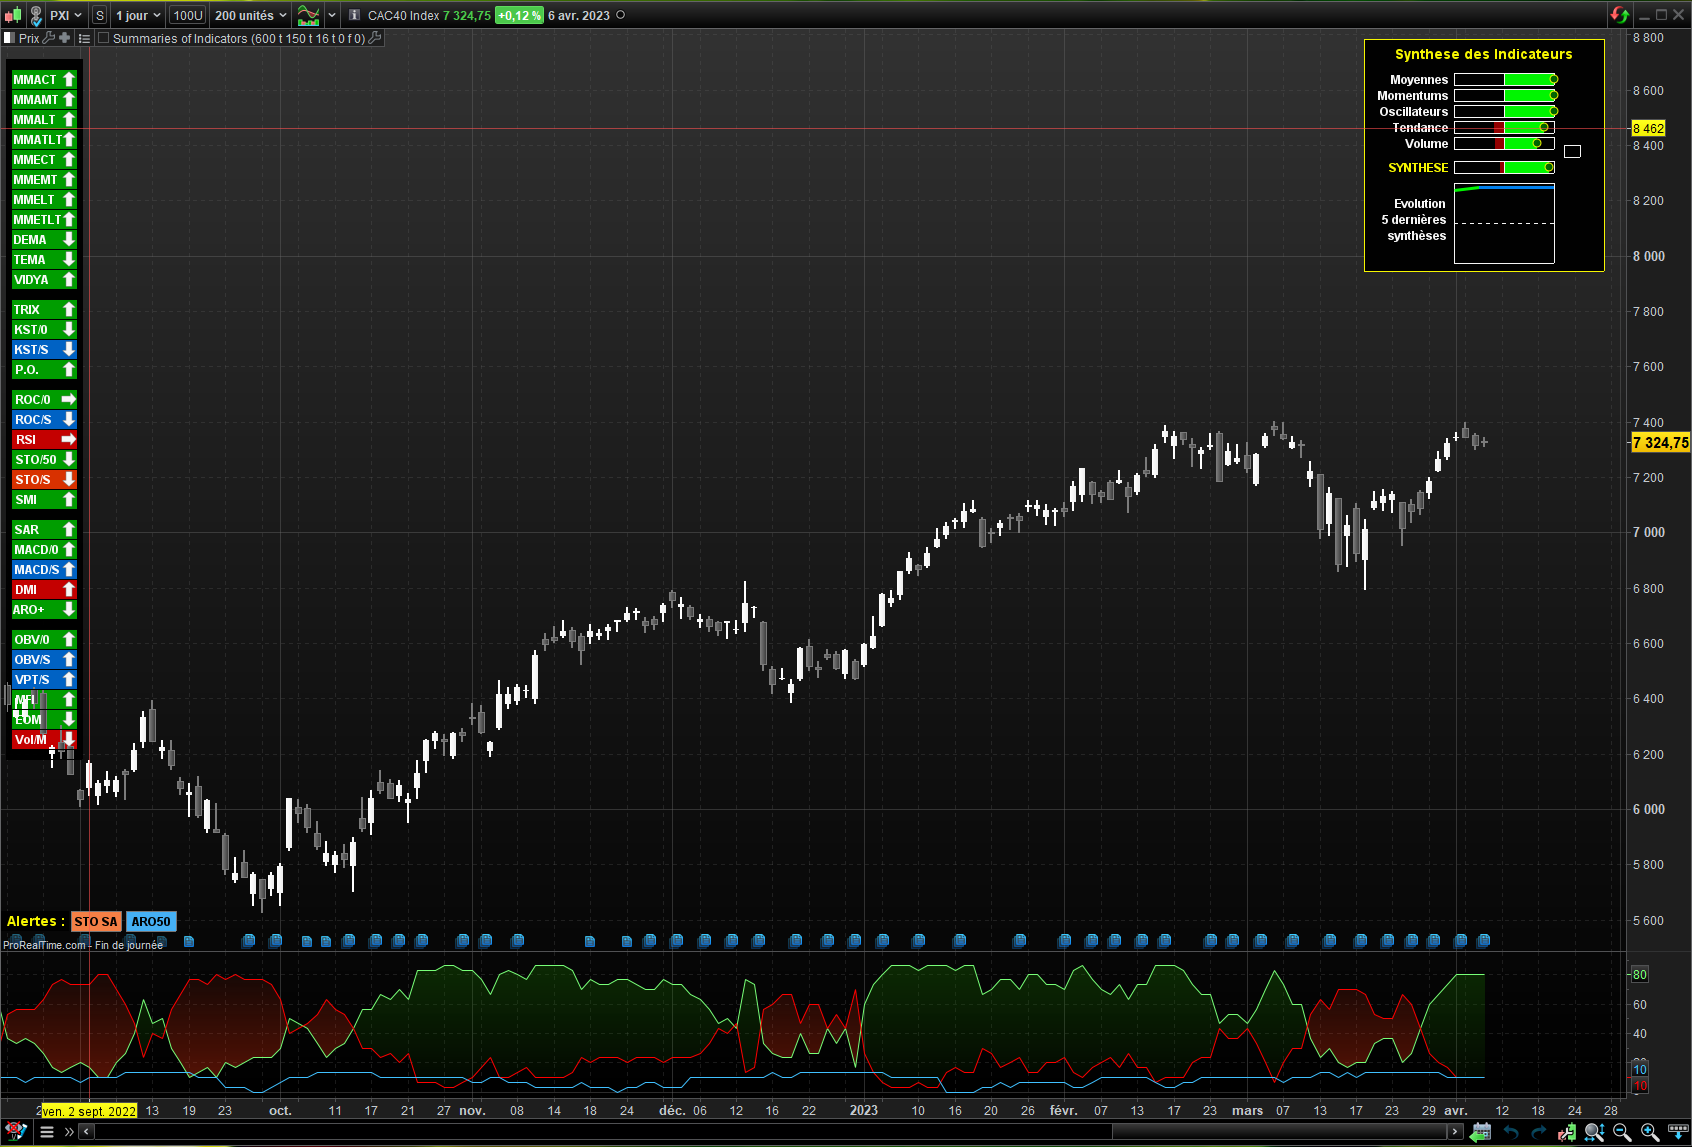
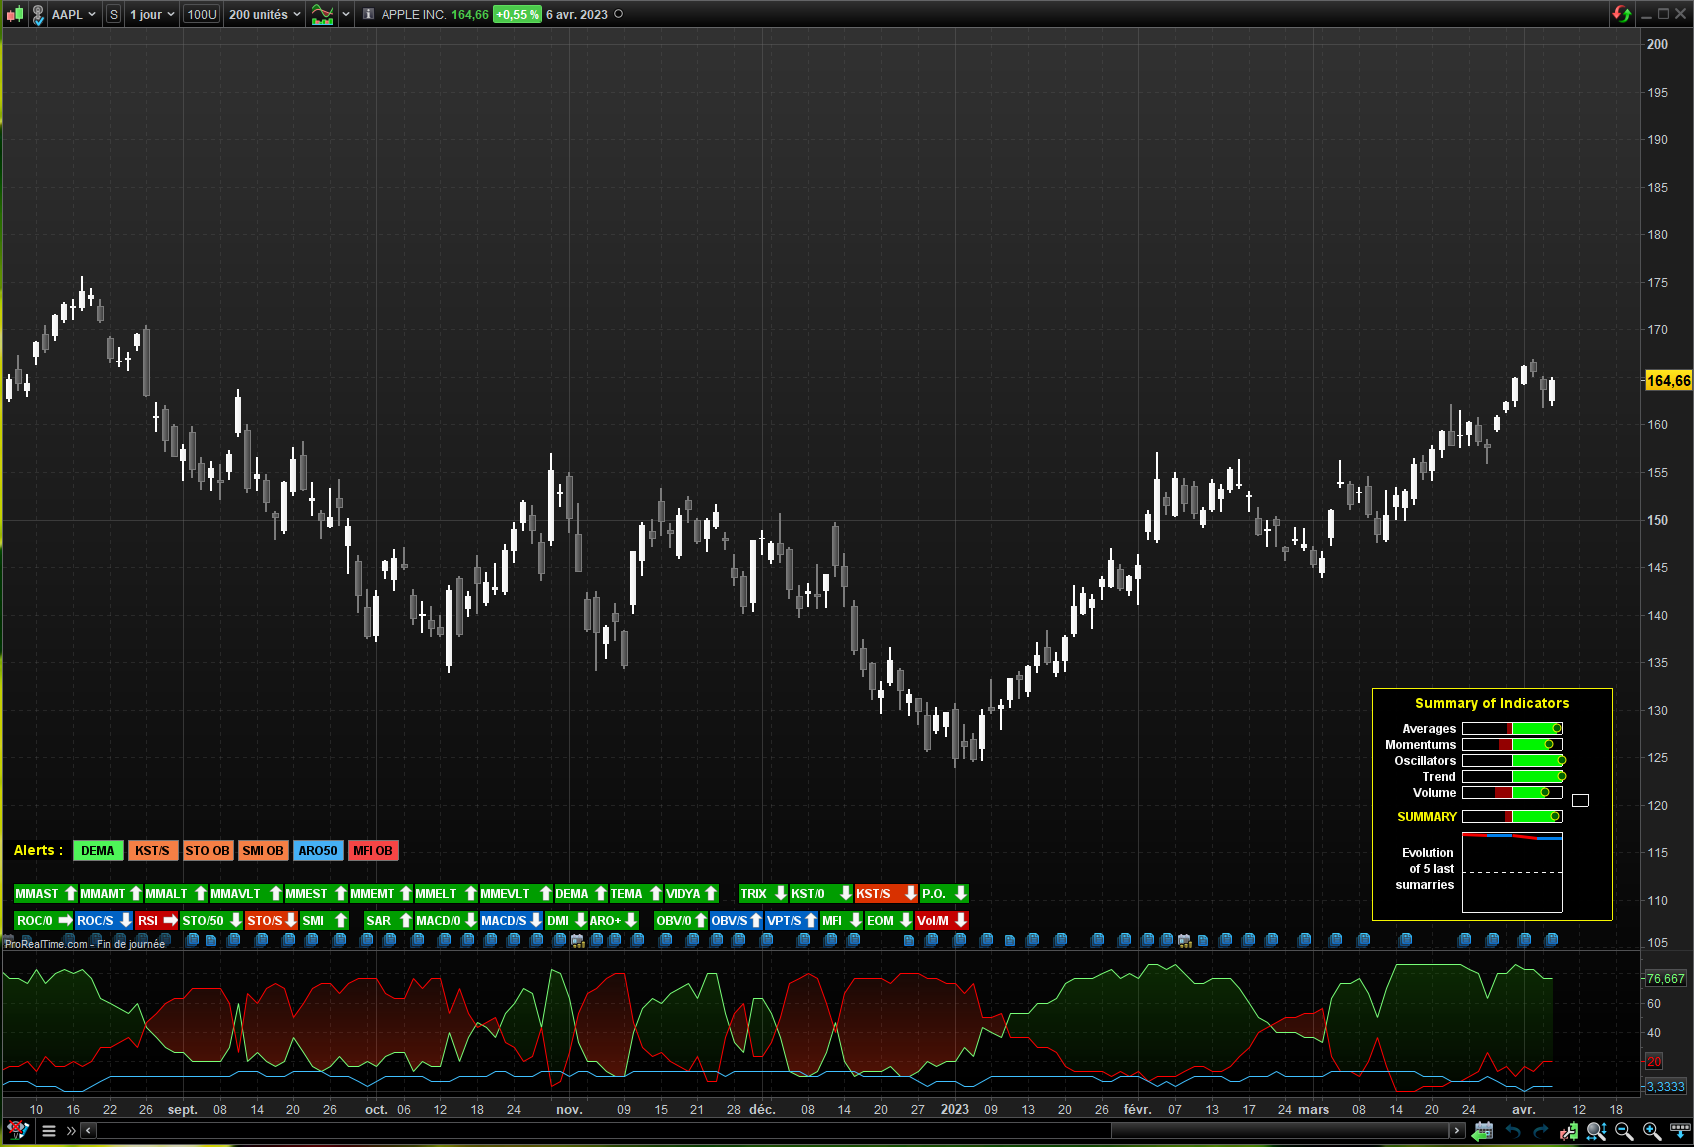
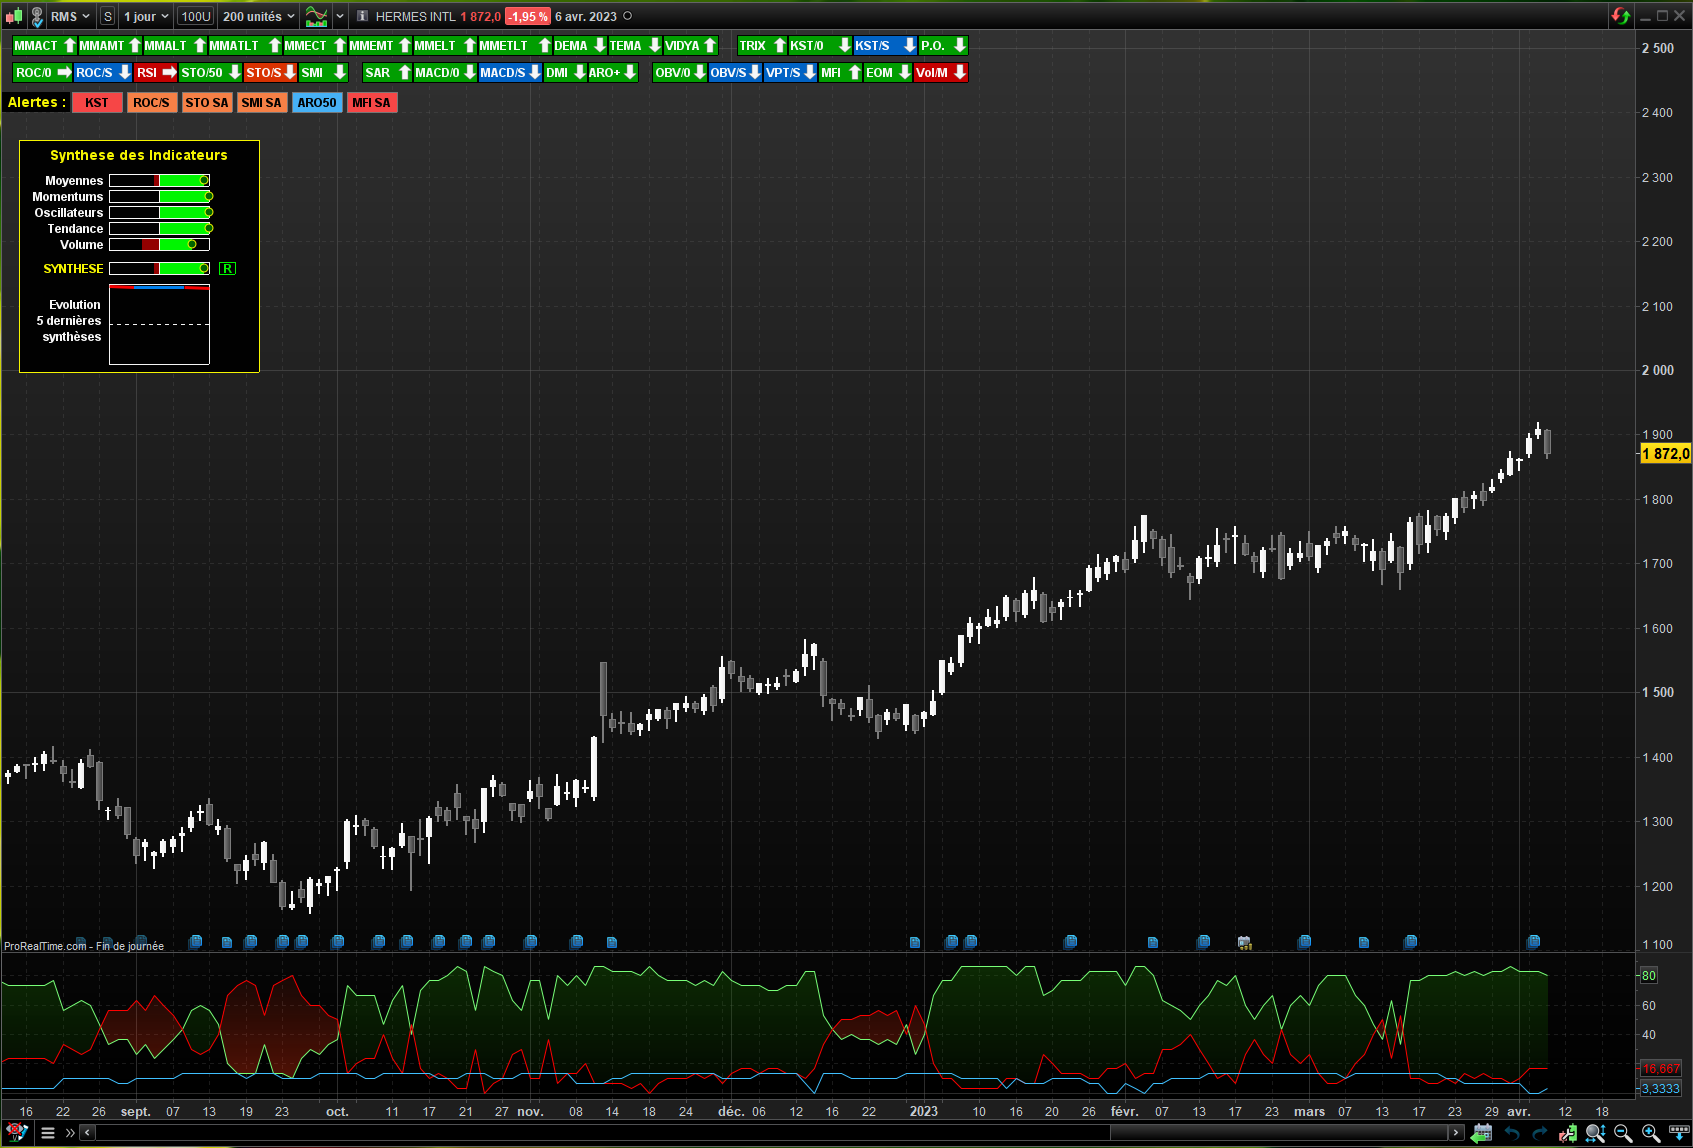
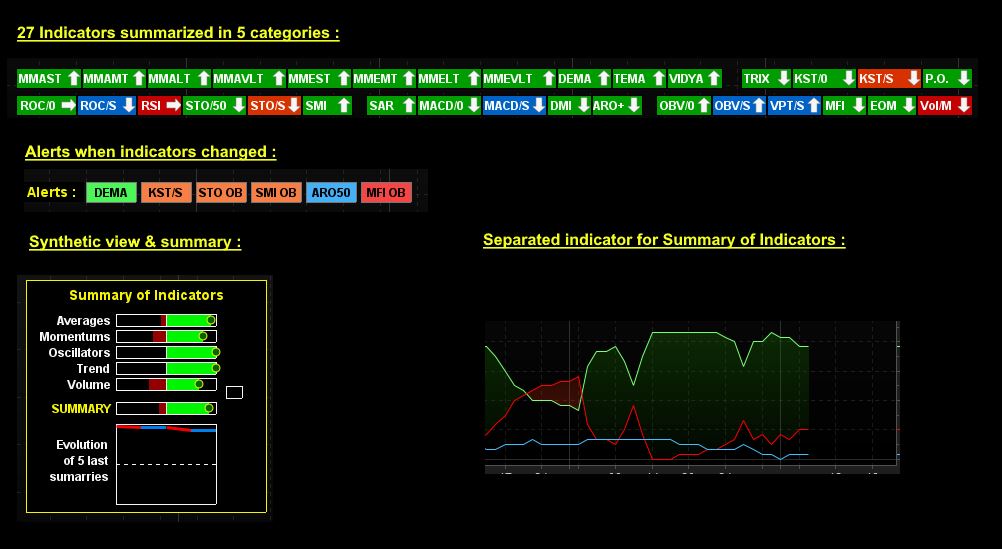

With this single indicator, you have 27 technical indicators analyzed for you simultaneously, the result is synthesized by an overall score.
Automatic analysis of 32 conditions with 27 technical indicators classified in 5 categories.
Whatever the type of product (Equities, Forex, Crypto, Indices…), but also whatever the period of time used, this indicator is able to instantly calculate a rating that indicates the predominance of your value.
Each indicator belongs to one of the 5 categories that were selected:
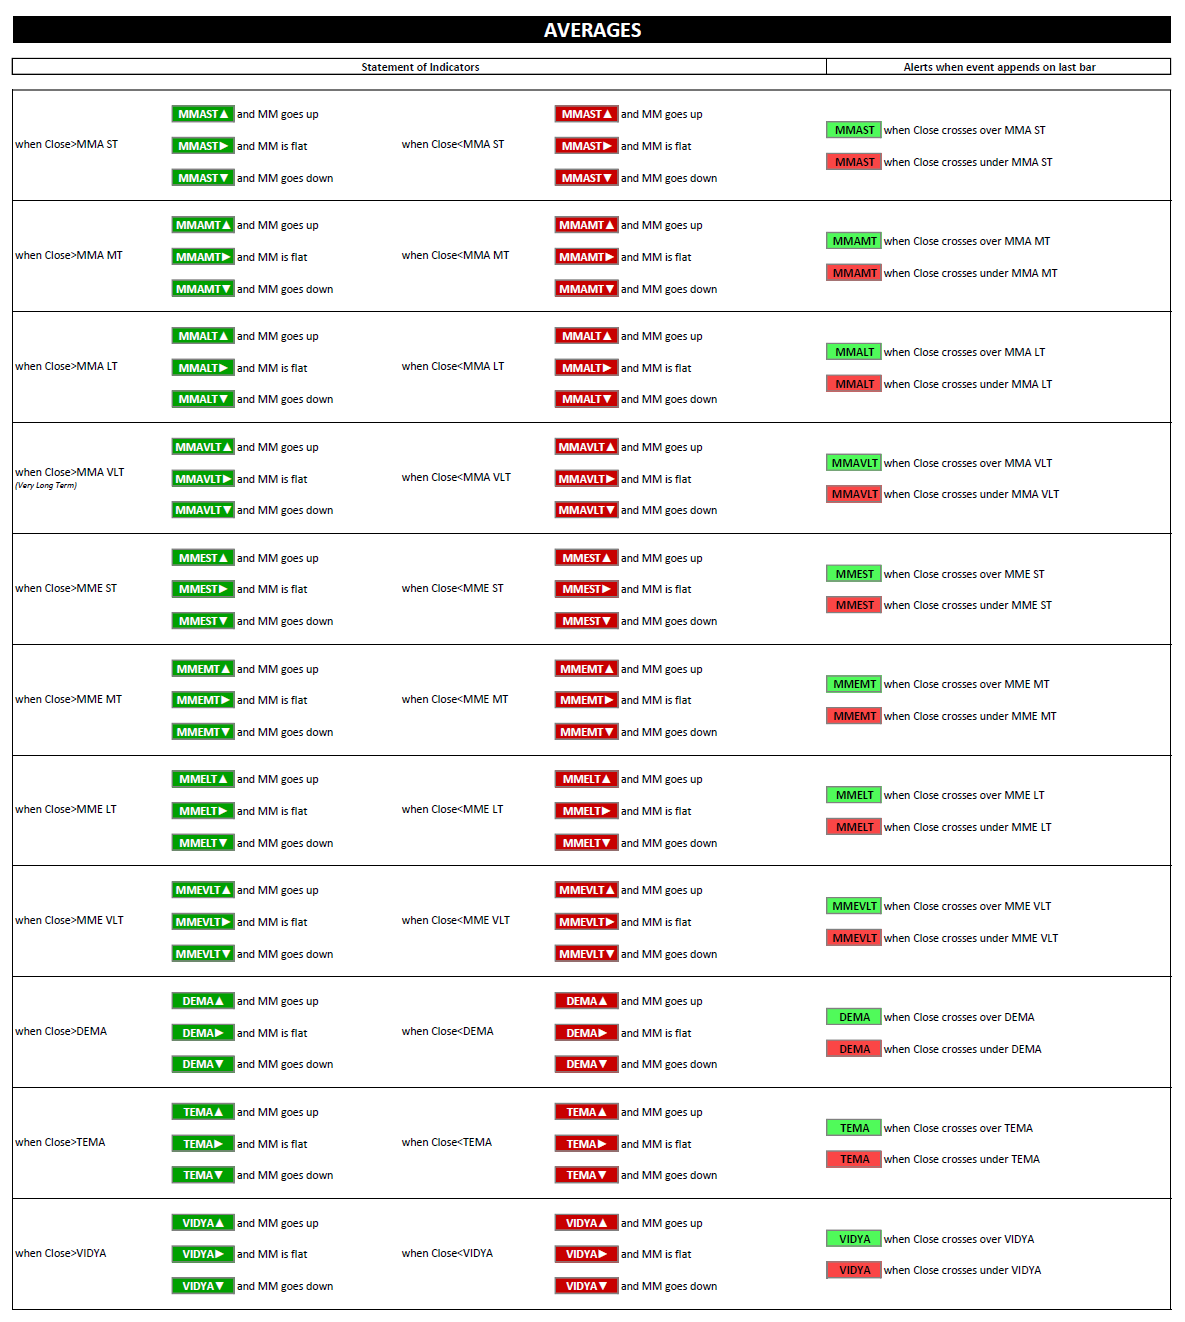
– “Averages” : 11 indicators and 11 alerts
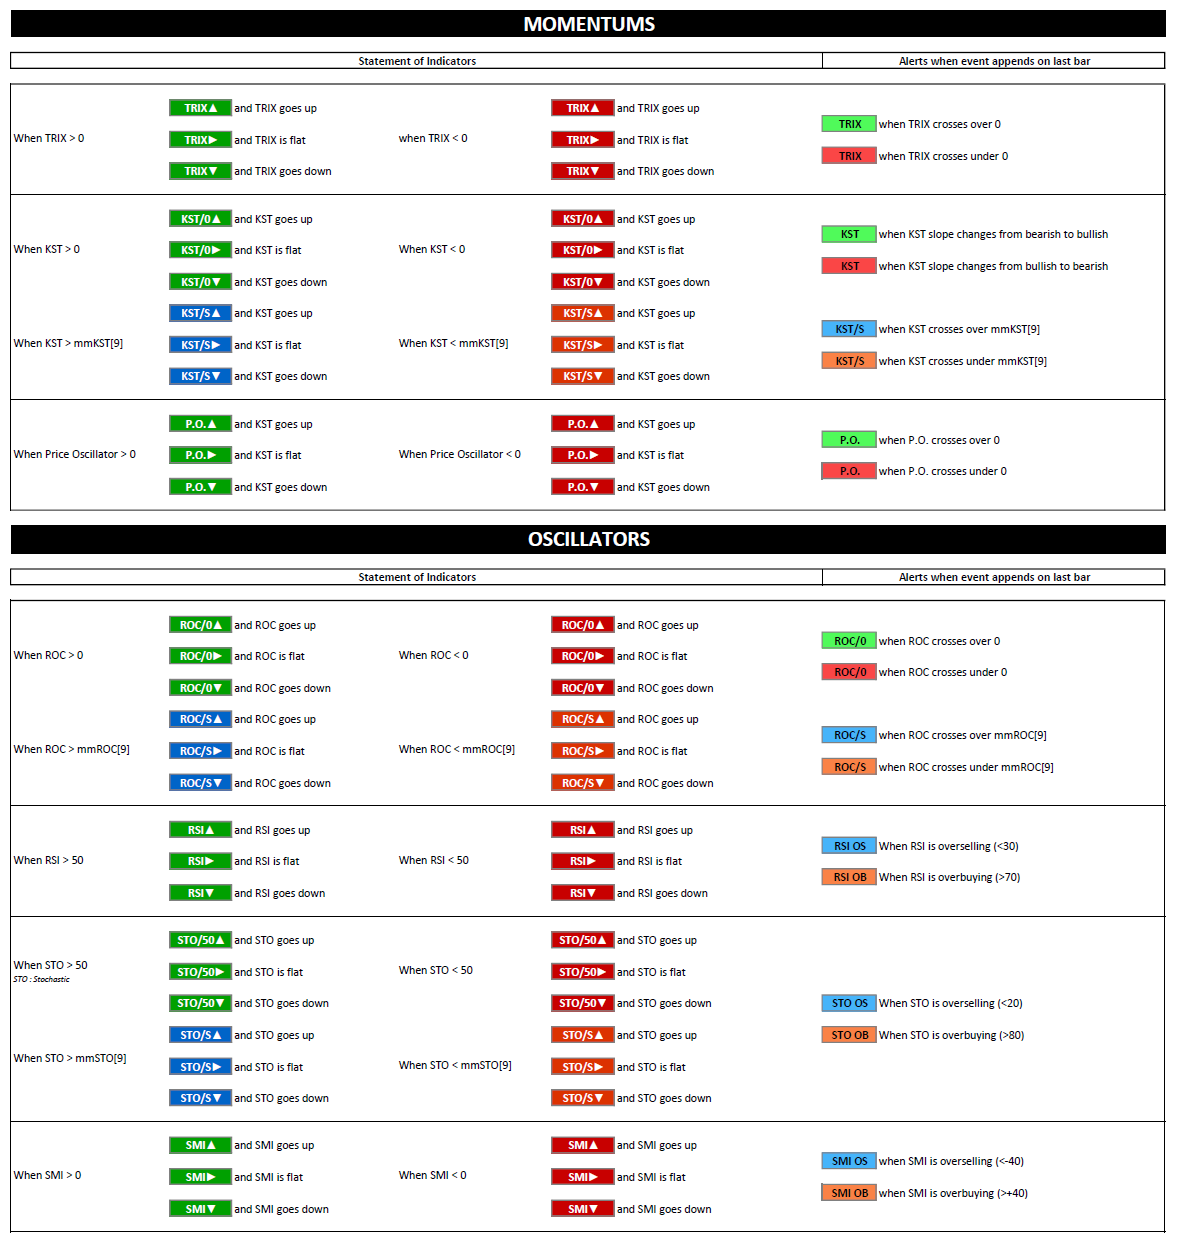
– “Momentums” : 3 indicators and 4 alerts
– “Oscillators” : 4 indicators and 6 alerts
– “Trend monitoring” : 4 indicators and 5 alerts
– “Volumes” : 5 indicators and 6 alerts
Each indicator will indicate whether it meets an up or down condition.
All these conditions are then added together to determine a bullish and a bearish score. Then, the indicator shows the strongest rating between the bullish and the bearish rating.
When you buy this product, you have :
– A synthetic sheet with rating of 5 categories and the total rating + a mini-graph of 5 last rating.
– In bottom left, a line for alerts & 2 lines with technicals analysis of 27 indicators in 32 signals grouped by 5 categories.
– A specific indicator with bullish, bearish & neutral rating (in below of price graph, similar as DMI).
Explanation of “Summary of Indicators” :
For each categories, you could see red bar for bearish rating and green bar for bullish rating . The circle (dark red or dark green) indicates the strongest rating by category.
Summary is the final rating calculated.
And to the right, you will see an other information :
If close>close[1] and Final rating > 0 and increase rather than previous, Green “T” is display to the right (“T” for probably recovery of bullish Trend)
If close<close[1] and Final rating > 0 and decrease rather than previous, Green “C” is display to the right (“C” for probably bullish Consolidation/Retracement)
if close<close[1] and Final rating < 0 and decrease rather than previous, Red “T” is display to the right (“T” for probably recovery of bearish Trend)
if close>close[1] and Final rating < 0 and increase rather than previous, Red “C” is display to the right (“C” for probably bearish Consolidation/Retracement)
Explanation of indicators statements & Alerts displayed in bottom :

Recensioni
Ancora non ci sono recensioni.