

Every trader confronts the same fundamental demons: the gut-wrenching indecision of an uncertain trade, the frustration of being whipsawed by volatile markets, and the nagging doubt that your analysis is more art than science. Traditional technical analysis, often reliant on personal interpretation, leads to inconsistent results and a confidence crisis. What if you could replace this uncertainty with a tool built on a foundation of objective mathematical rules?
Probability Indicator for Turning Zones is a professional-grade instrument designed to transform your trading process. It moves beyond subjective guesswork to provide a clear, data-driven framework for identifying opportunities, managing risk, and building robust strategies and trades. We will explore how this indicator replaces ambiguity with quantifiable probability, giving you a consistent and powerful edge in the markets.
1.0 The Turning Zones Philosophy: A New Paradigm in Market Analysis
1.1 What Are Turning Zones?
To master the indicator, one must first understand its core concept: Turning Zones. Probability Indicator for Turning Zones is a new twist in the evolution of the ecosystem around Turning Zones, the fundamental building block upon which the entire analytical framework is constructed.
- Definition: Turning Zones are specific price regions where a consolidation or a change in market direction is likely to occur. They are not subjective support and resistance levels but are instead reference points calculated using a proprietary set of mathematical rules.
- Objectivity: Because these zones are identified algorithmically, the process is completely objective and free from human judgment or bias. The rules are the rules, providing a consistent analysis every time.
- Anticipation: The indicator goes beyond simply reacting to past price action. It actively anticipates and displays Potential Turning Zones, giving users a forward-looking view of where the next critical price levels might form based on the system’s predefined conditions.
1.2 The Three Pillars of an Unbiased Edge
The indicator’s core methodology provides a superior and more reliable analytical framework compared to traditional, manual methods by adhering to three foundational principles.
- Objective: The entire system is based on mathematical rules, completely eliminating the subjective judgments, emotional reactions, and cognitive biases that so often undermine a trader’s performance.
- Continuous: It evaluates an asset’s state coherently over time, without breaks or interruptions. This provides a seamless and logical narrative of market behavior, rather than a series of disconnected snapshots.
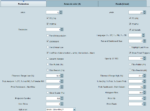
- Universal: The methodology does not rely on sensitive parameters that must be constantly adjusted of optimized for different assets or market conditions. This universal applicability ensures its analytical power is consistent, whether you are trading indices, equities, commodities or forex.
This philosophy is designed to provide a consistent and robust edge in any market condition. By establishing a foundation of pure objectivity, the indicator paves the way for tangible, strategic benefits that directly impact decision-making.
Download the User Manual for futher Information. They are available in English, Spanish and French:
2.0 Your Strategic Advantage: Transforming Data into Decisive Action
2.1 From Raw Data to Actionable Intelligence
The tool is engineered to deliver real-time information that empowers users to make superior decisions.
- Pinpoint High-Probability Opportunities: Move beyond chasing price and start identifying setups with a statistical backing. The indicator helps you spot key inflection points where opportunities are most likely to emerge.
- Trade with Confidence, Not Hope: Quantify every trade scenario with hard probabilities derived from historical precedent, calculating the likelihood of success before you risk a single dollar.
- Construct Data-Driven Strategies: Build robust trading strategies on a foundation of evidence, not intuition. Use the objective trend and structure analysis to define rules for entry, exit, and trade management.
- Optimize Position Sizing: Leverage the indicator’s calculated probability of success to apply mathematical position-sizing models like the Kelly Criterion, ensuring you allocate capital with a quantifiable, data-driven edge.
- Enhance Risk Management: Make risk management more efficient and informed. By understanding the probabilities of your take-profit and stop-loss levels being hit, you can protect capital with greater precision.
2.2 The Ultimate Differentiator: A Real-Time, Adaptive Backtest
The indicator’s most powerful value proposition is its ability to perform what is effectively a real-time backtest, avoiding any sort of parameter optimization.
This feature is unique because it is fully adapted to current market conditions and functions without requiring any manual parameter setting or optimization. It scours an asset’s historical data to find moments that were identical to the one you are facing right now. This provides an immediate and dynamic understanding of how the asset has behaved in the past under the exact same circumstances, giving you an unparalleled, evidence-based edge for your next move.
These strategic advantages are made possible by a suite of powerful, integrated features designed for the professional trader.
3.0 Inside Your Analytical Toolkit: A Deep Dive into Core Features
3.1 Uncovering Market Structure and Trend
Here, we dismantle the engine of the indicator, revealing the core features that transform noisy price charts into a clear map of market structure and trend.
- Dual-Timeframe Trend Analysis: To provide a more comprehensive and robust market view, the indicator automatically integrates data from both the 1-hour and 4-hour time frames, giving you a clearer picture of both short-term and medium-term dynamics.
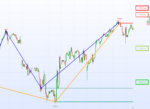
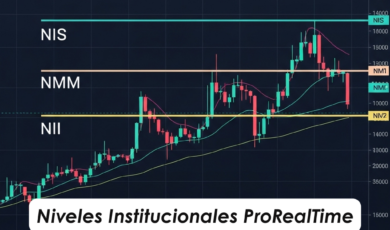
- Automated Zone Identification: The indicator automatically identifies and displays Bullish Turning Zones (BTZ) and Bearish Turning Zones (BeTZ) in real time. These zones are the cornerstones of its structural analysis.
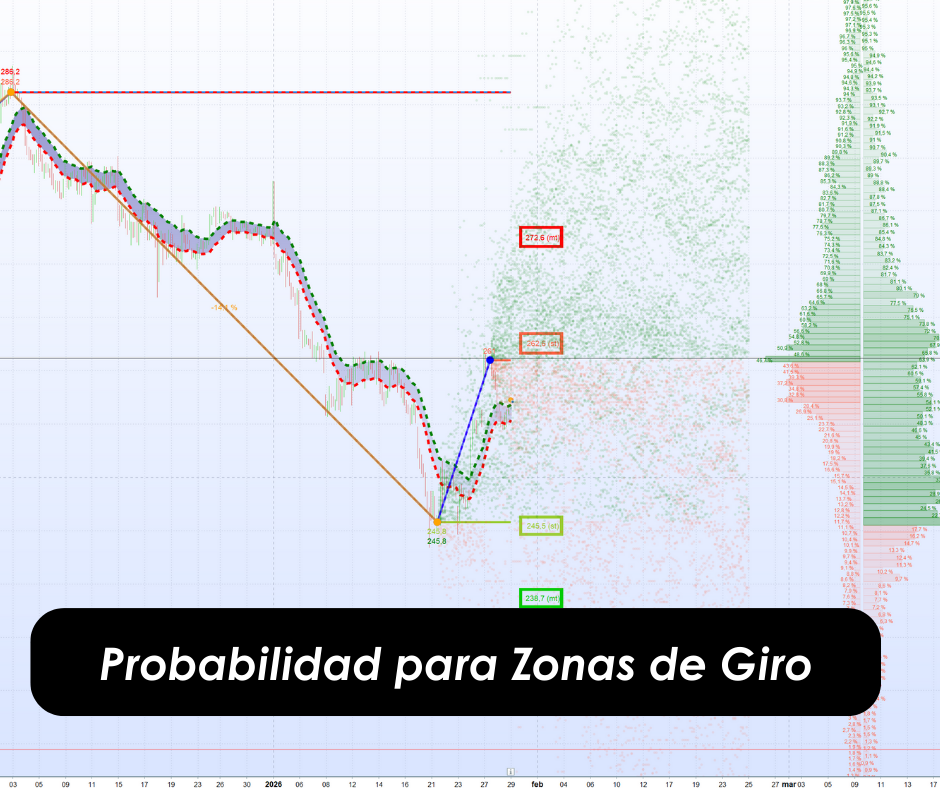
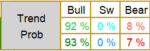
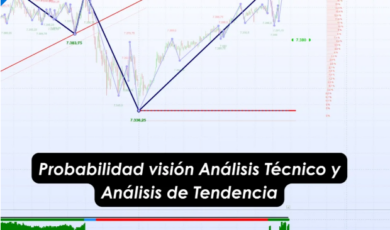
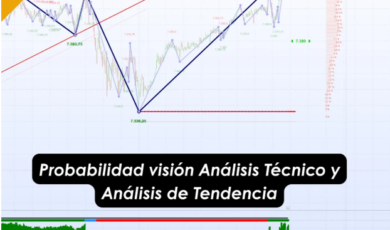
- Clarity on Trend Status: The system definitively determines the current market trend (bullish, sideways, or bearish). Critically, it also calculates and displays the precise price level that would signal the end or breakdown of that trend, giving you clear lines in the sand, as well as the probability for each of the trend scenarios updated in real time.
- Objective Fibonacci Retracements: While other traders are debating where to draw their lines, you will have the market’s true structural levels plotted automatically. The indicator removes the guesswork by calculating and continuously updating Fibonacci retracement levels based on the objectively identified Turning Zones, giving you an objective edge in every setup.
3.2 Advanced Market Diagnostics
The indicator provides sophisticated metrics that offer a multi-dimensional understanding of market behavior, going far beyond simple price action. These “Random Factors” are designed to give you a deeper layer of insight into the character of the current move.
| Metric | Description & “So What?” |
| Randomness Index | Assesses the degree of randomness (0-100) in the price movement following a Turning Zone. A low score suggests a strong, directional move, while a high score suggests choppy action. Values above 50% are better suited for mean reversion strategies. |
| Market Regime | Determines if current conditions are better suited for Directional or Mean Reversion strategies, instantly guiding your tactical approach for the prevailing environment. |
| Beta (Speed) | Calculates the speed of the price move (e.g., points per hour) since the last Turning Zone, providing an objective measure of the market’s current momentum. |
| Expected Value (EV) | Shows the average price level where the asset should be trading based on its recent speed. This acts as a dynamic equilibrium point for the current move. |
| Z-Score | Measures how far the current price has deviated from its Expected Value. Values below -1.68 or above +1.68 represent statistically significant moves that occur only 5% of the time, instantly highlighting over-extended conditions ripe for a reversal. |
3.3 The Power of Probabilistic Analyses
This feature set represents the indicator’s most powerful capability: the ability to build and evaluate future scenarios based on hard historical data.
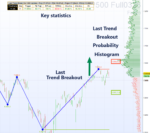
The indicator analyzes historical price action to find past situations that were identical to the current market setup. From this data, it projects a range of probable outcomes, allowing you to assess the odds before you commit. You can run this analysis on three distinct event types:
- Last Turning Zone: Analyze price behavior following the most recently formed Bullish or Bearish Turning Zone.
- Last Trend Break: Analyze what happened historically after the most recent objective trend breakout occurred.
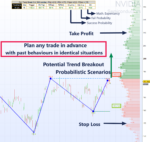
- Potential Trend Break: Project future scenarios based on what has happened in the past when a trend break like the one that could happen next occurred, giving you a powerful forward-looking perspective.
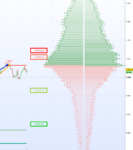
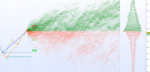
The results are presented with complete transparency via on-chart probability dashboards, histograms, and scatter plots, ensuring you can see the data that underpins every calculation. Now that we’ve explored the indicator’s powerful features, let’s walk through a real-world scenario to see how these data points synthesize into a complete, actionable trade plan.
4.0 Your Invitation to Objective Trading
The “Probability Indicator for Turning Zones” is more than just another tool; it represents a fundamental shift in how traders can approach the markets. It is a professional instrument designed to move you from the world of subjective, biased, and emotional decision-making to an objective, evidence-based methodology.
By automatically identifying key market structure, providing a suite of advanced diagnostics, and—most importantly—running real-time, adaptive backtests, it equips you with a quantifiable edge. This is your invitation to trade not on hope, but on historical precedent; not on emotion, but on expected value. This is the shift from amateur speculation to professional risk management. It’s time to stop guessing and start trading with greater mathematical clarity.
To learn more and see the indicator in action, visit the @InversoresInstitucionales YouTube channel.
Recensioni
Ancora non ci sono recensioni.