
Disclaimer
This screener does not provide buy or sell signals.
It highlights structural market conditions that require trader discretion and proper risk management.
What this screener does
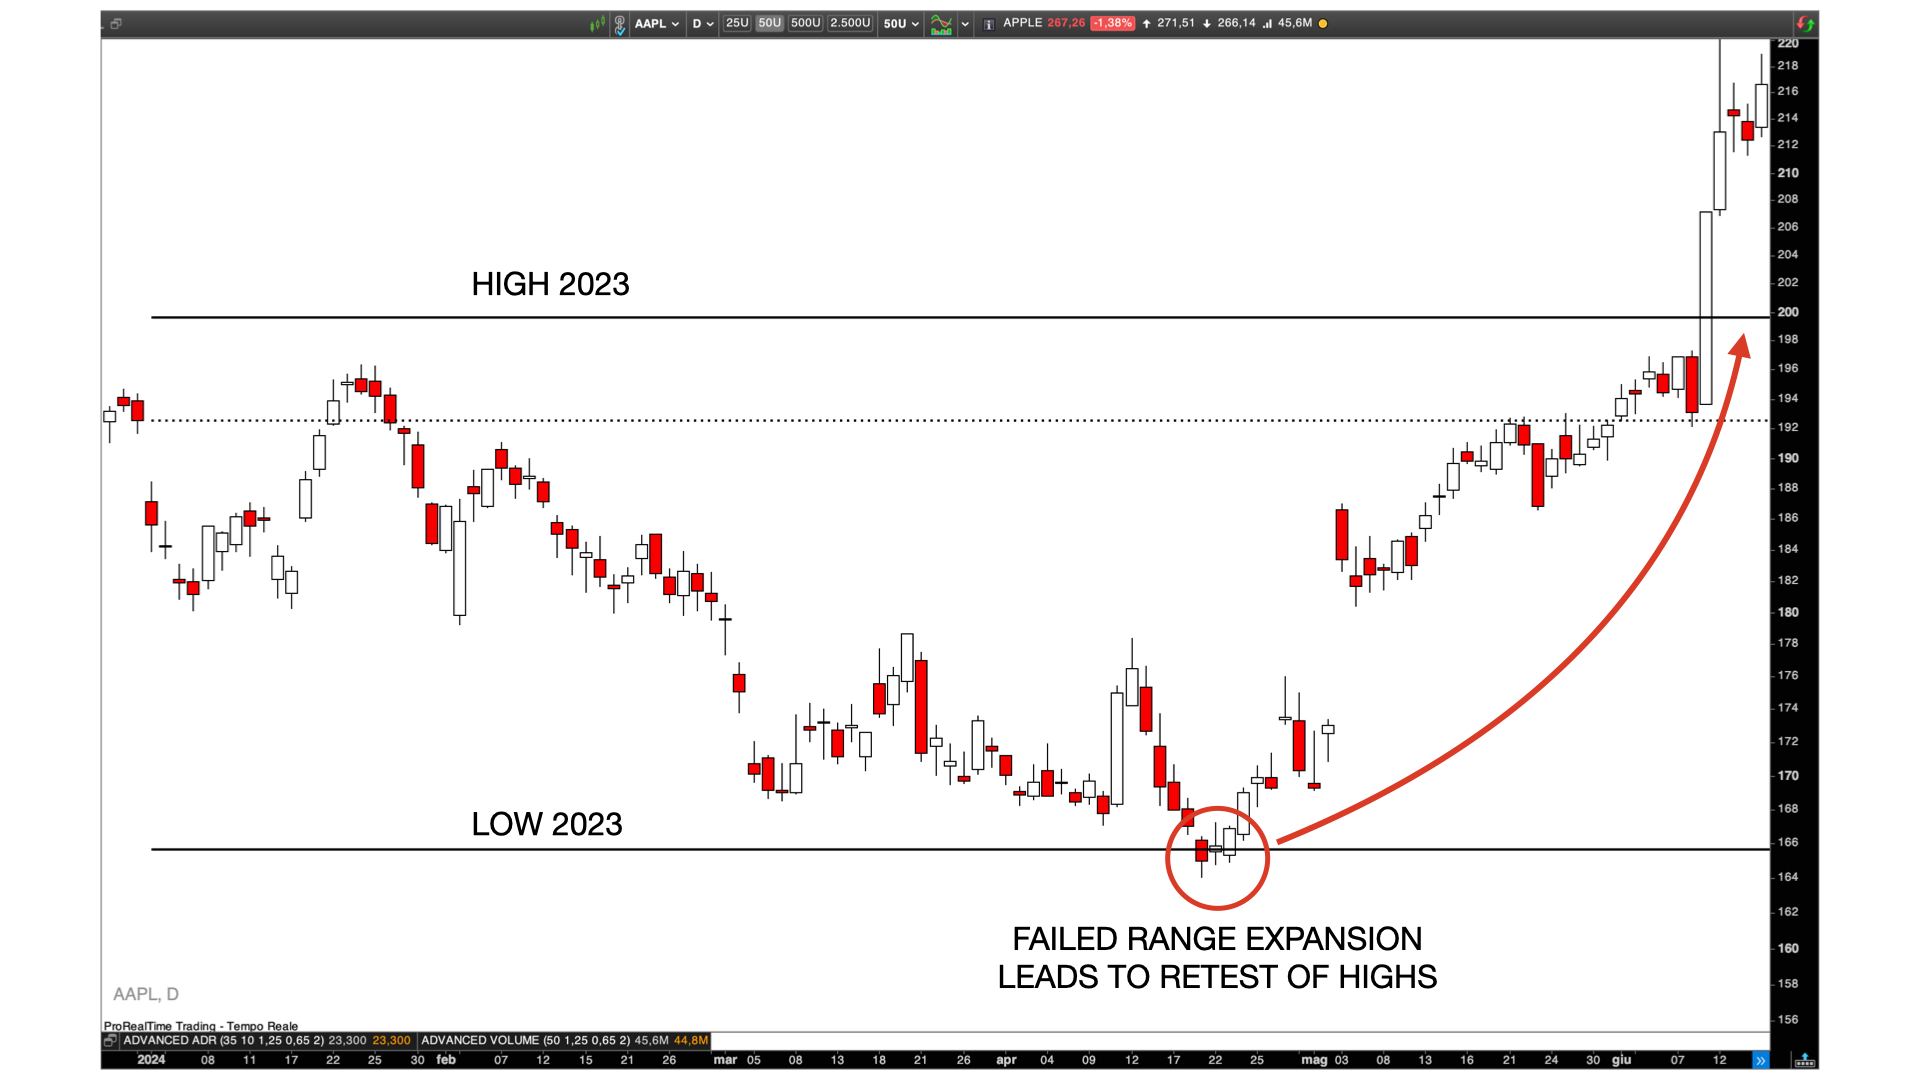
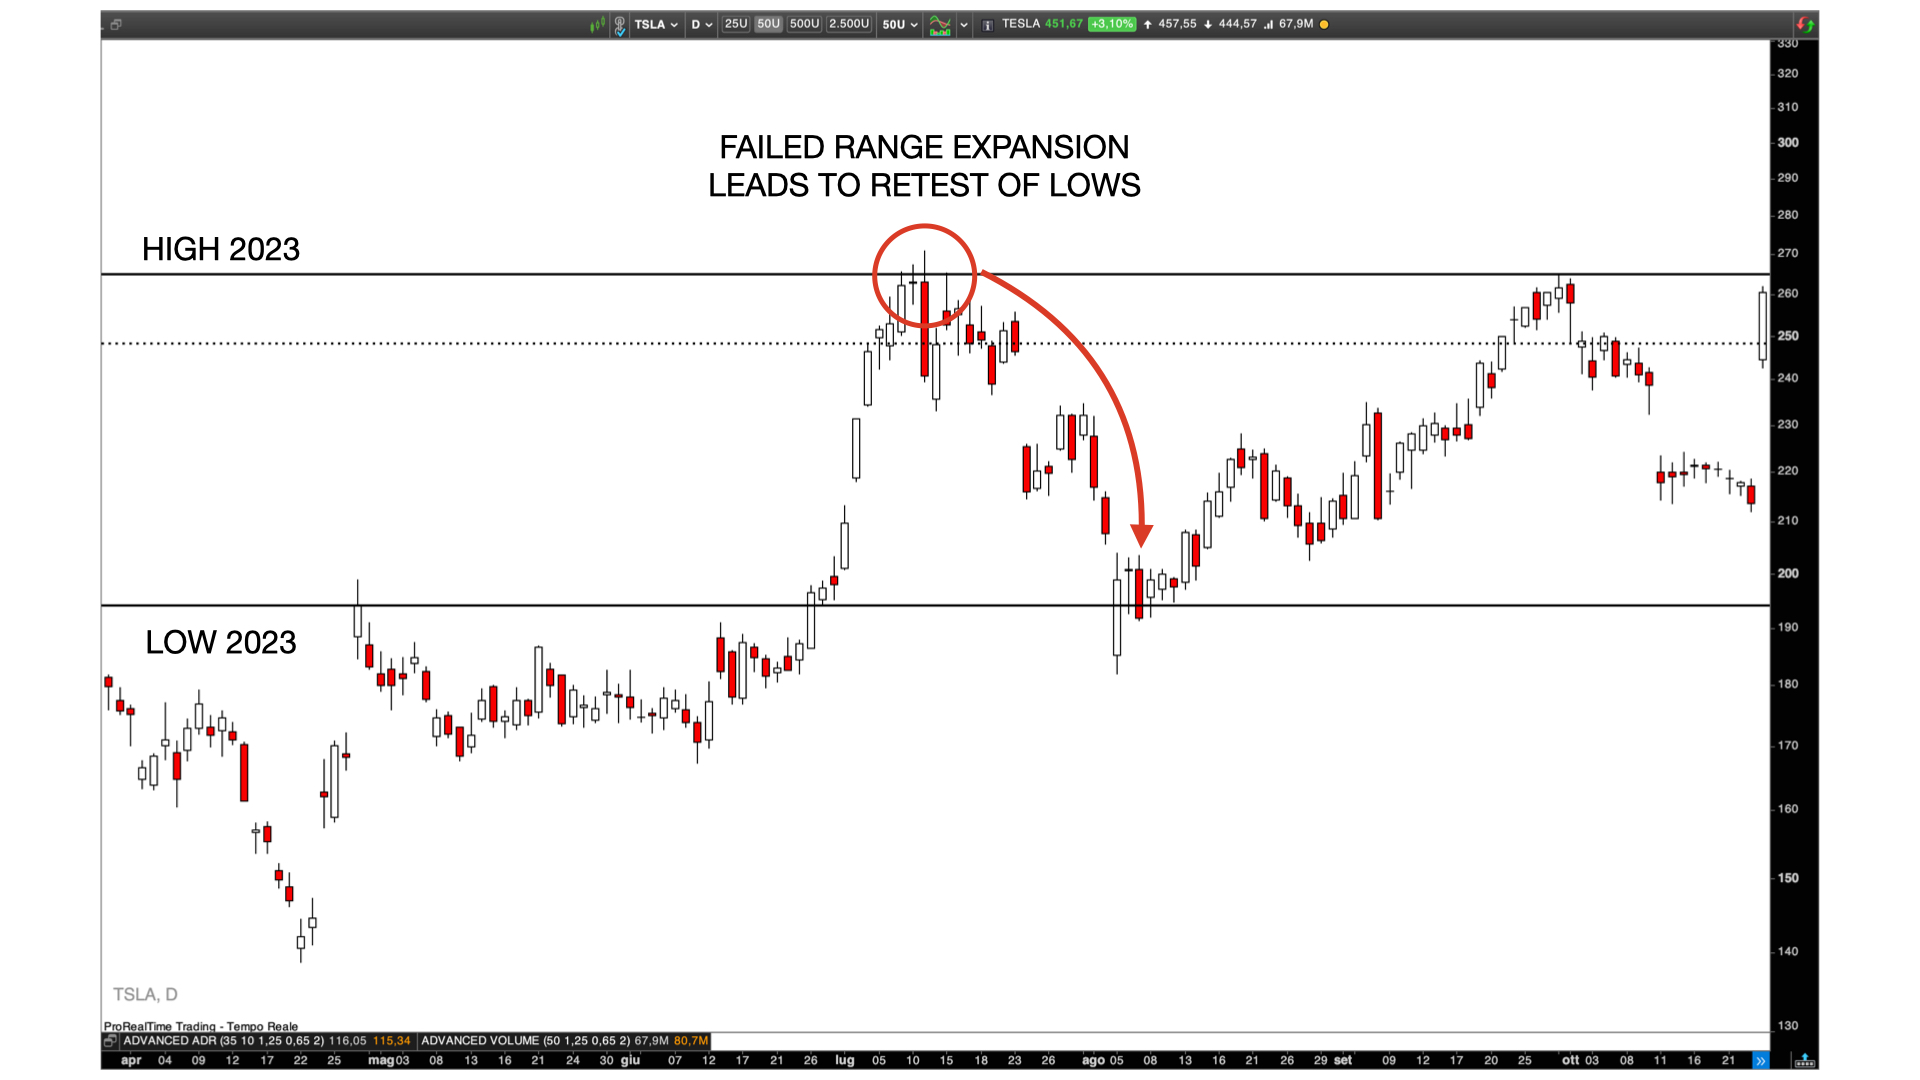
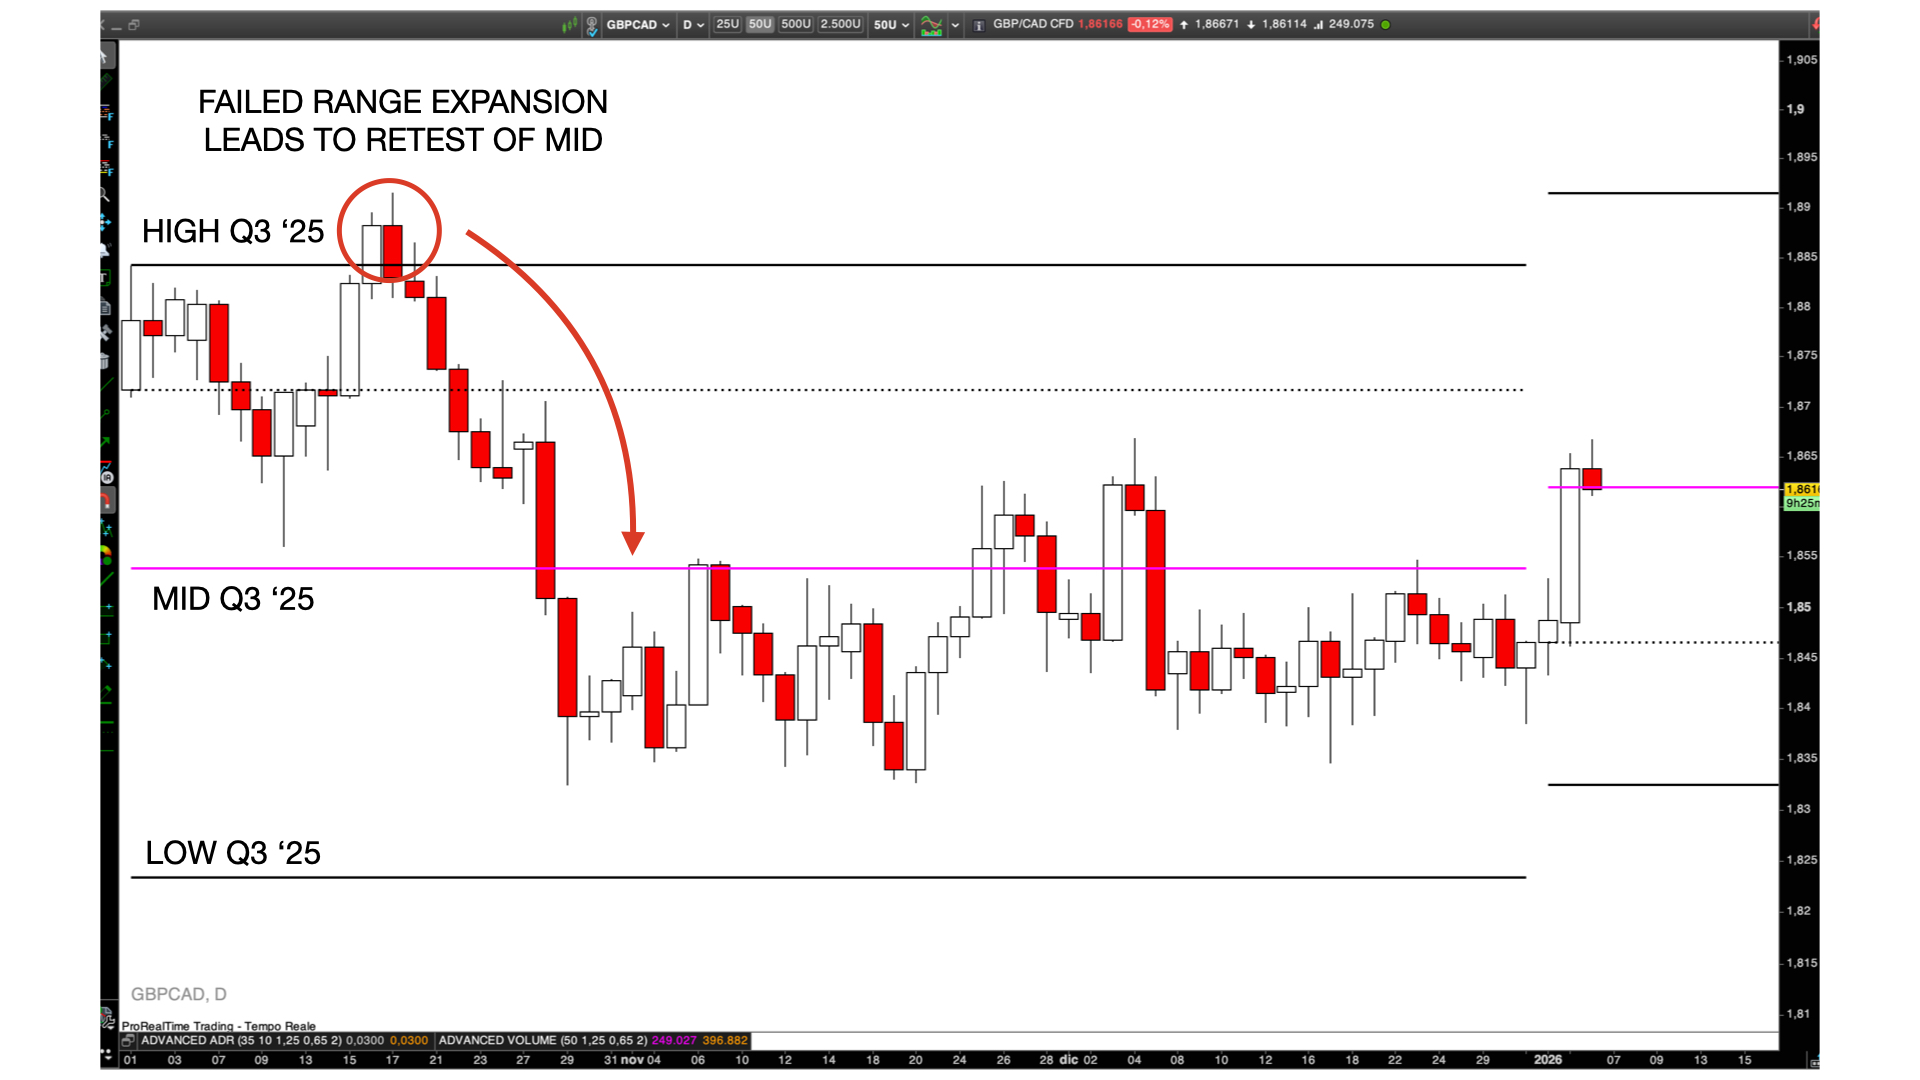
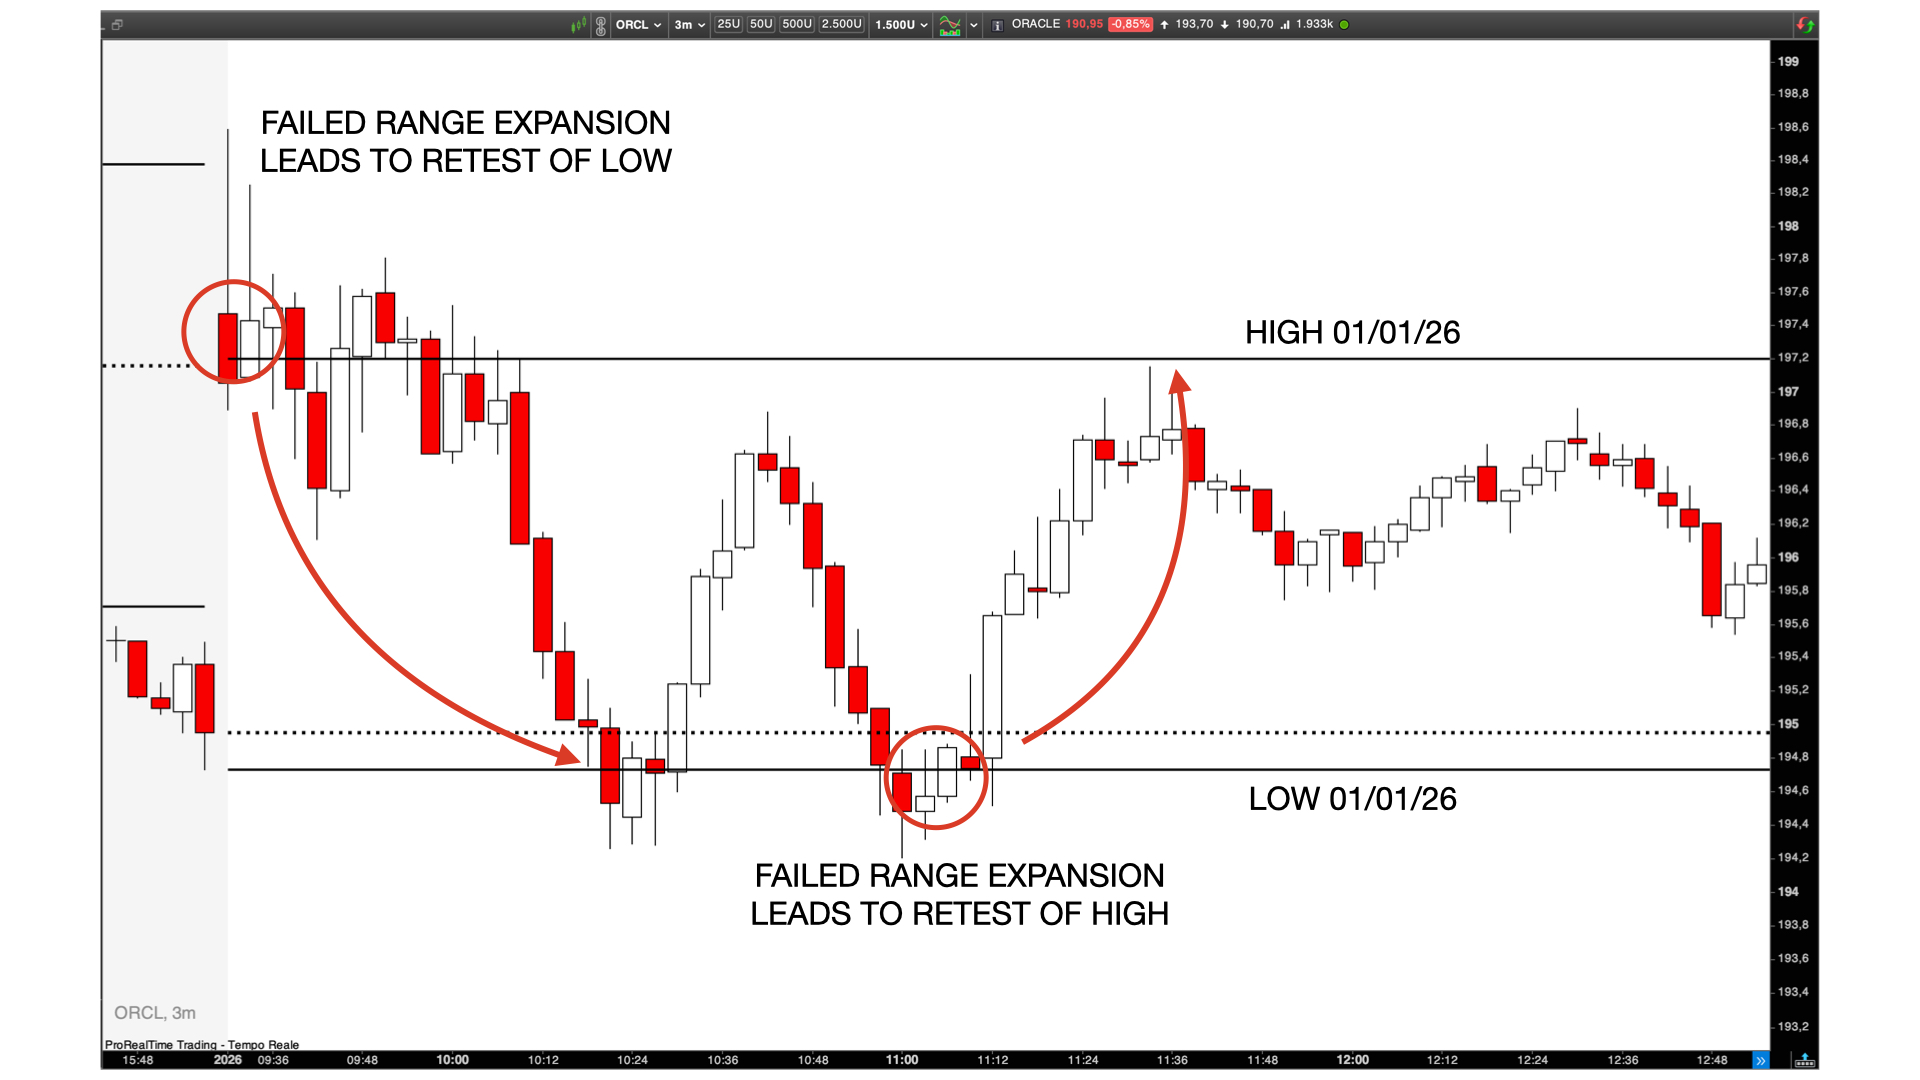
The Pro Failed Range Expansion Screener identifies Failed New Highs and Failed New Lows across multiple timeframes, highlighting situations where price attempts to break a range but is immediately rejected.
These failures often represent:
- Exhaustion of trend
- Institutional absorption
- High-probability mean reversion or reversal areas
The screener works on:
- Daily
- Weekly
- Monthly
- Quarterly
- Yearly
Each detected failure contributes to a global strength score, normalized on a 0–100 scale.
Multi-Timeframe Strength Score
Every timeframe contributes a different weight to the final score:
- Daily → minor structural failure (for day trading purposes)
- Weekly → intermediate context (for swing trading purposes)
- Monthly → major structural failure (for swing/position trading purposes)
- Quarterly / Yearly → long-term market imbalance (for investing purposes)
The higher the score, the deeper and more relevant the failed range expansion across multiple timeframes.
Score interpretation:
- 0–20 → Isolated / weak signal
- 20–40 → Local structural failure
- 40–60 → Multi-timeframe confluence
- 60–80 → Strong structural setup
- 80–100 → Major failed expansion on higher timeframes
Screener settings and timeframe selection
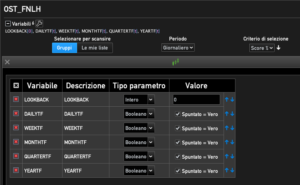
The screener includes a set of user-controlled parameters that define how far back the analysis is performed and which market structure levels are evaluated.
LOOKBACK (default 0) defines how many past bars are scanned to verify whether a Failed Range Expansion has already occurred. A value of 0 restricts the analysis to the current bar only, while higher values allow the screener to check if a failed breakout of highs or lows happened within the last X bars or days, depending on the Period setting. Increasing the LOOKBACK is particularly useful when searching for recent but not immediate failed expansions, helping traders identify structural failures that are still relevant but not necessarily forming on the latest candle..
The DAYTF, WEEKTF, MONTHTF, QUARTERTF and YEARTF flags allow you to enable or disable the detection of Failed New Highs / Failed New Lows on specific timeframes, making the screener fully adaptable to different trading horizons. You can select as many flags as you want.
The Period used to run the screener should be consistent with the selected flag:
- When DAYTF is enabled, the screener is best executed on intraday charts (e.g. 5-minute or 15-minute) for day-trading and short-term mean reversion.
- When WEEKTF is enabled, a 1H or 4h timeframe is recommended for swing trading.
- When MONTHTF is enabled, the screener should be run on daily or weekly charts to capture medium-term structural failures.
- When QUARTERTF or YEARTF are enabled, the screener is ideally used on daily or weekly charts, focusing on long-term market structure and high-conviction position or investment setups.
By combining the appropriate timeframe with the selected flags, the screener adapts seamlessly from short-term trading to long-term investing, while preserving the same underlying logic.
Integrated Multi-Timeframe Pivot Levels
The package includes an integrated pivot levels indicator, plotting key support and resistance levels across multiple timeframes (daily, weekly, monthly, quarterly and yearly).
These levels allow traders to visually confirm Failed Range Expansions, clearly identifying where price attempted to break a structural level and was rejected.
By combining the screener with multi-timeframe pivot levels, users can:
- Immediately visualize failed breakouts and false range expansions
- Assess confluence between price rejection and higher-timeframe structure
- Improve execution timing and contextual awareness
- Reduce subjective interpretation when validating screener results
This visual layer transforms the screener output into a complete market structure toolkit, supporting disciplined decision-making across day trading, swing trading, position trading and long-term investing.
How to use it
This screener adapts to any trading style depending on the timeframe you focus on:
- Day trading → Daily / Weekly failures
- Swing trading → Weekly / Monthly failures
- Position trading → Monthly / Quarterly failures
- Long-term investing → Quarterly / Yearly failures
Use the score to:
- Rank instruments by structural importance
- Filter only high-quality failed expansions
- Combine with your own execution strategy (price action, options, mean reversion, trend pullbacks)
Who this screener is for
✔ Traders who understand market structure
✔ Price action and mean-reversion traders
✔ Day, Swing and Position traders
✔ Investors looking for structural dip opportunities
Not designed for:
- Automated trading
- Signal-following without contextual analysis
- Beginners with no price action knowledge
Avis
Il n’y a pas encore d’avis.