

Features
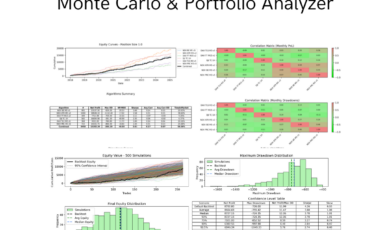
- Visualize the correlation between your algorithms
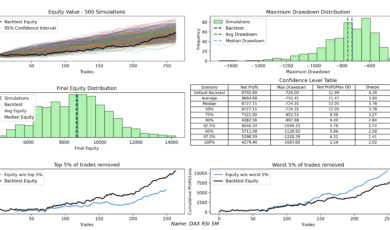
- View your combined portfolio equity curve and maximum drawdown
- Track your drawdown over time
- Analyze how often each of your algorithms is active
- Discover the optimal combination of strategies for better risk-adjusted returns
Why Use Portfolio Analyzer?
- Get a clear, comprehensive overview of all your algorithms in one dashboard
- Understand your combined portfolio drawdown—the more diversified your algos are, the lower your total drawdown will likely be
- Improve your position sizing based on portfolio-level drawdown statistics
- Find the optimal subset of your algorithms. For example, you may have 10 algos, but the best risk-adjusted return could come from trading just 8 of them
- See how correlated your strategies are
- If you want to visualize your portfolio’s total cumulative equity curve, you can set the position size to match your total number of contracts (e.g., 10 contracts if you trade 10 algos with 1 contract each)
How to Use Portfolio Analyzer
- Backtest each algorithm in ProRealTime using the same position size (e.g., 1 contract). Ensure consistency across markets. (1 contract on US100 ≈ 0.5 contract on Wall Street Cash)
- Go to the Closed Position List tab in the backtest dashboard
- Click the three dots in the top right corner and choose Export as .CSV
- Import the .csv files into the Portfolio Analyzer
- Click “Run Portfolio Analysis” to view the dashboard. Or, choose an optimization metric (e.g., Sharpe ratio, Net Profit / Max DD) and click “Compute Best Portfolio” to see the optimal combination
- To save down an image of your dashboard, click the “Save image” icon in the bottom screen left corner.
How to Install Portfolio Analyzer for Algorithmic Trading
- Purchase and download the setup.exe file.
- Click the portfolioAnalyzer_setup_v1.9 and follow the installation steps.
- Start analyzing!
If Microsoft Defender Smart Screen pops up when installing, click “More Information” and then “Run Anyway”.
FAQ
How is the “Combined” curve and statistics calculated?
The combined data is based on a daily aggregator, where all algorithms are treated equally.
This means that if you import 10 algorithms and each has a position size of 1, the combined result will reflect trading 0.1 contracts per algorithm.
If you import only 5 .CSV files, the combined data will instead use 0.2 contracts per algorithm to maintain consistency.
This approach ensures that you can compare a 5-algo portfolio with a 10-algo portfolio, and still get meaningful, comparable results.
What’s considered a high correlation?
For a well-diversified portfolio, avoid trading strategies with a drawdown correlation above 0.50. High correlation may indicate overlap in behavior, reducing diversification benefits.
Why doesn’t “Time in Market” match ProRealTime exactly?
The program uses a faster (but slightly less precise) method to calculate time in market to optimize calculation speed.
Works on Windows 10/11.
For bug reports or feature requests, feel free to email me at snalanningen@gmail.com
Recensioni
Ancora non ci sono recensioni.