

 SCHNELLE &
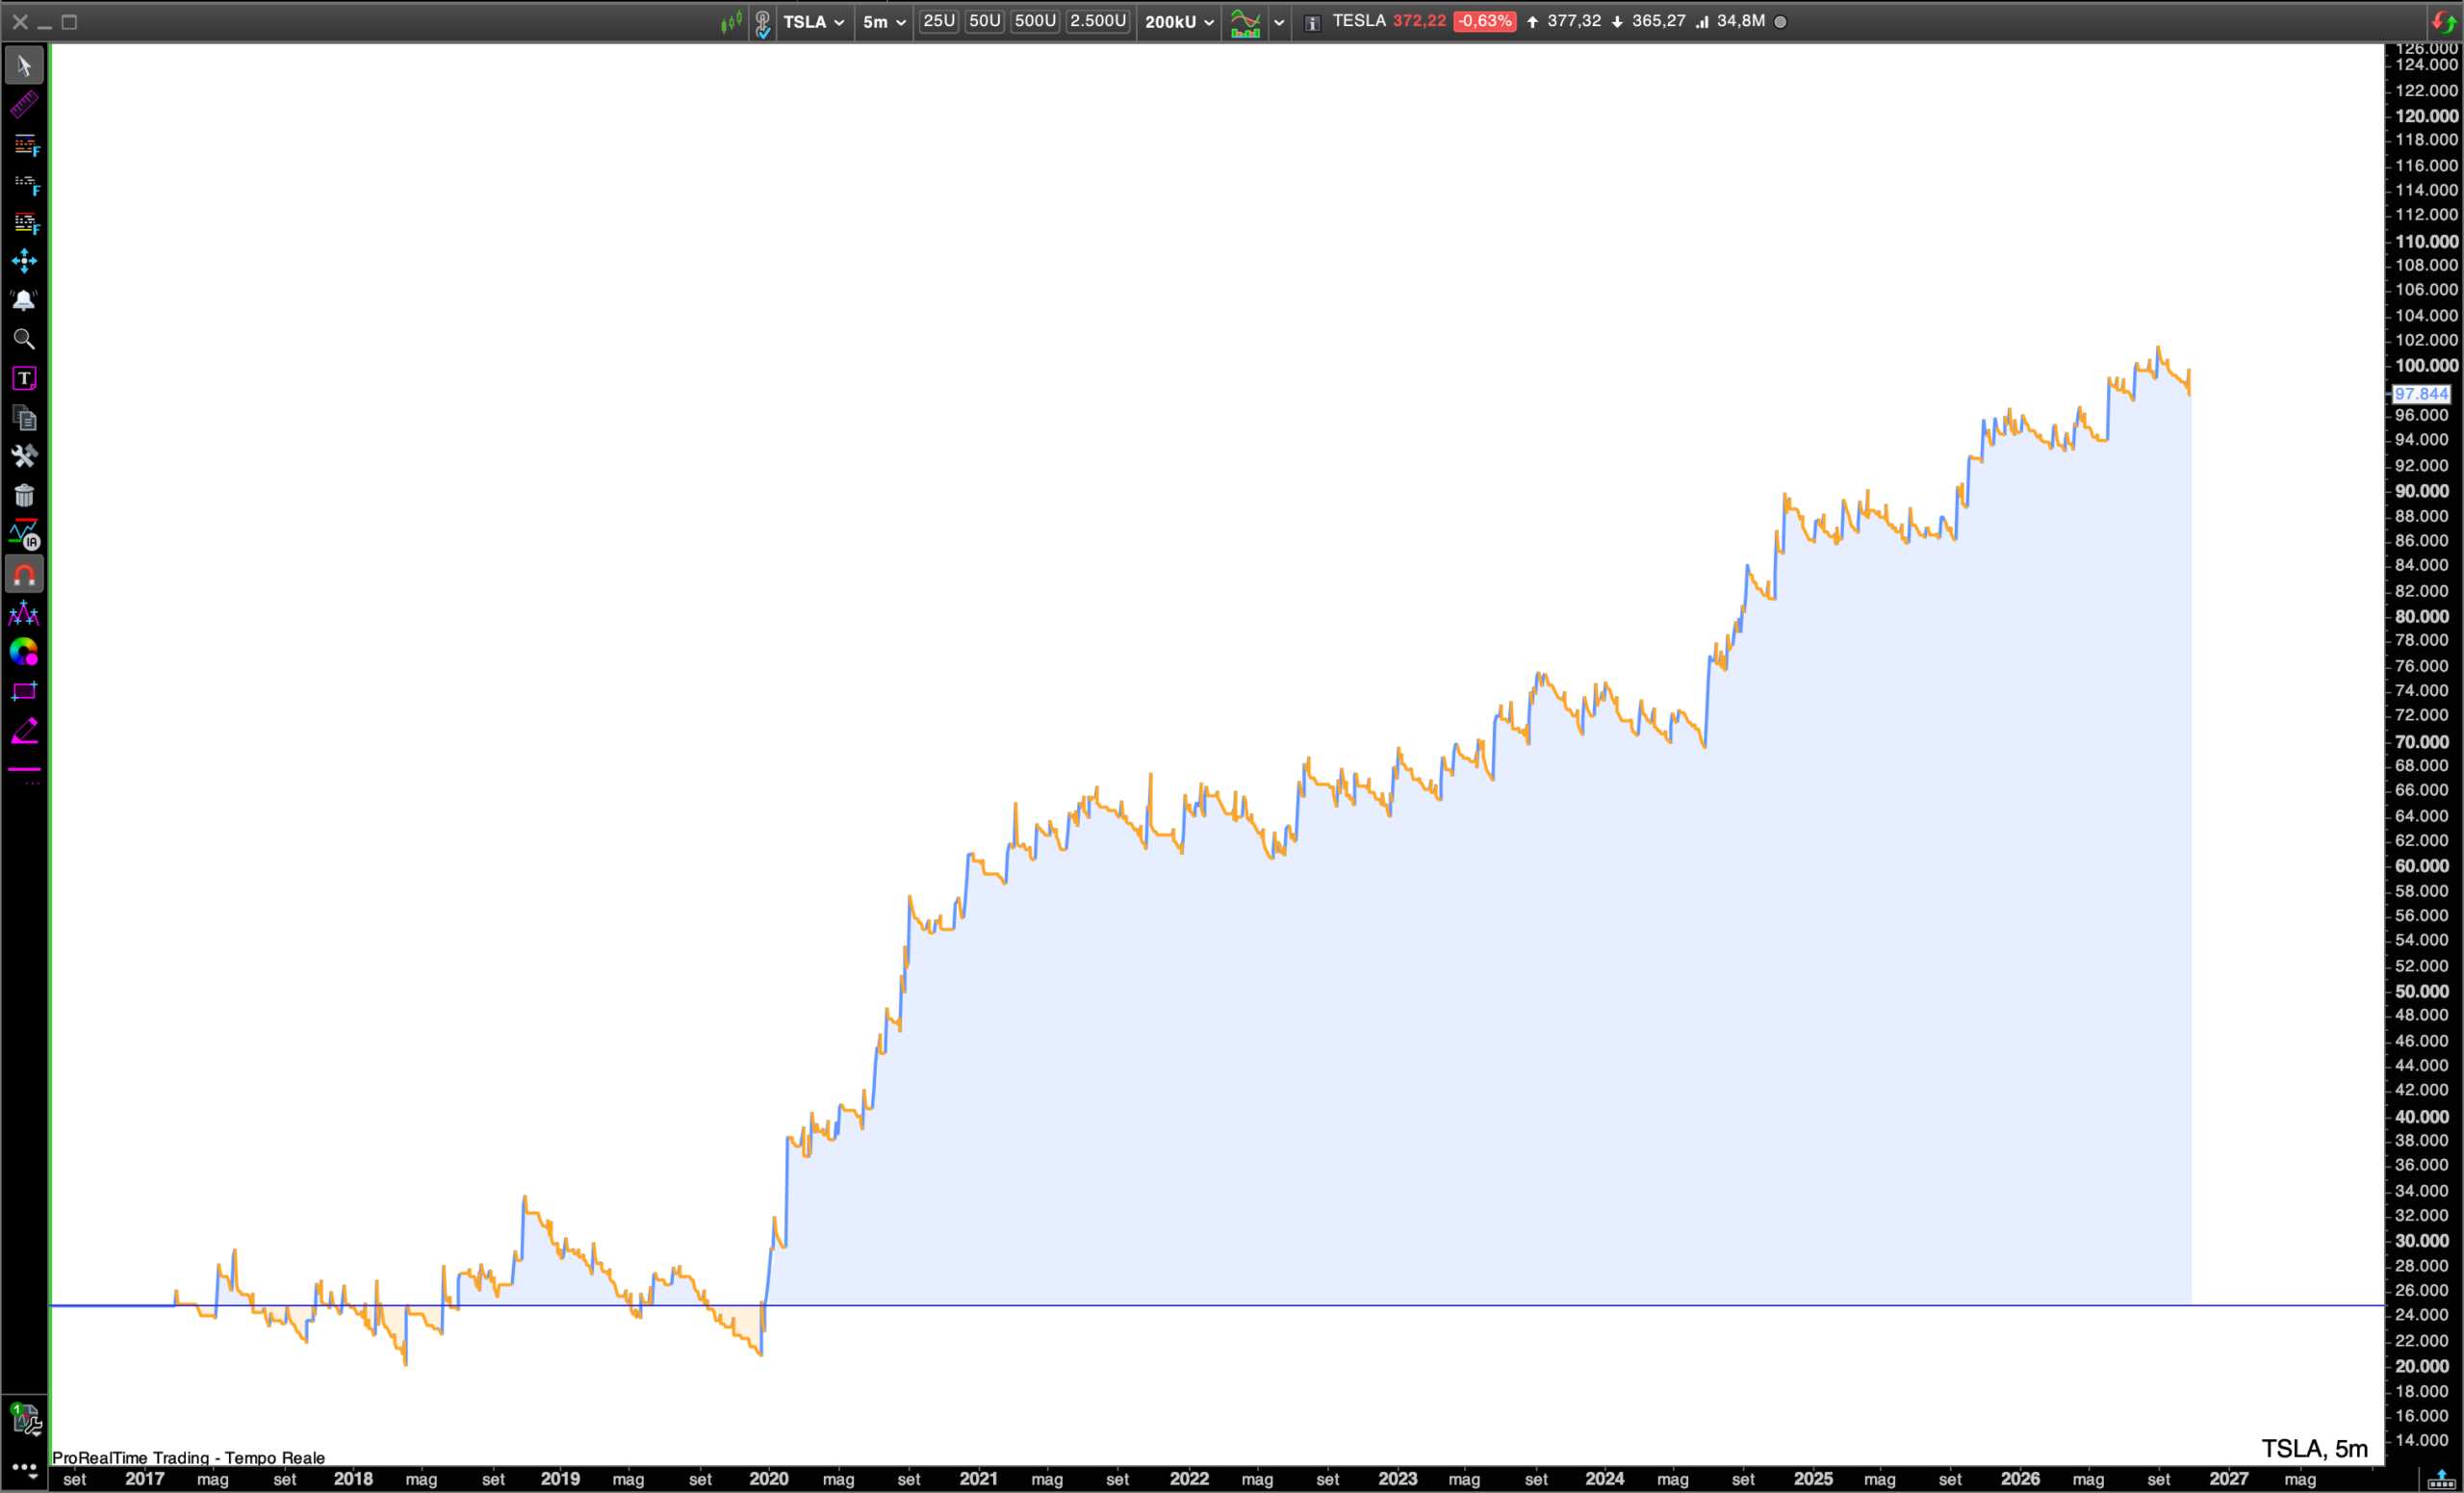
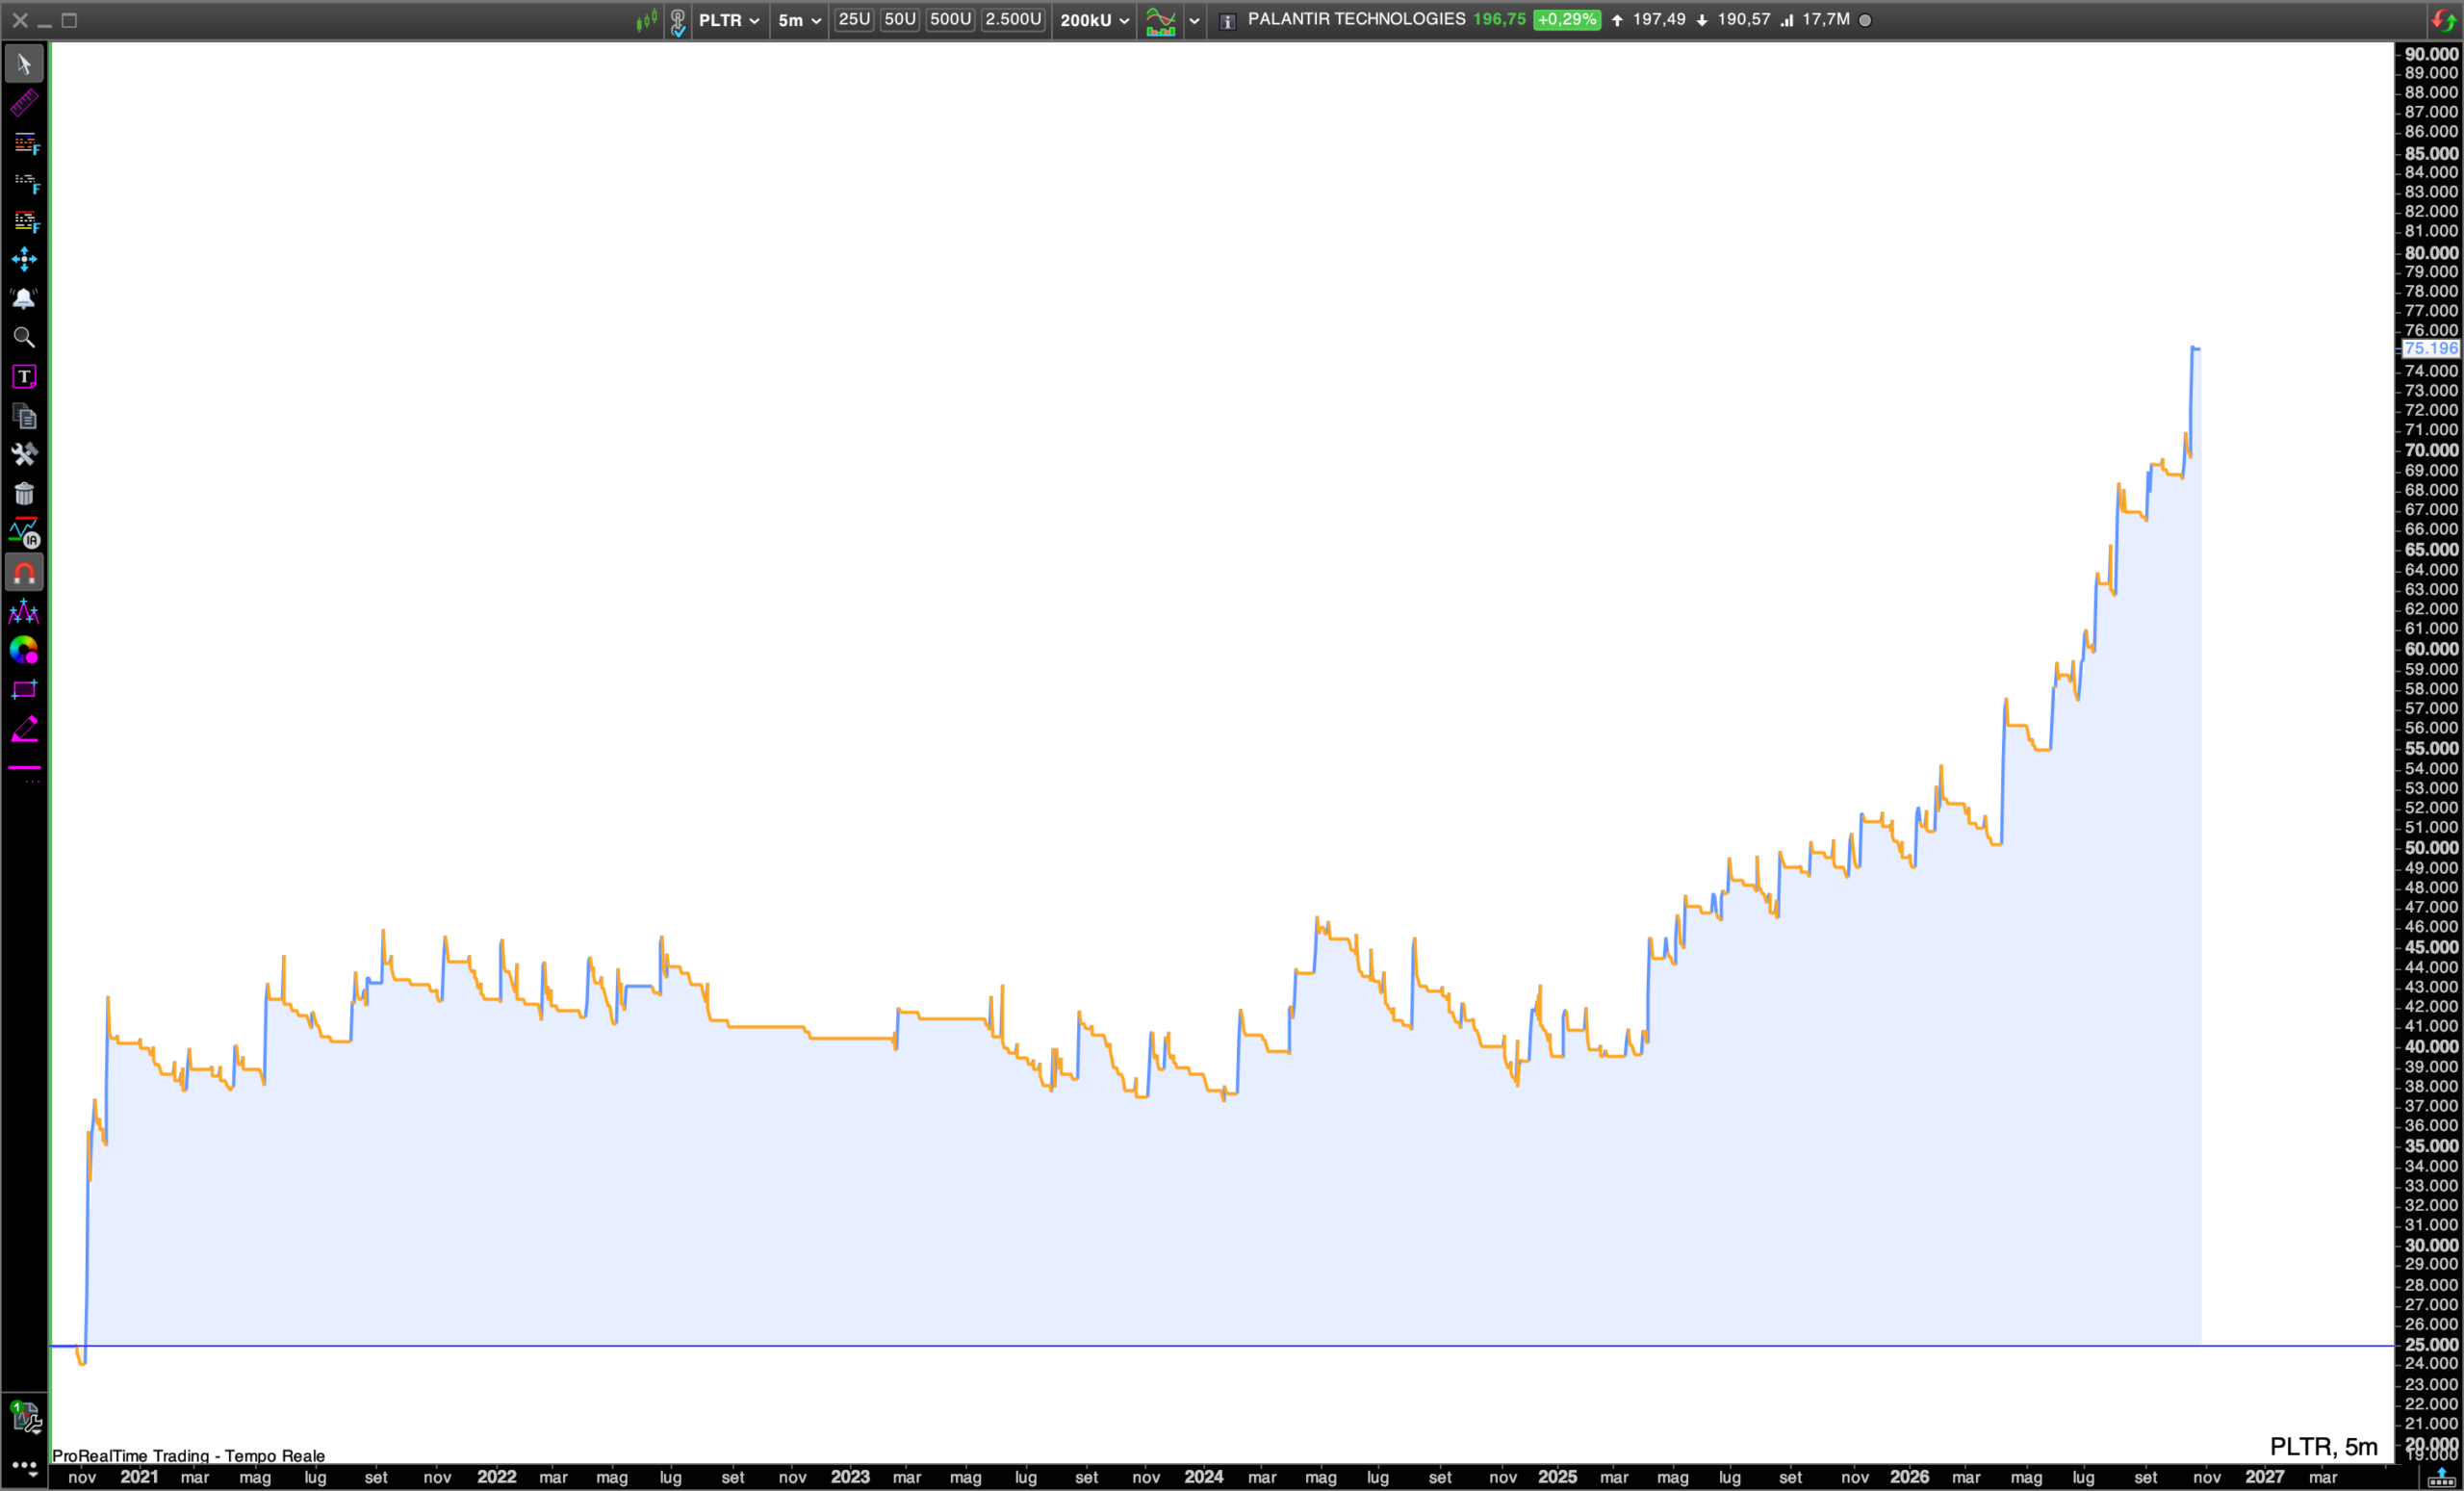
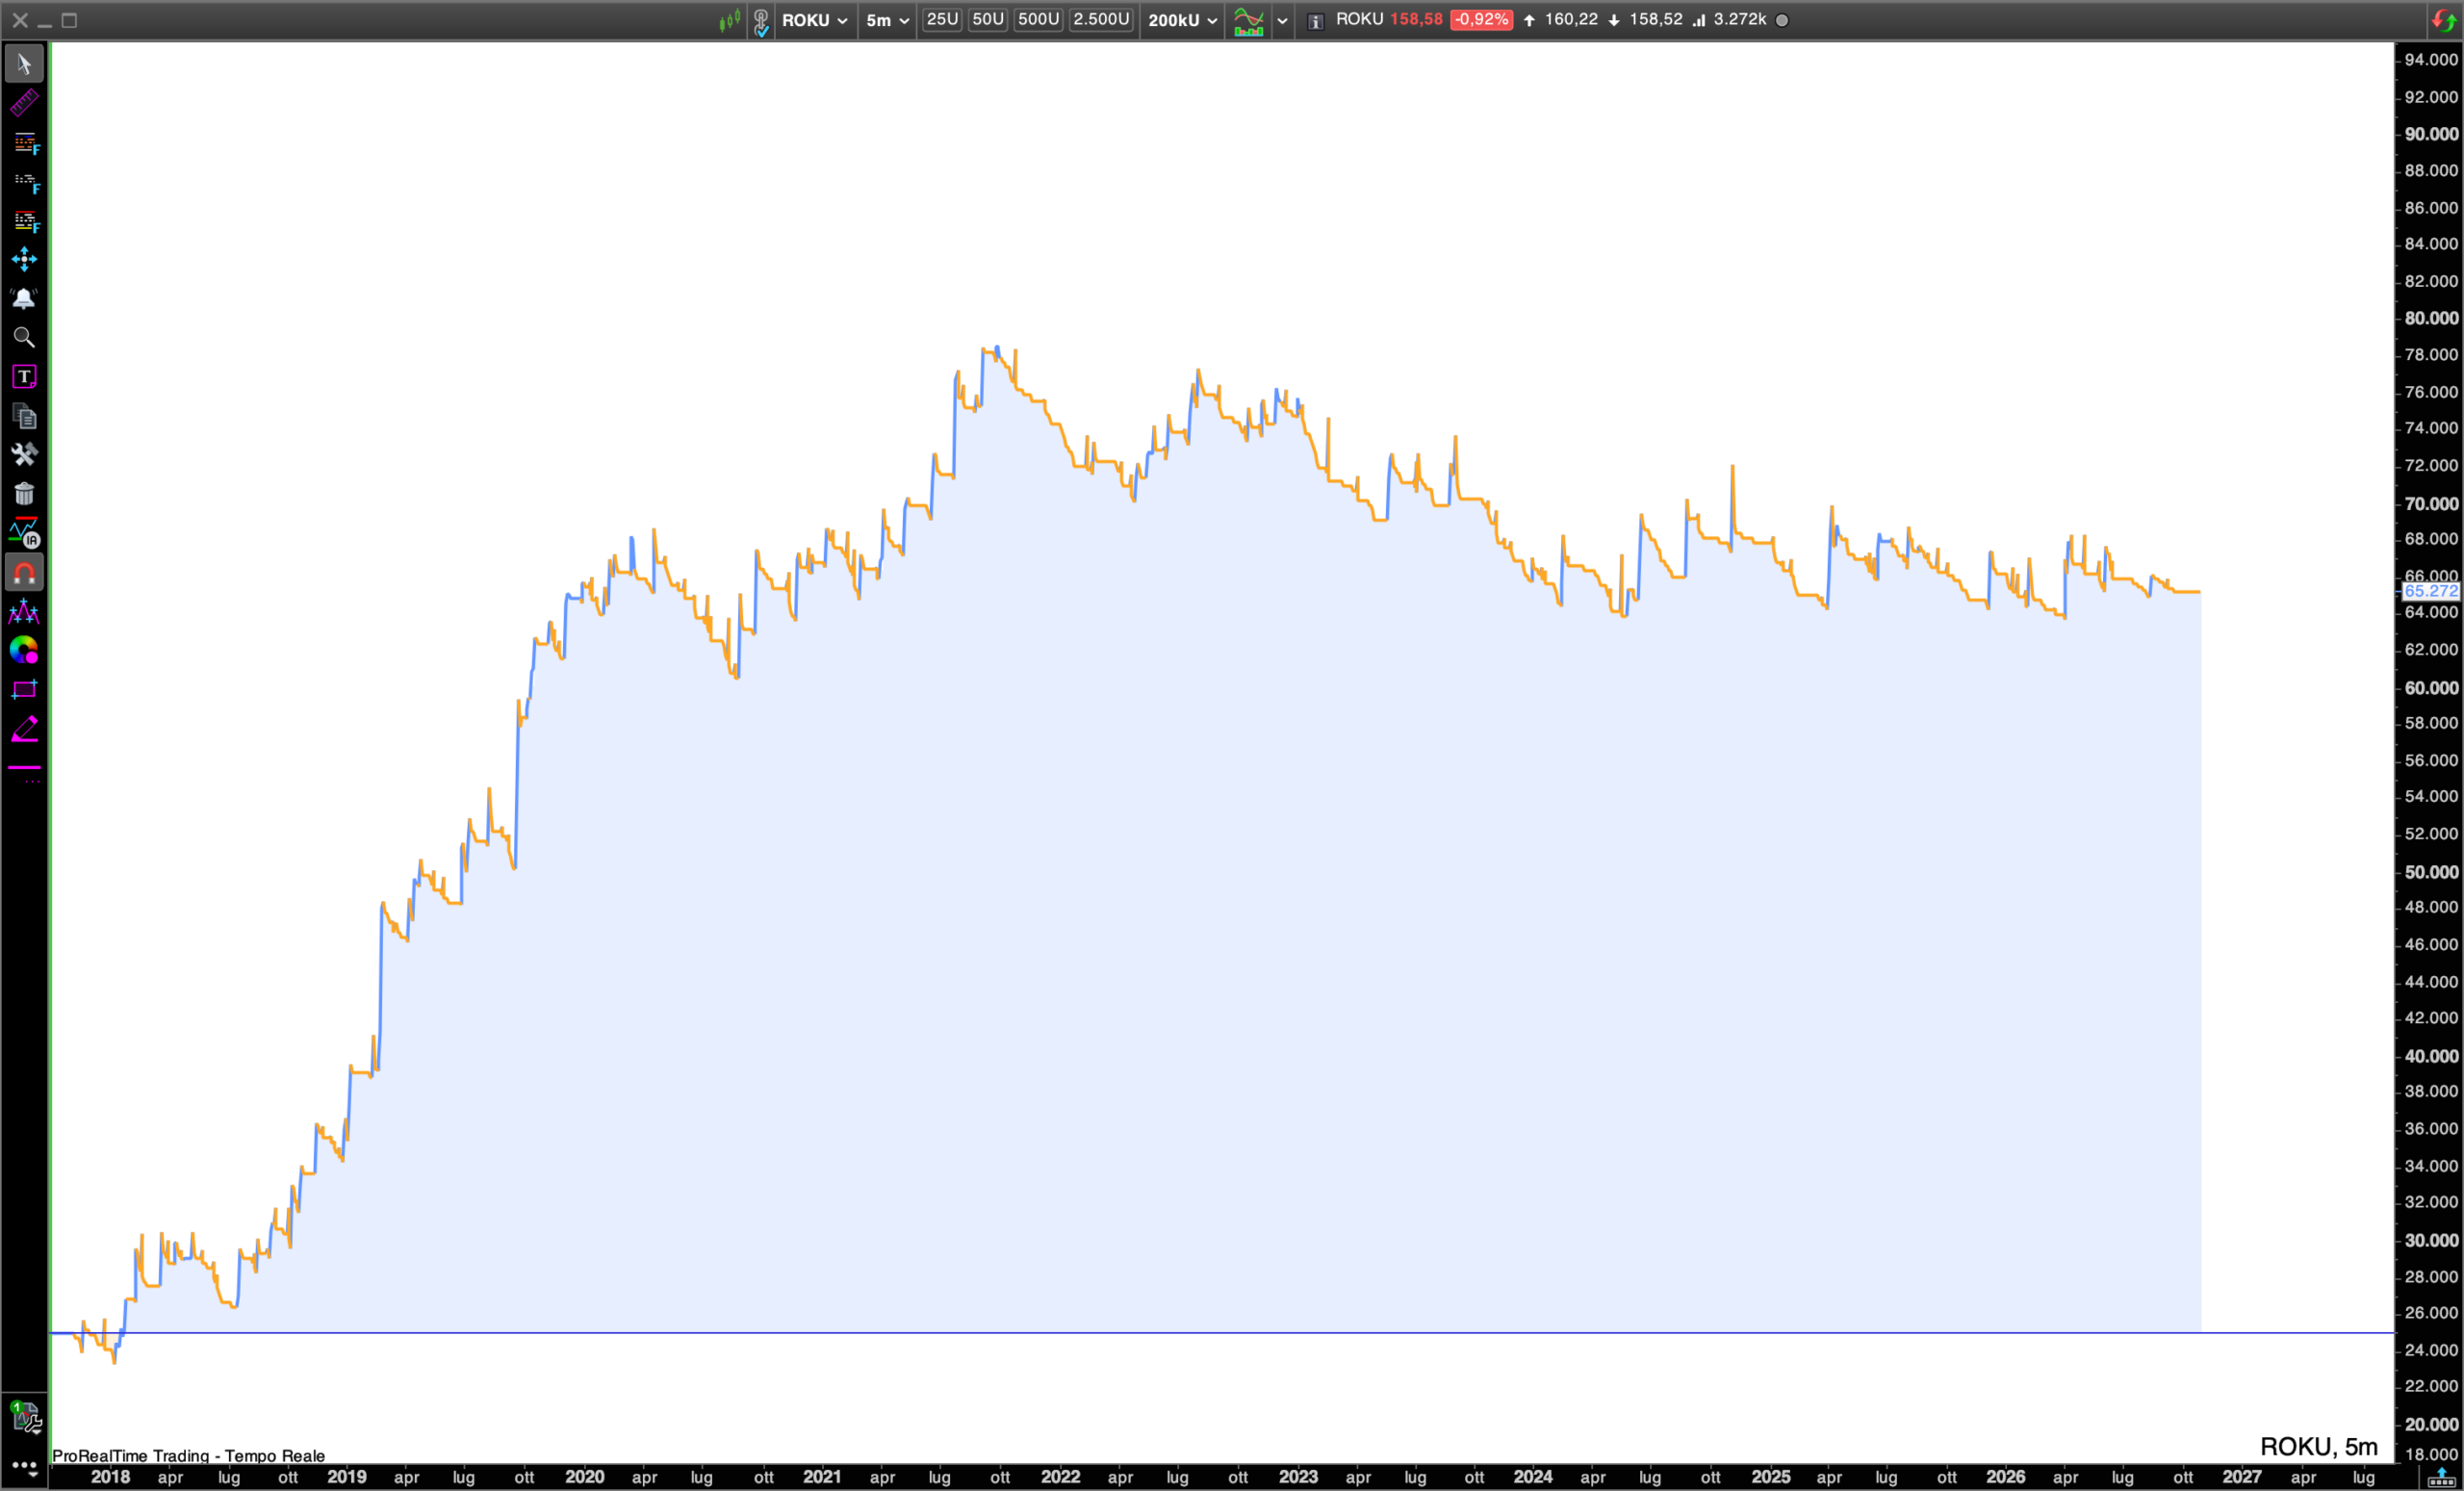
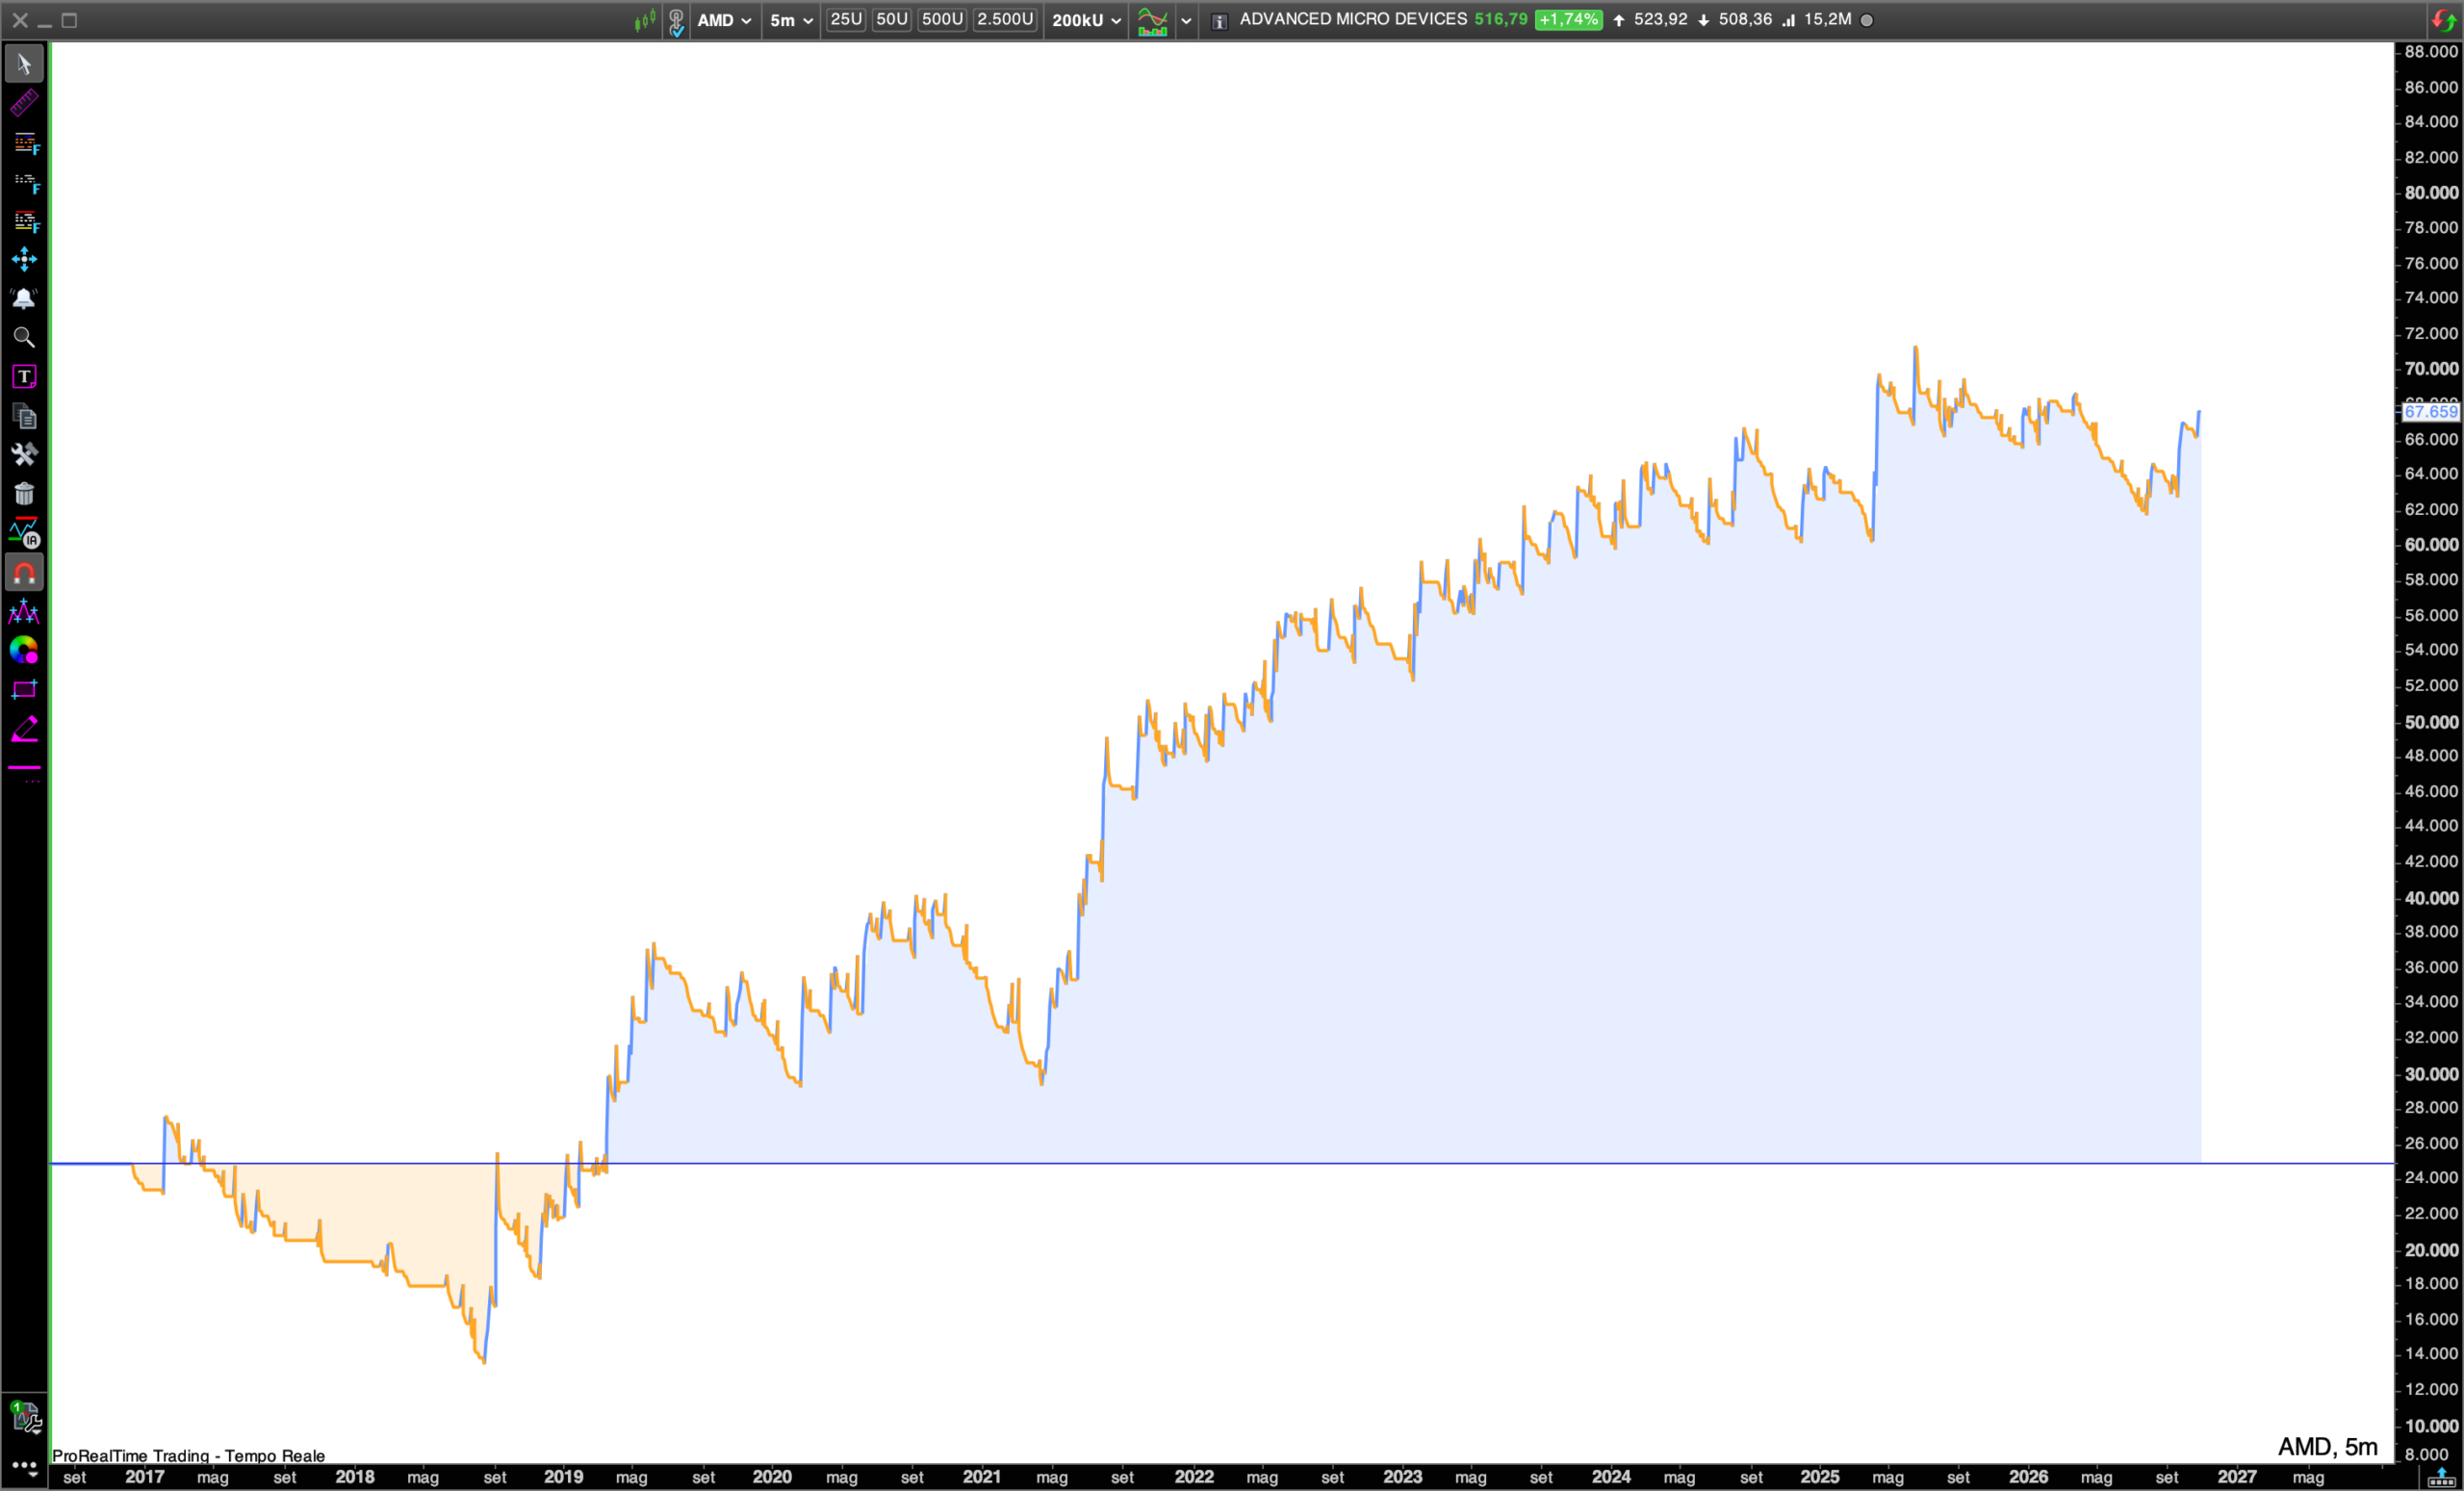
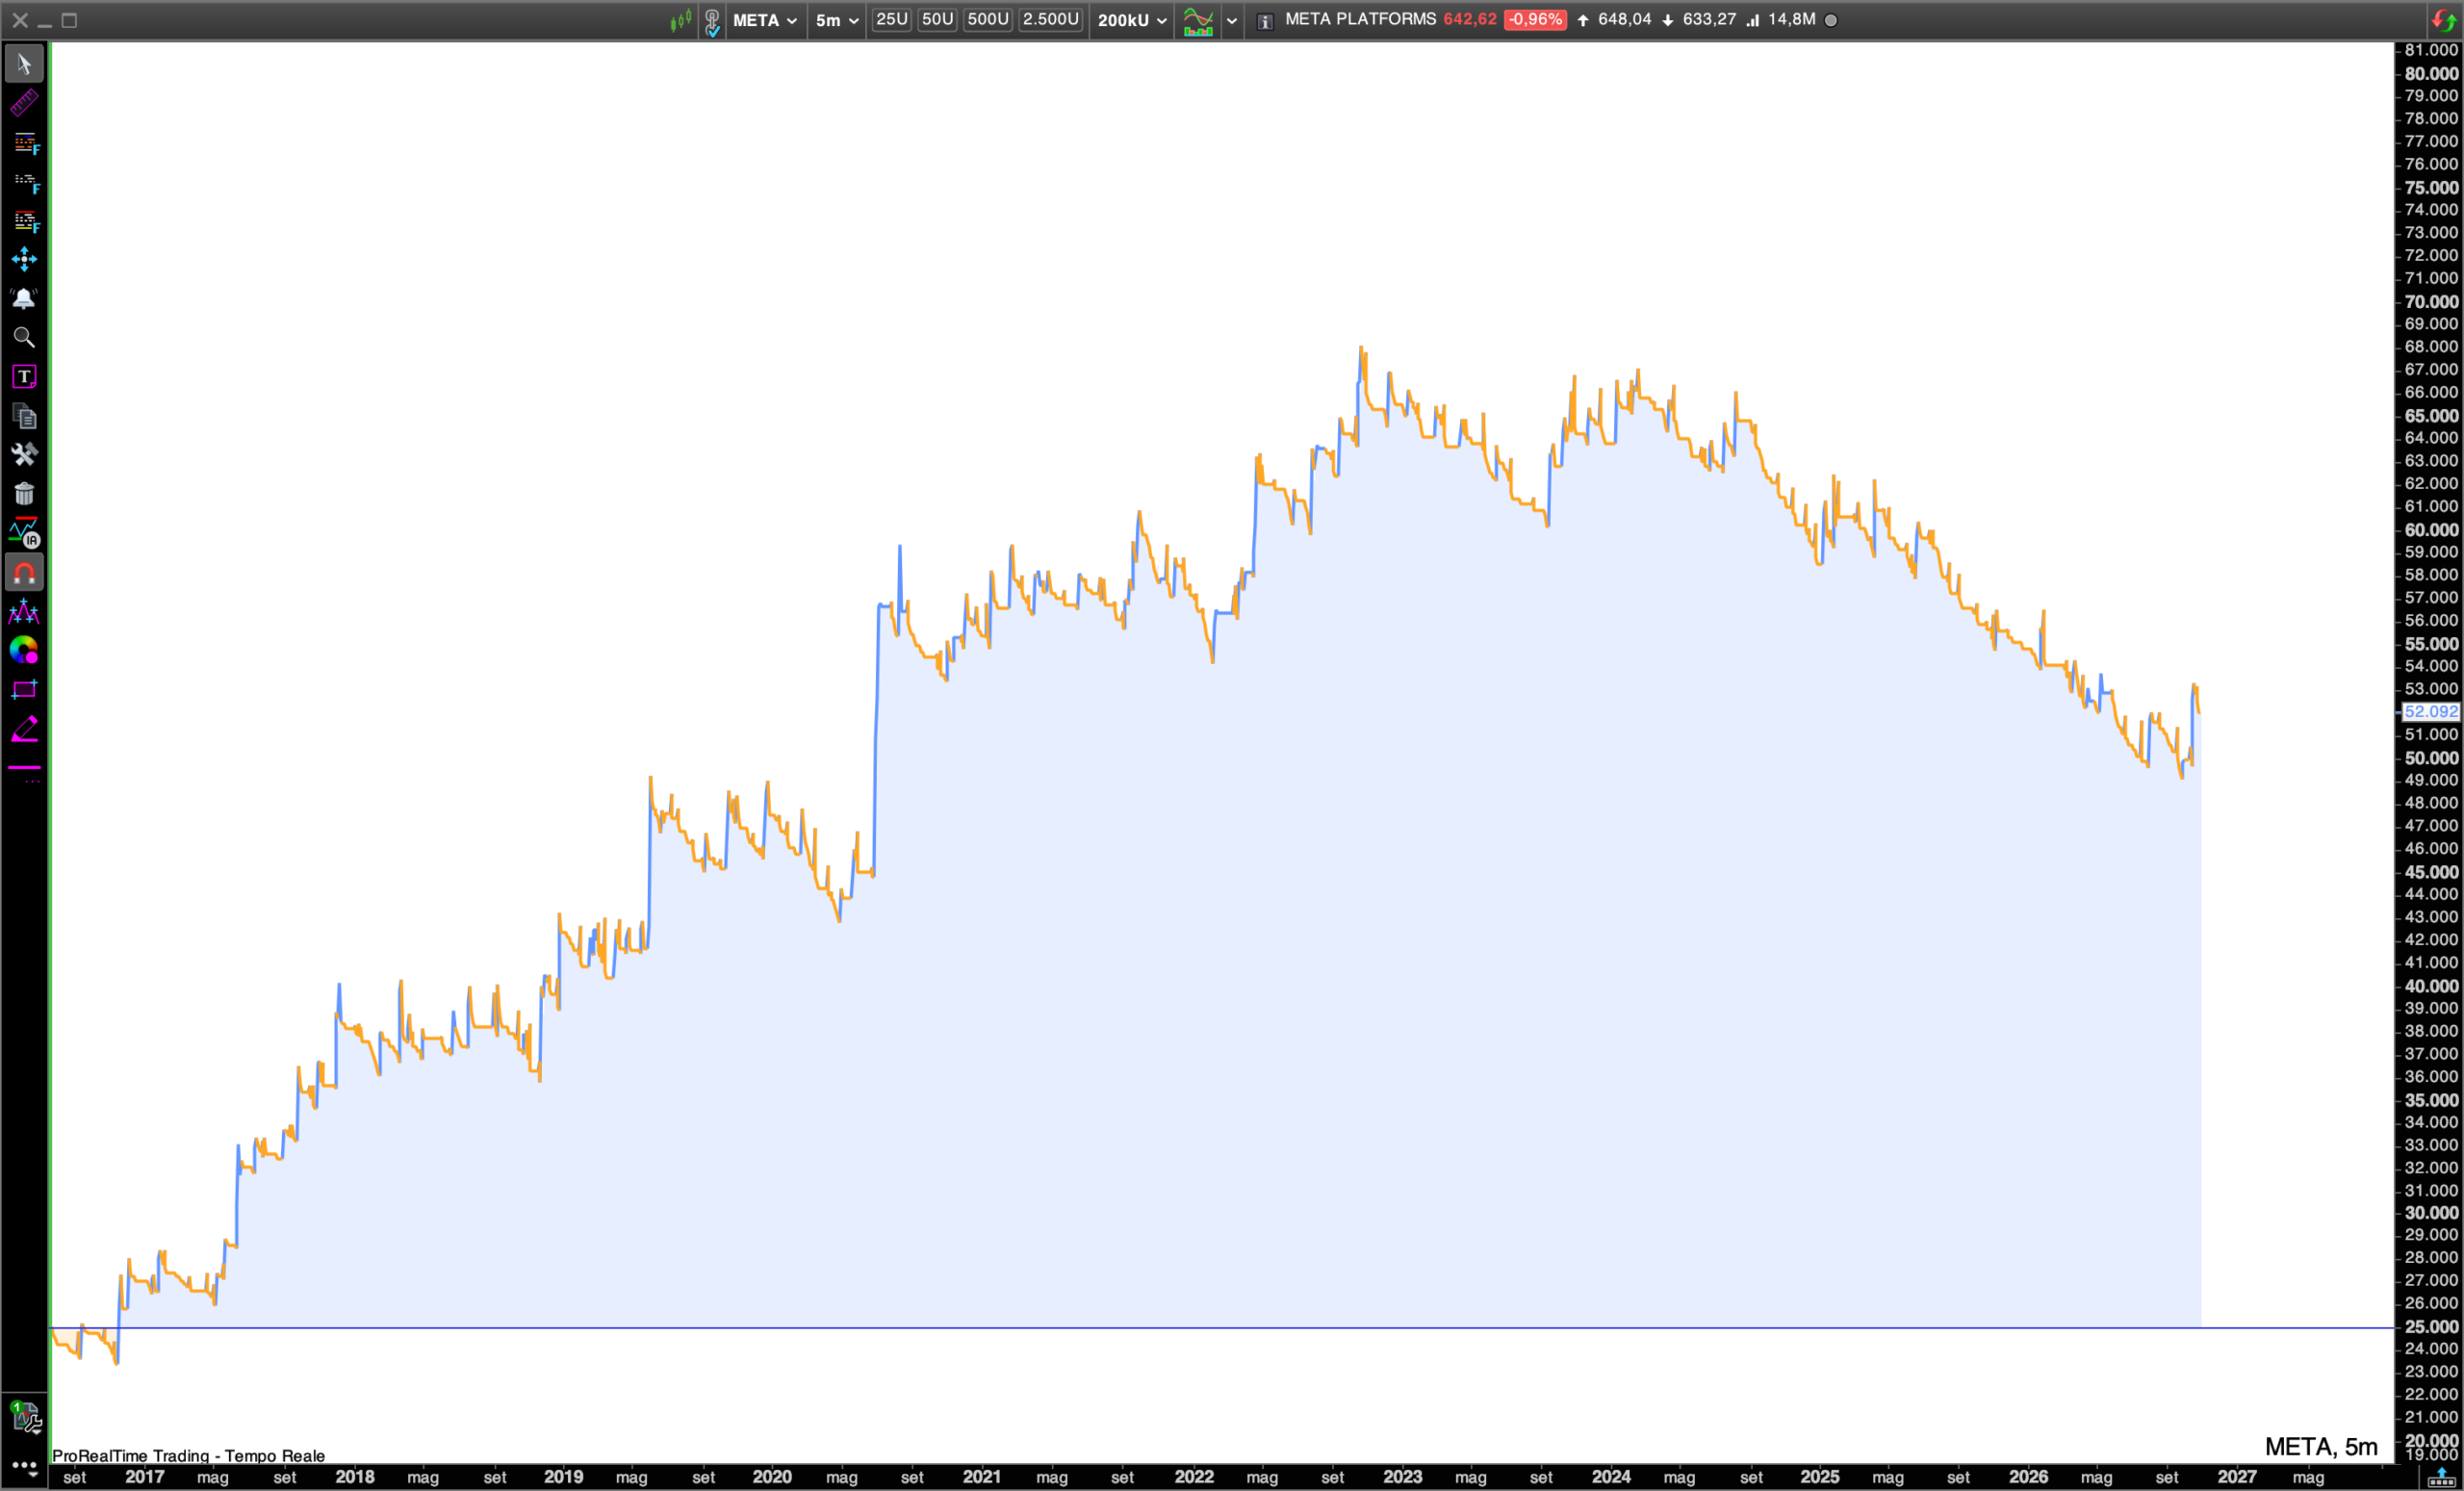
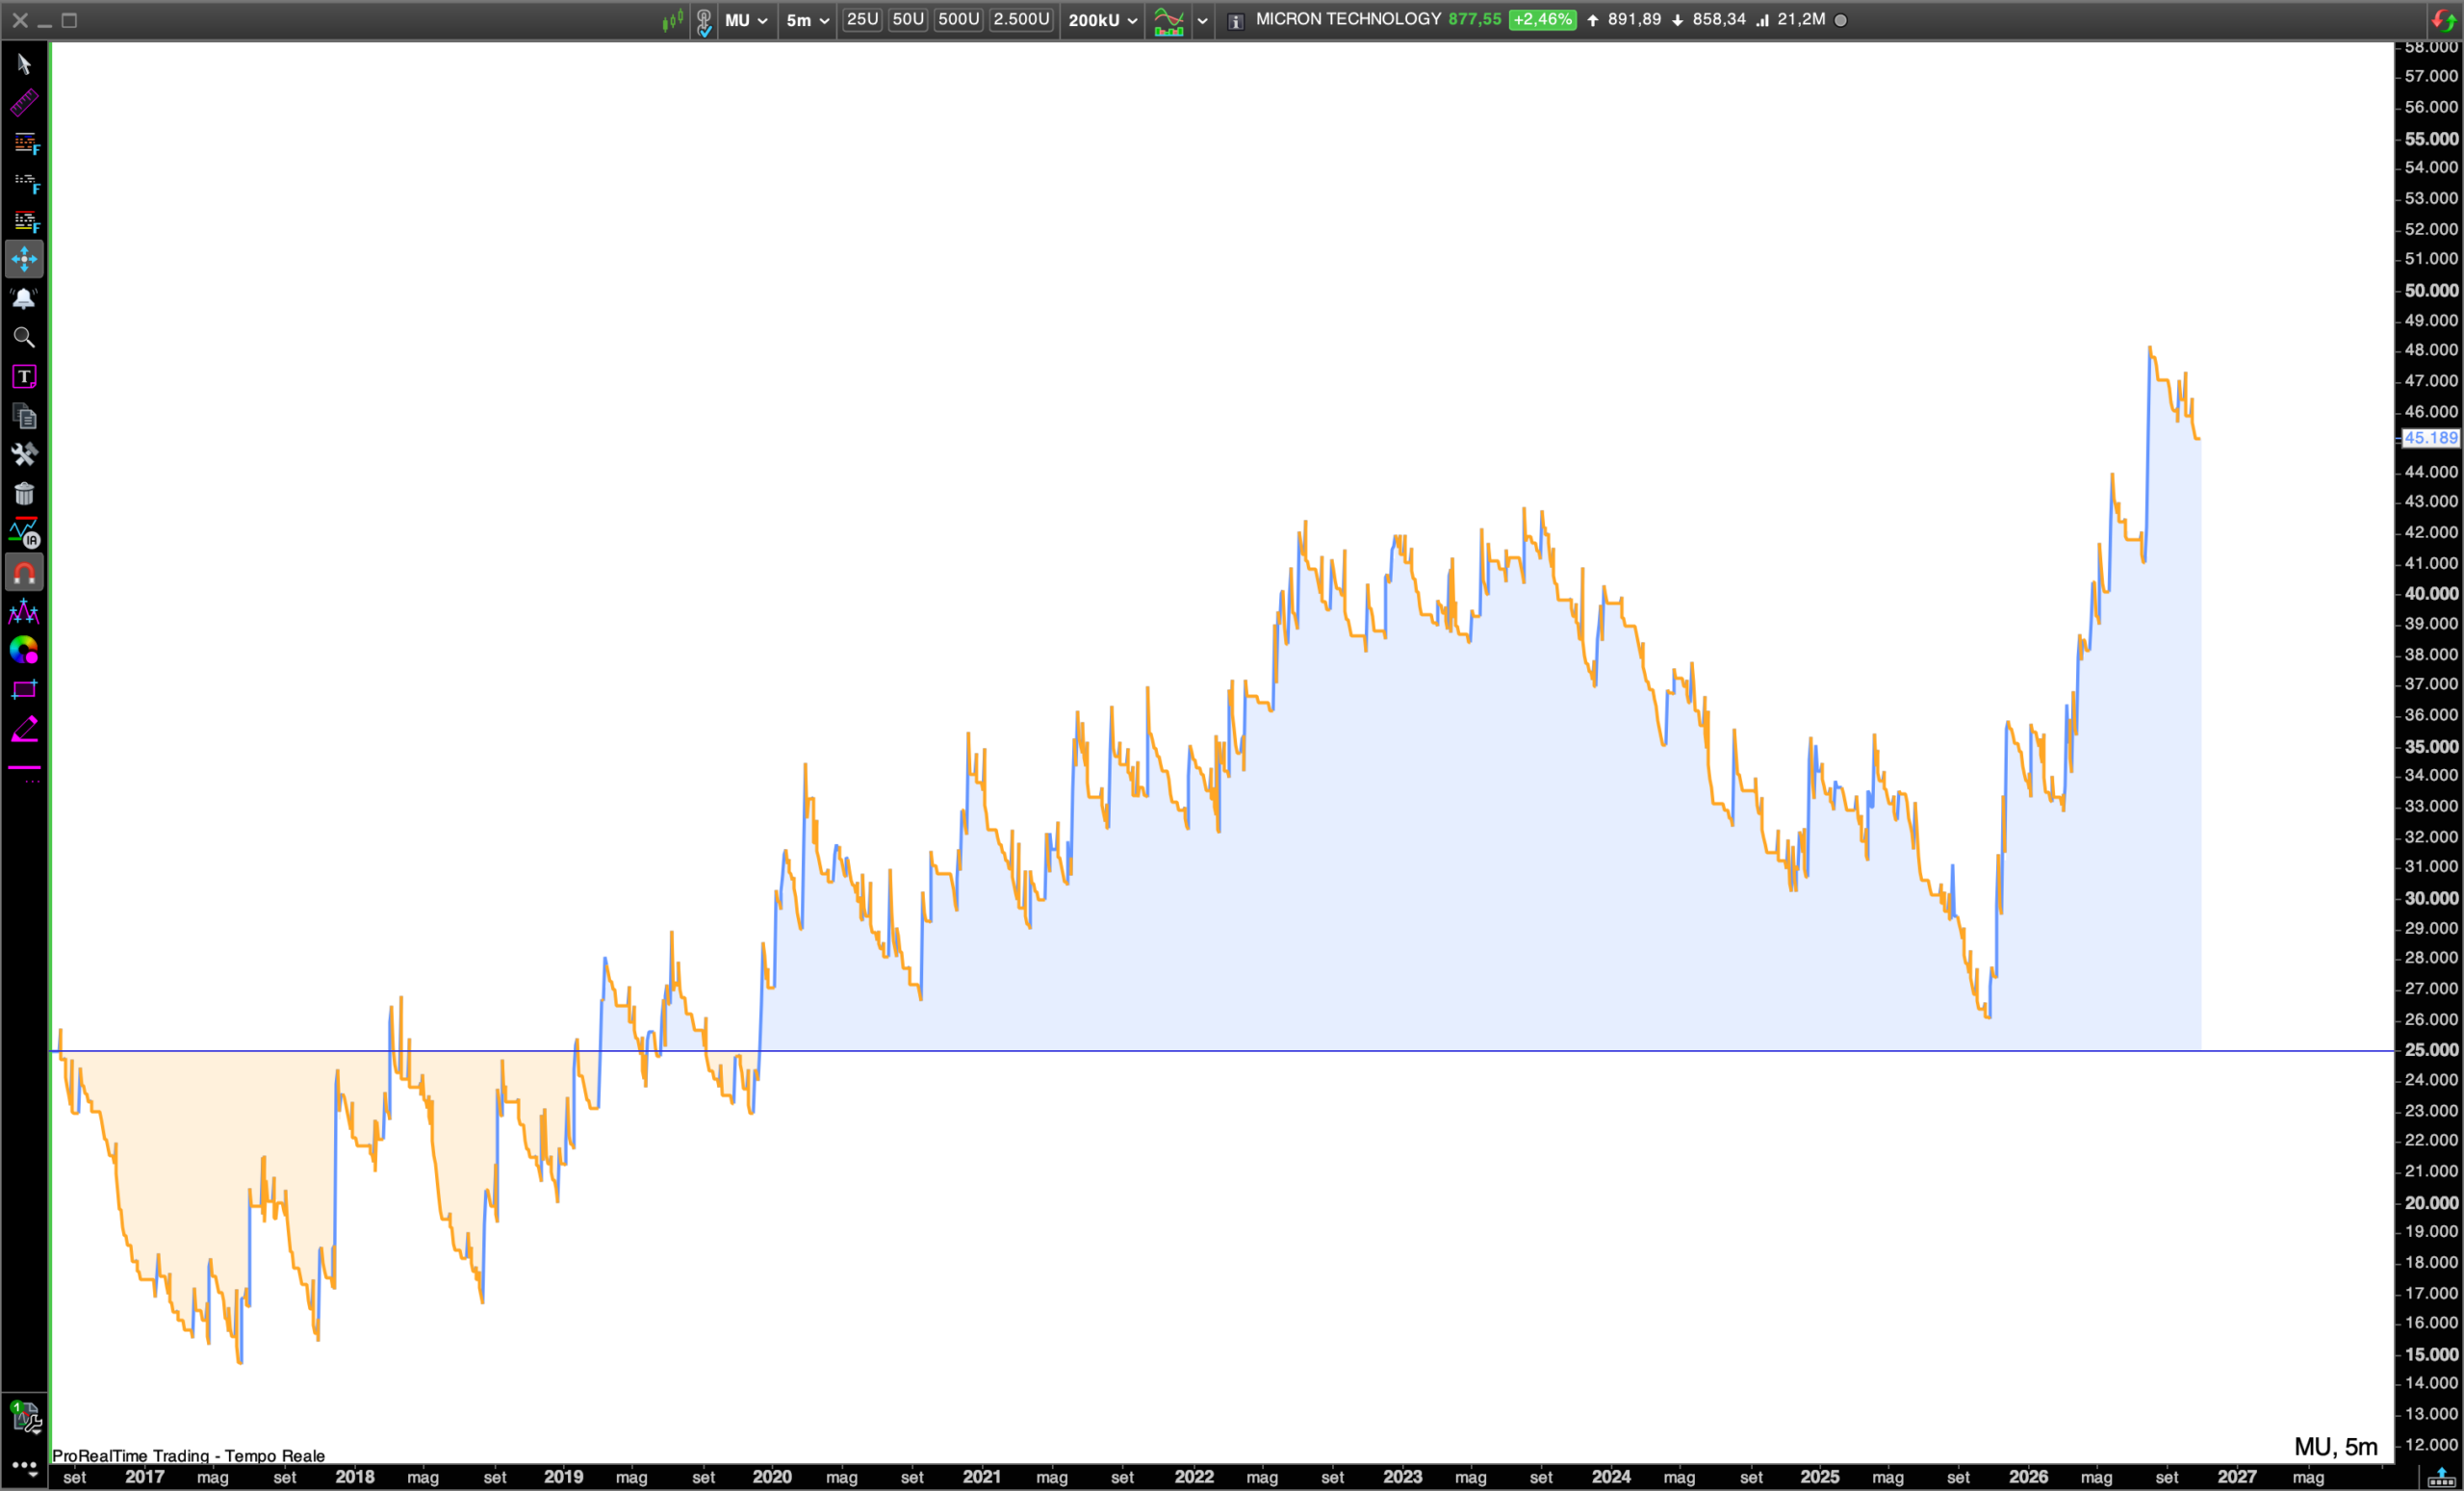
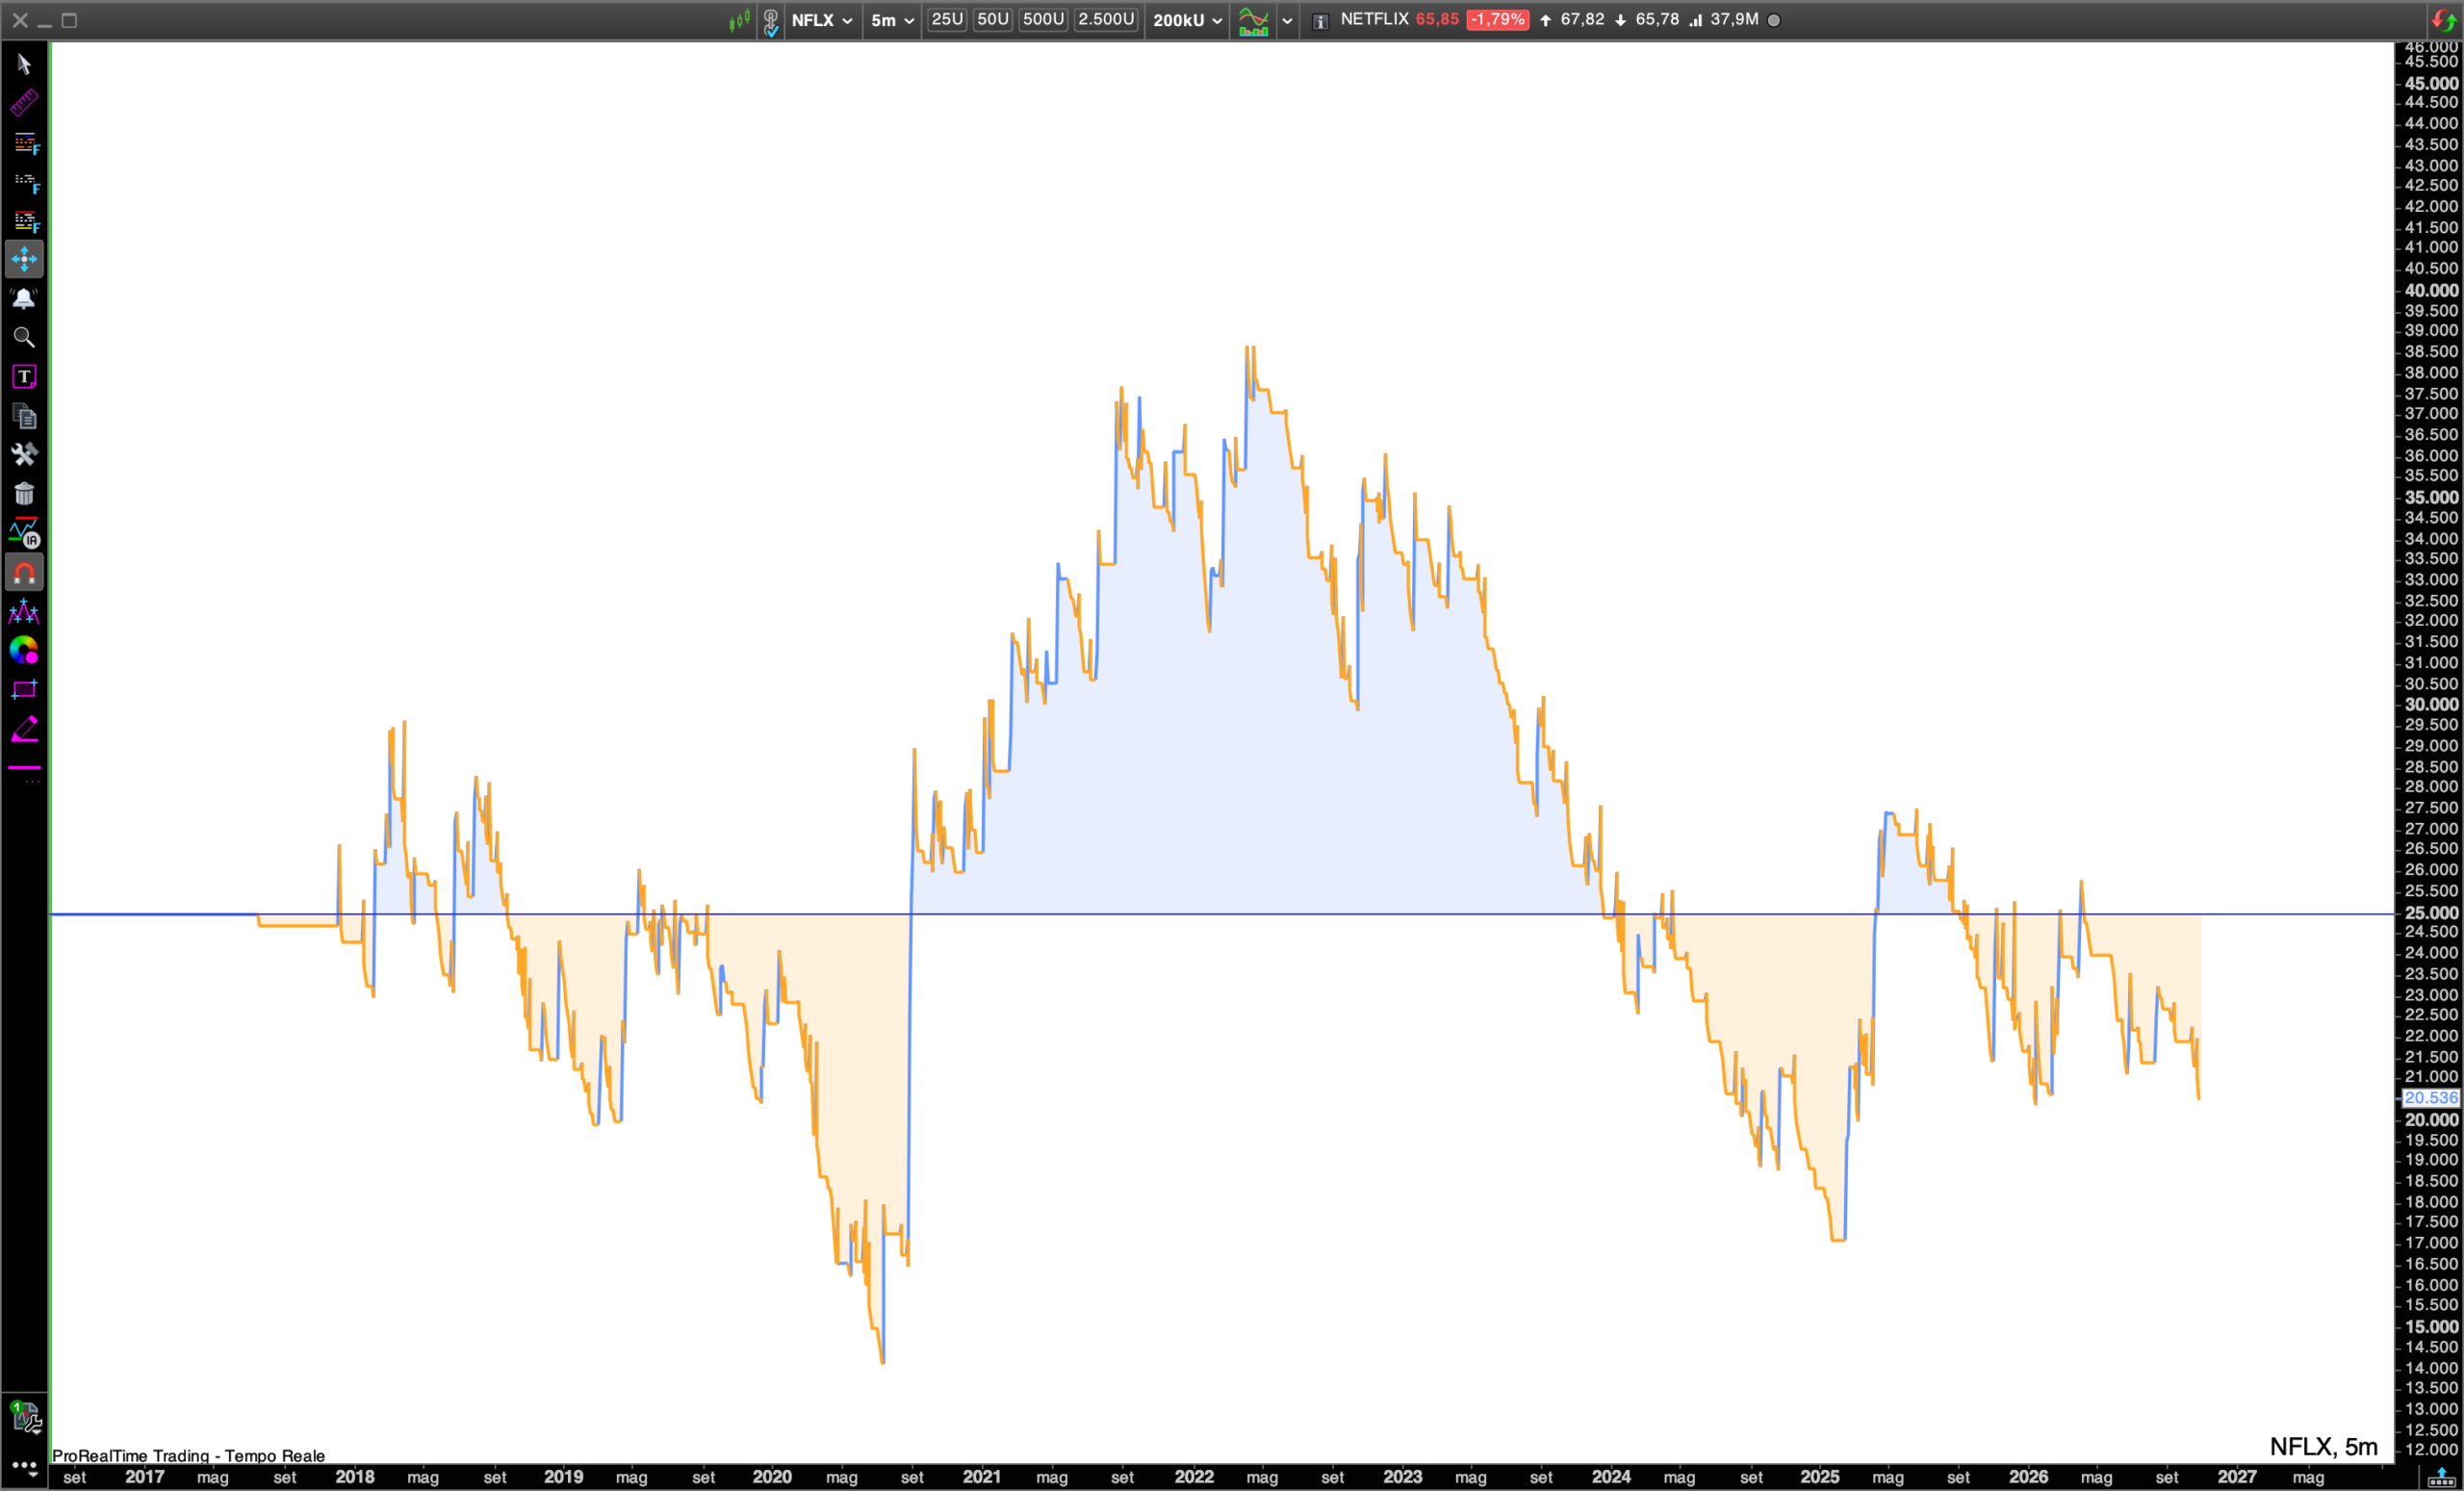
Important – All results below include broker commissions and an estimated slippage. Backtesting instructions are at the end of the page. This is not a “run it on any stock” robot. It is designed for volatile, heavily traded US stocks: see “Recommended stocks” and “Where it does NOT work”
What is ORB Stocks in Play?
ORB Stocks in Play automates one of the best-documented day trading strategies: the 5-minute Opening Range Breakout applied only to “Stocks in Play”.
The rules come from the research paper “A Profitable Day Trading Strategy For The U.S. Equity Market” (Zarattini, Barbon, Aziz – Swiss Finance Institute, 2024), which tested the Opening Range Breakout on more than 7,000 US stocks from 2016 to 2023. The study found that the breakout becomes profitable when the stock trades unusually high volume in the first minutes of the session. This system brings those rules to ProOrder, ready to run automatically on any US stock you choose.
What you get
- ORB Stocks in Play trading system for ProBacktest and ProOrder, with every setting editable from the variables window.
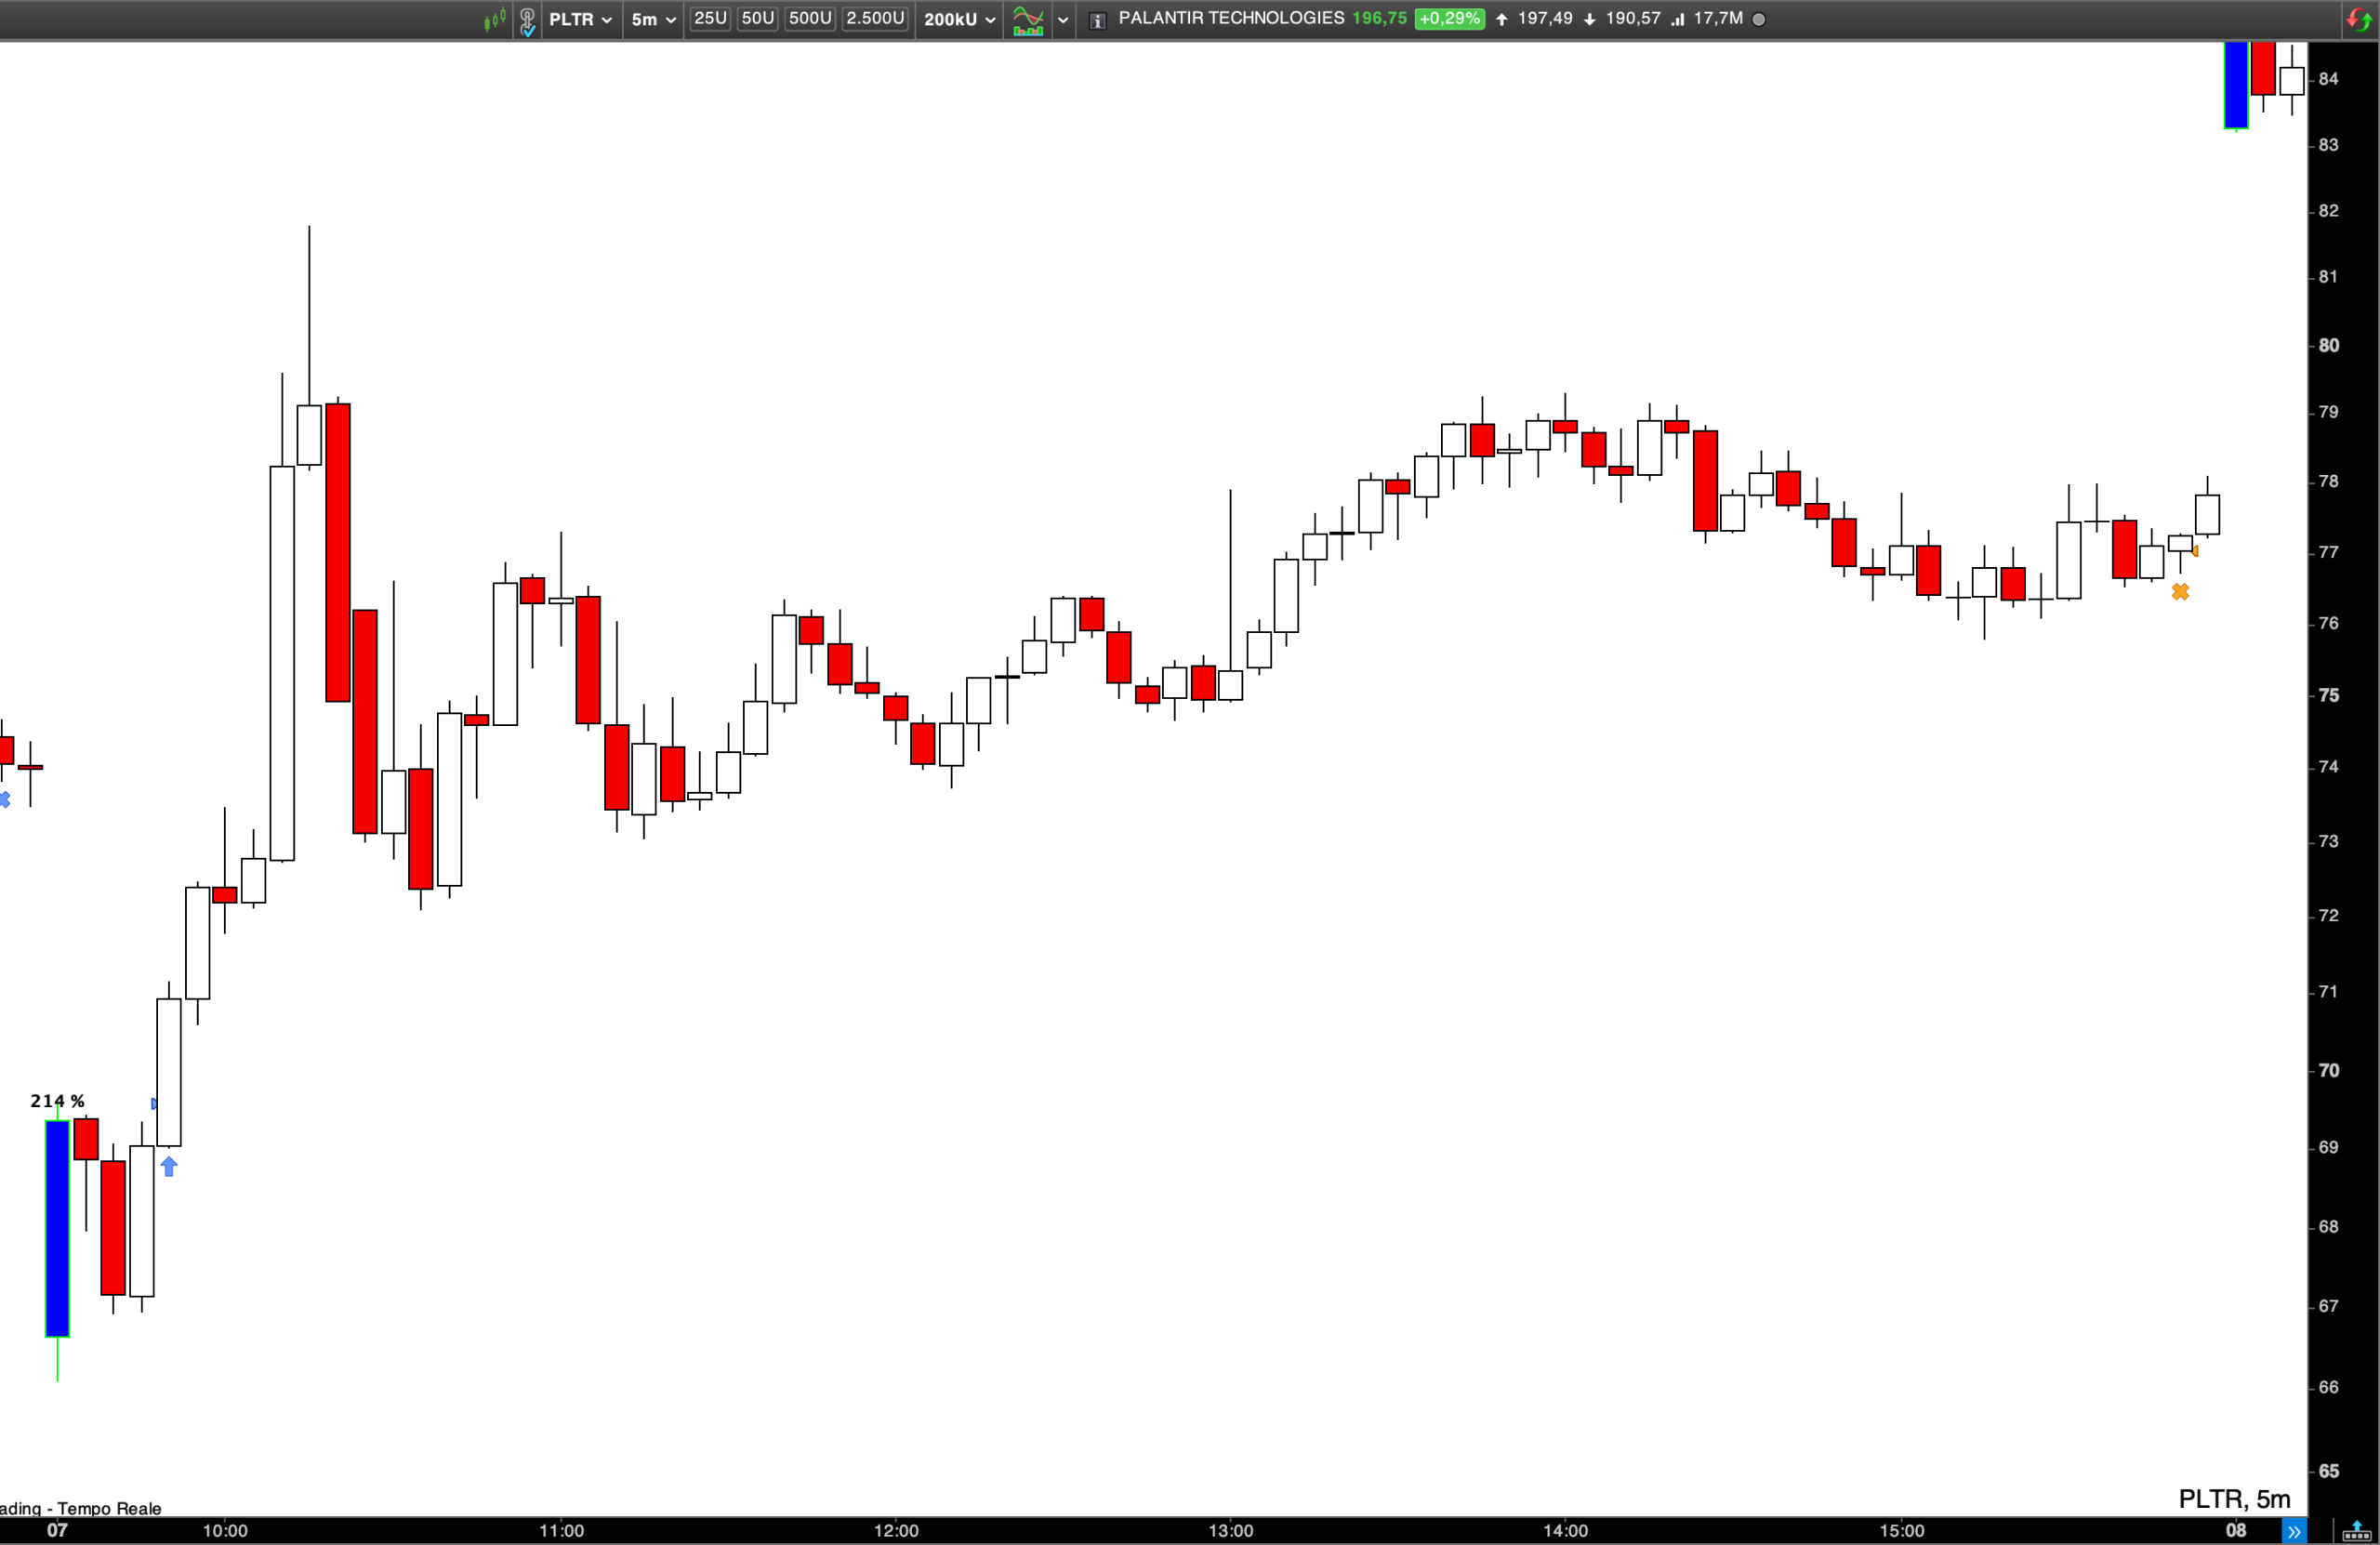
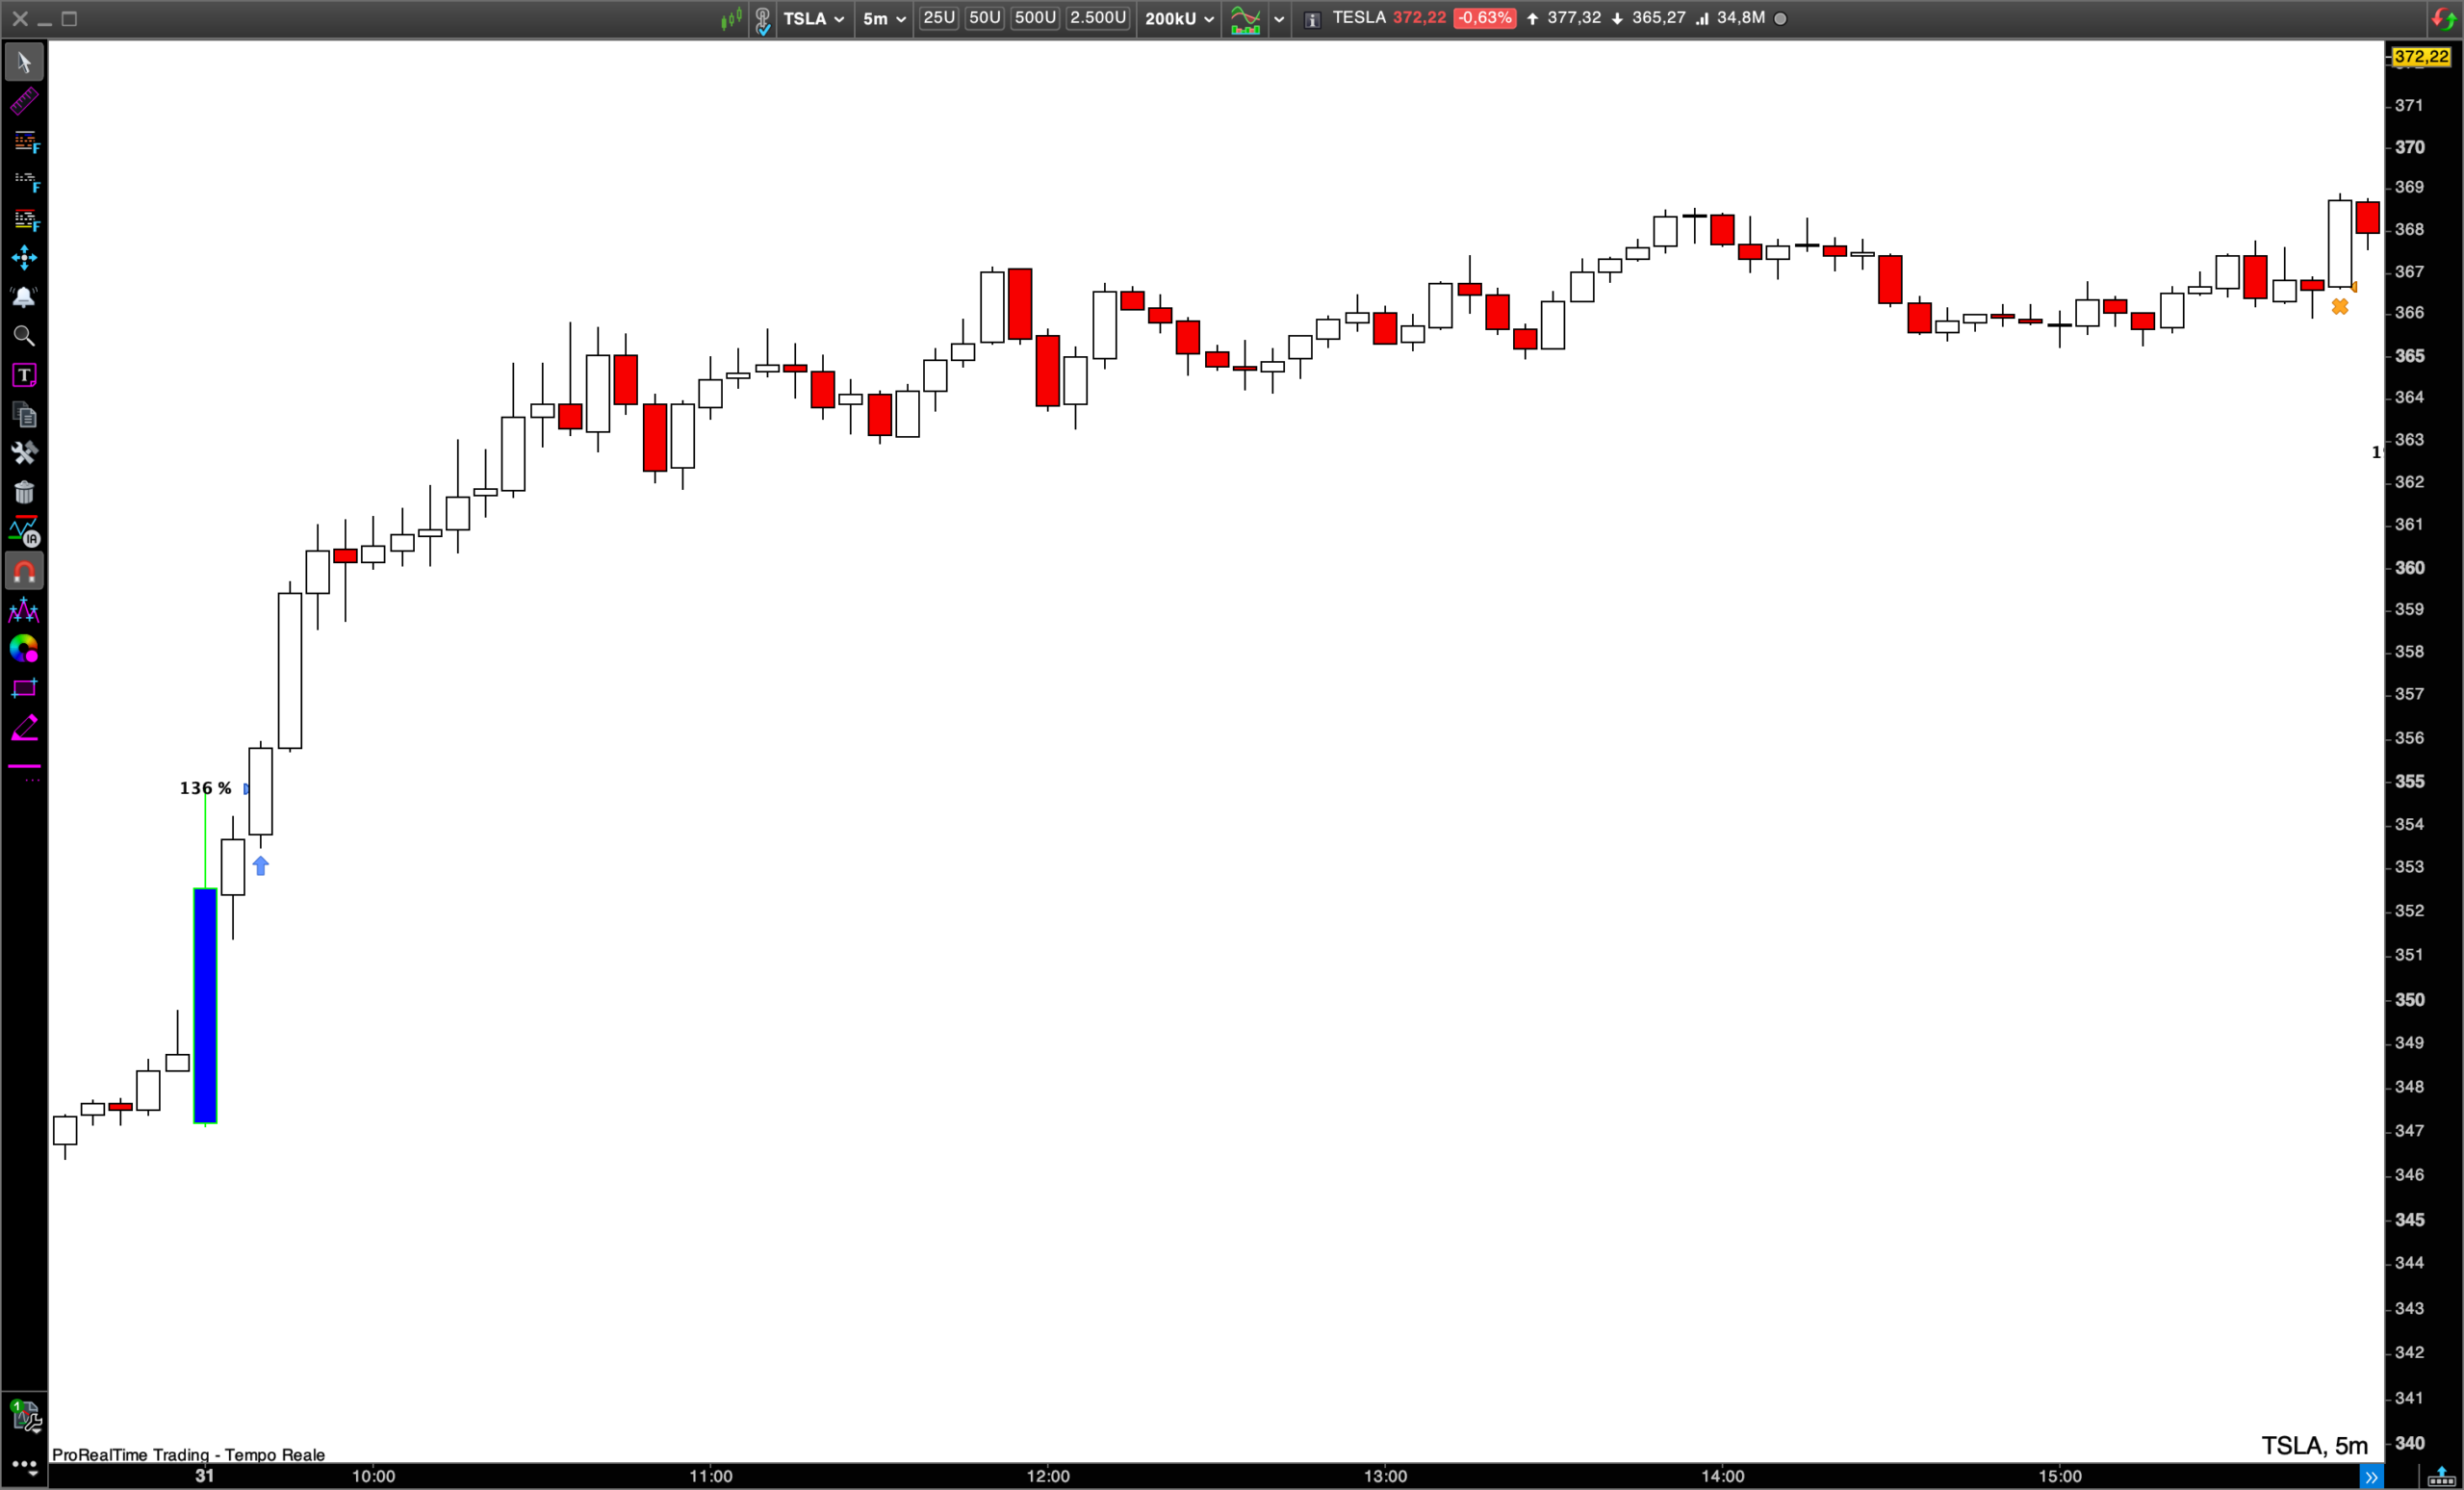
- ORB Relative Volume Indicator, included at no extra cost as a companion indicator. It uses the same Relative Volume calculation as the system: on every session it highlights the first candle of the day, colors it when the stock is in play (Relative Volume at or above your threshold, bullish or bearish) and prints the Relative Volume value above it. On your chart you see at a glance which days the system could trade, in which direction, and why it stayed out on the others. It works on any intraday timeframe, so you can also use it on its own for discretionary ORB trading.
Strategy rules
- Opening range: the first 5-minute candle of the session.
- Stocks in Play filter: the volume of the first candle is compared with the average first-candle volume of the previous 14 sessions (today excluded). The system trades only if this Relative Volume is at least 100%.
- Direction: bullish first candle → long only, with a buy stop at the high of the opening range. Bearish first candle → short only, with a sell stop at the low. Doji → no trade.
- Stop loss: 10% of the 14-day ATR from the entry price, always placed.
- Exit: at the end of the session. An optional profit target in R multiples is available (off by default, as in the research).
- Position size: 1% of capital at risk per trade, with a 4x leverage cap.
- One trade per day per stock.
- Base filters: minimum price, average daily volume and ATR, as in the research (each can be switched off).
How it makes money
This is a low hit-rate, high-payoff strategy. Only about 17% of trades are winners, but winners are held until the close and are worth on average 5 to 7 times the risk, while losers are cut at 1R. Losing streaks of 20 to 30 trades
are normal and part of the strategy: if you are not comfortable with them, this system is not for you.
Where it does not work
We tested the same rules on 20 US stocks, including quiet large caps, cyclicals and defensives. On low-volatility stocks such as Coca-Cola, Walmart and Walt Disney the strategy lost money: their opening ranges
rarely turn into strong intraday trends, and costs eat the edge. We show these results because they tell you how to use the system: keep it on stocks that move.
Recommended stocks
- Volatile, heavily traded US stocks with strong retail and institutional interest
- Average daily volume above 1 million shares and an ATR above 0.50$
- A basket of at least 8–10 stocks: results vary a lot from one stock to another (see NFLX and MU above), and diversification smooths the equity curve
How to start
Run one copy of the system for each stock, on a 5-minute chart.
How to change the settings: open the system on the chart, go to the ProBacktest settings and expand “Variable optimization”. Every setting below is listed there with its default value: change the value you need and keep the others as they are. No coding required.
|
Setting |
Default |
Description |
|
MARKETOPEN |
093000 |
Session open (HHMMSS, platform time zone; from Central Europe: 153000) |
|
TFMINUTES |
5 |
Chart timeframe in minutes (= opening range length) |
|
EXITTIME |
155000 |
Bar close time of the end-of-day exit: the position is closed at 15:50 New York time (from Central Europe: 215000) |
|
AVG |
14 |
Sessions used for the Relative Volume average |
|
INPLAY |
1 |
Relative Volume threshold (1 = 100%) |
|
CAPITAL |
25000 |
Capital assigned to this stock |
|
COMPOUND |
0 |
1 = adds realized profits to capital |
|
RISKPCT |
1 |
Risk per trade, % of capital |
|
MAXLEV |
4 |
Maximum leverage |
|
STOPATR |
0.10 |
Stop as a fraction of the 14-day ATR |
|
TARGETR |
0 |
Profit target in R (0 = exit at the close) |
|
POINTVAL |
1 |
Value of one point per share/contract |
|
MINPRICE / MINADV / MINATR |
5 / 1000000 / 0,5 |
Base filters (-1 = off) |
Capital per stock: set CAPITAL to your account size divided by the number of stocks. Each copy works independently: this way, even if all stocks trigger on the same day, your total exposure stays under control.
Risk management
- A stop loss is placed on every trade, from the first second of the position
- Flat every night: no overnight or weekend risk
- One trade per day per stock
- A safety exit closes any position that is still open at the next session (for example on half trading days)
No curve fitting
The rules come from published research, not from optimization. The same parameters are used on every stock, and we show the stocks where the system loses money as well. Past results do not guarantee future results.
Requirements
- ProRealTime v11 or later with ProOrder
- US stocks with exchange volume data (for example ProRealTime with Interactive Brokers). On CFD accounts, check that the share CFD shows exchange volume.
- Real-time data
- 5-minute chart
Backtesting
Open a 5-minute chart of the stock and load at least 200,000 bars Enable tick-by-tick mode and set your broker commissions Note: ProRealTime uses split-adjusted prices. Before a split, share counts and commissions in the report are overstated. If a stock traded below 5$ on an adjusted basis, set MINPRICE to -1 to include those years.
Disclaimer
This system does not guarantee profits.
Trading leveraged instruments can lead to losses greater than your deposits.
Backtest results are hypothetical and do not include all real-world trading costs. Use it only with capital you can afford to lose.

Bewertungen
Es gibt noch keine Bewertungen.