

 SCHNELLE &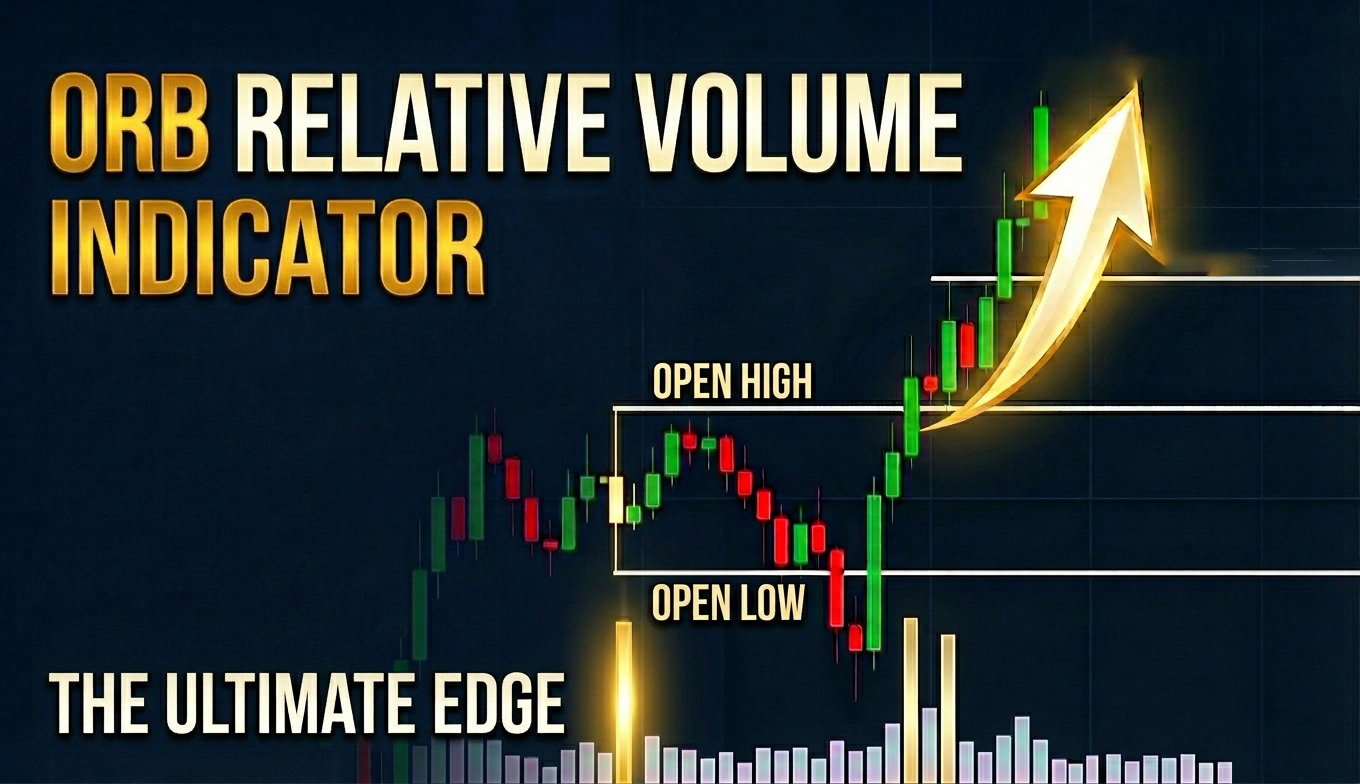

Overview
Disclaimer: this indicator does not generate buy or sell signals. It identifies opening-range volume anomalies (Stocks in Play), intended to support discretionary decision-making and risk management.
The ORB Relative Volume Indicator identifies Stocks in Play: stocks that show abnormal volume in the first minutes of trading relative to their own historical average — a condition the academic paper “A Profitable Day Trading Strategy For The U.S. Equity Market” (Zarattini, Barbon, Aziz — Swiss Finance Institute, 2024) links to more tradable intraday trends via the Opening Range Breakout (ORB) strategy.
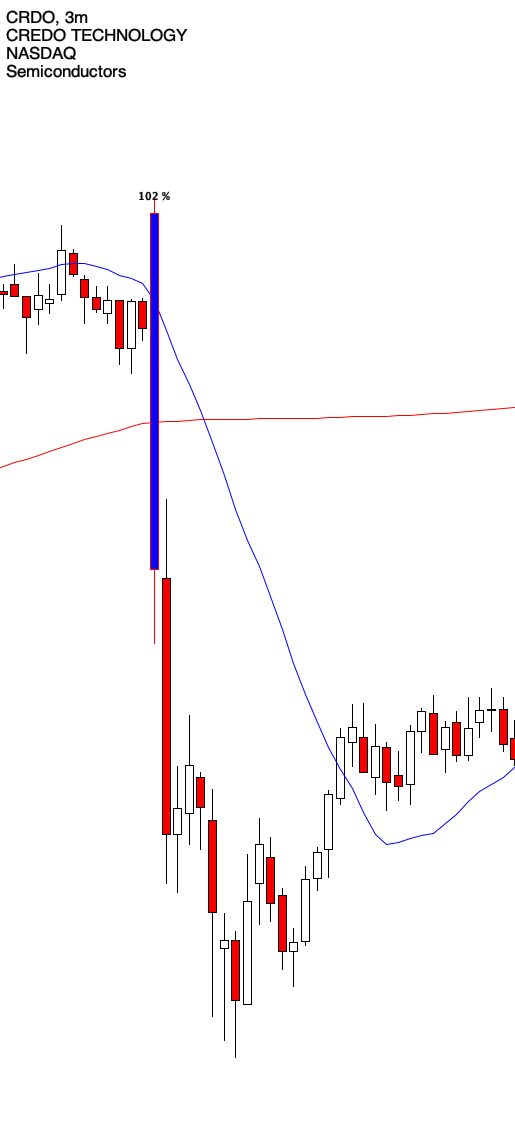
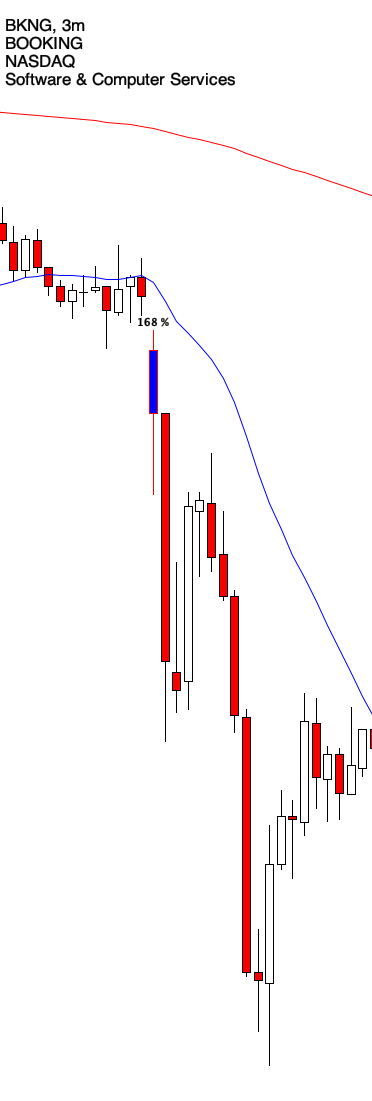
It plots the opening range directly on your chart and labels it with its Relative Volume reading, so you can spot a Stock in Play the moment the first candle closes.
What This Indicator Does
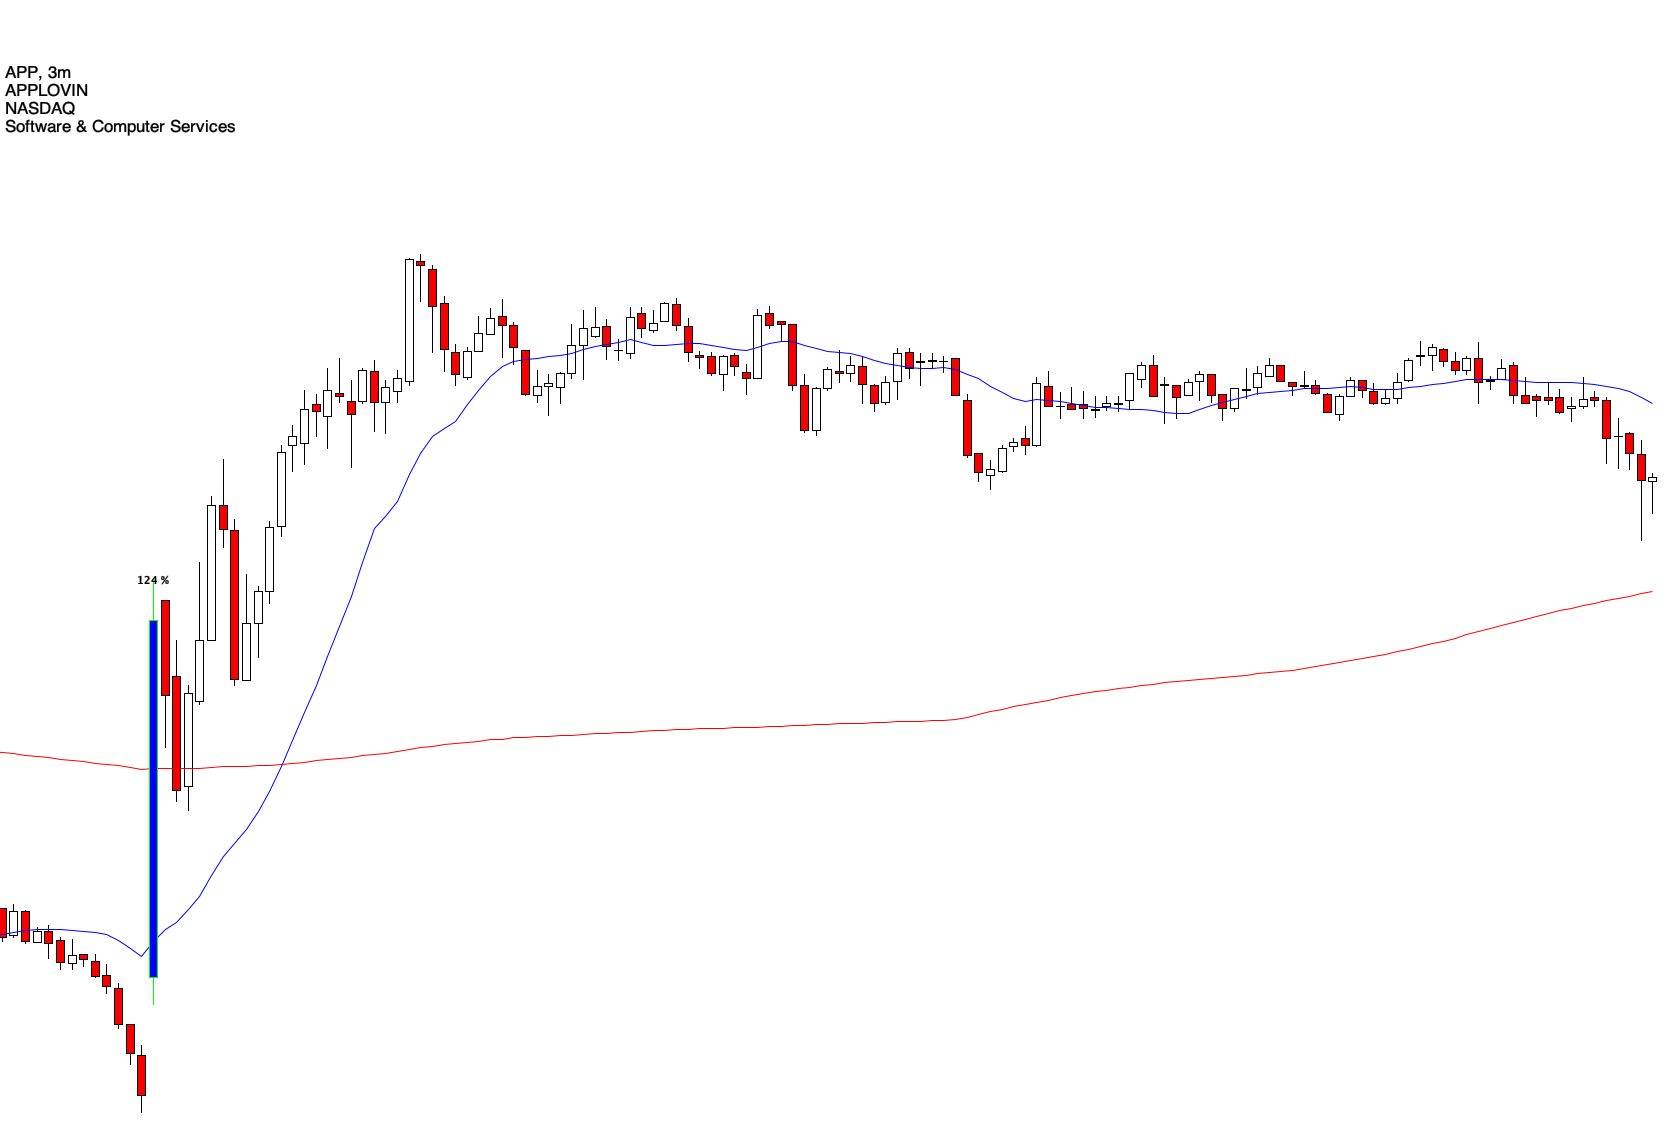
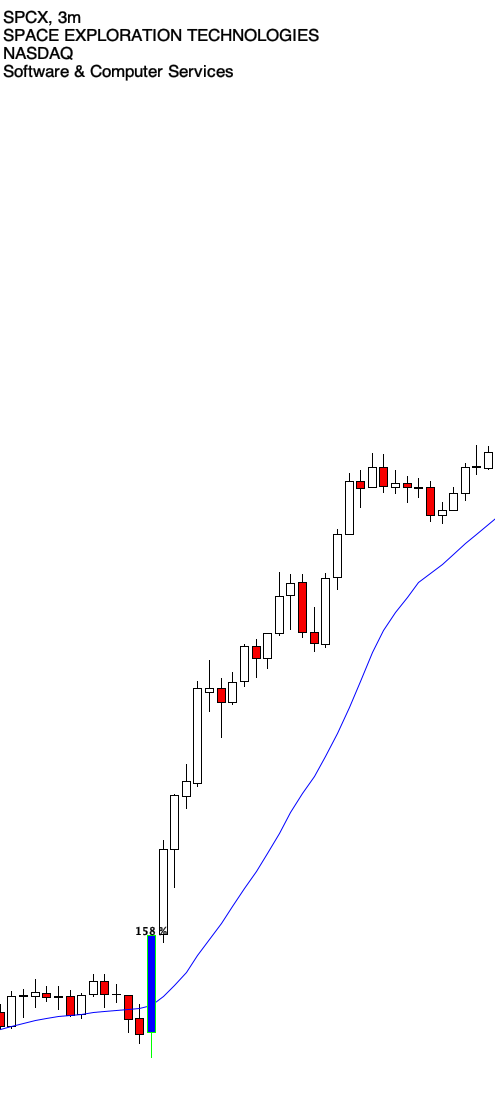
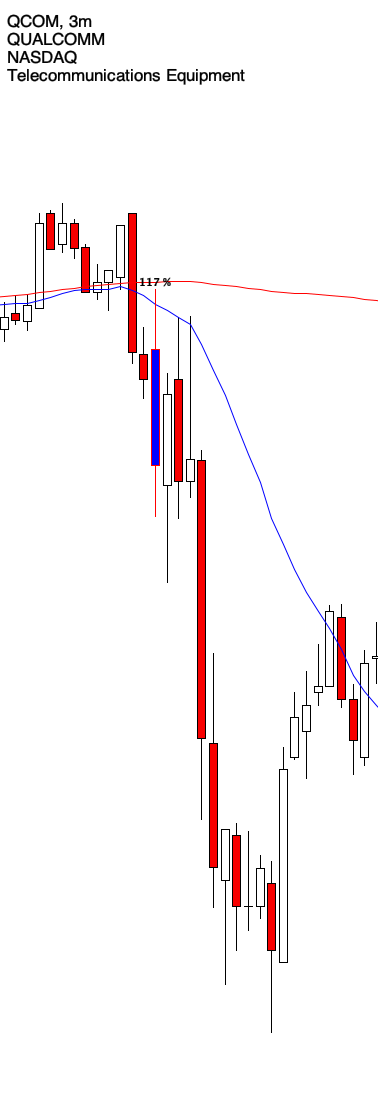
The indicator plots the opening range of the session and colors its candle when volume exceeds your chosen threshold relative to its historical average, with the Relative Volume (%) displayed directly on the chart.
It gives you an instant, objective read on whether today’s session is opening as a Stock in Play — without having to eyeball the volume bars yourself.
How It Works
Over the first TFMINUTES minutes from the open (MARKETOPEN), the indicator computes the opening range (high, low, open, close and volume) and compares it against the average of the previous AVG days, excluding today to avoid hindsight bias.
Relative Volume is the ratio between today’s opening-range volume and this historical average. Once it crosses the INPLAY threshold (1 = 100% of the average), the candle is colored to flag a Stock in Play: the reference paper shows that average PnL of an ORB strategy rises together with Relative Volume, from -0.02R below 100% up to +0.38R above 3000%.
Direction (long/short) is set by the color of the first candle: bullish → long only, triggered on a breakout of the opening-range high; bearish → short only, triggered on a breakout of the low — exactly as described in the paper’s strategy.
Configurable Parameters
| Parameter | Meaning | Example |
|---|---|---|
| MARKETOPEN | Market open time (HHMMSS) | 93000 |
| TFMINUTES | Opening range duration in minutes | 5 |
| AVG | Days used for the historical volume average | 14 |
| INPLAY | Relative Volume threshold (1 = 100%) | 1 |
Compatibility
Designed for intraday charts at a timeframe equal to or finer than TFMINUTES (1, 2, 3 or 5 minutes): it does not work on Daily timeframes or coarser, since the logic needs the real open/close time of each bar.

Bewertungen
Es gibt noch keine Bewertungen.