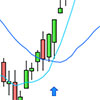
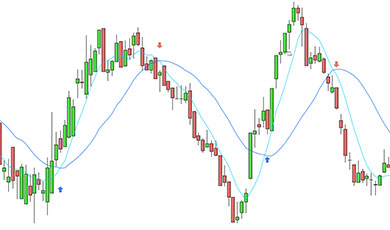
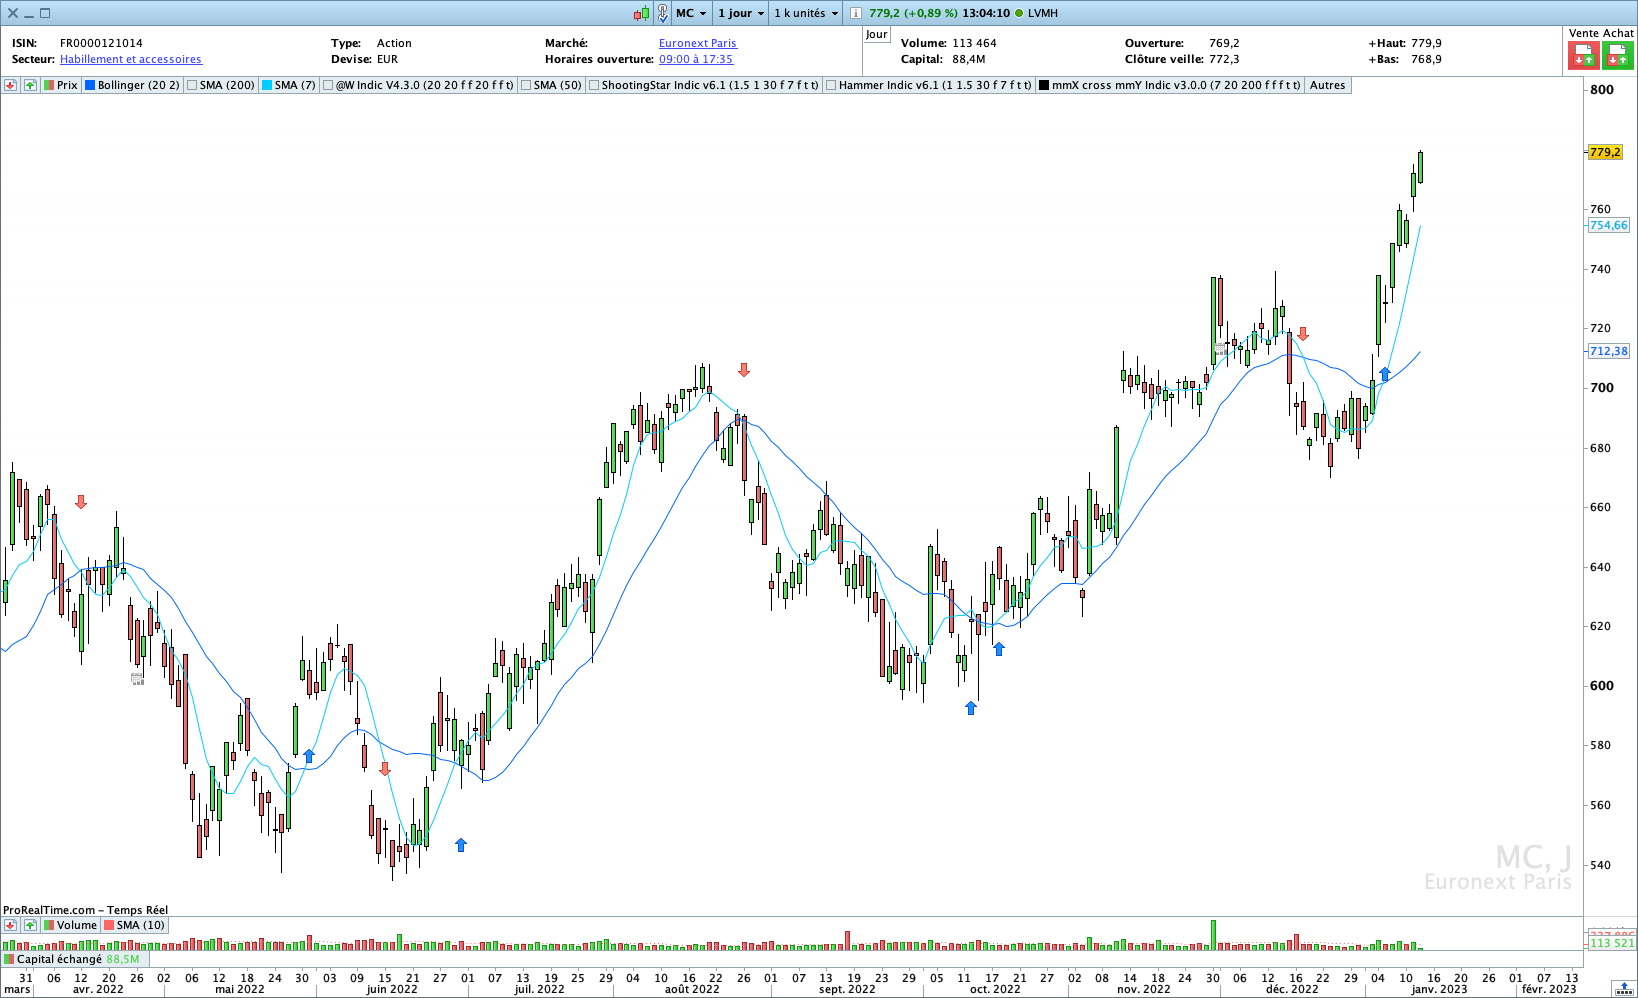
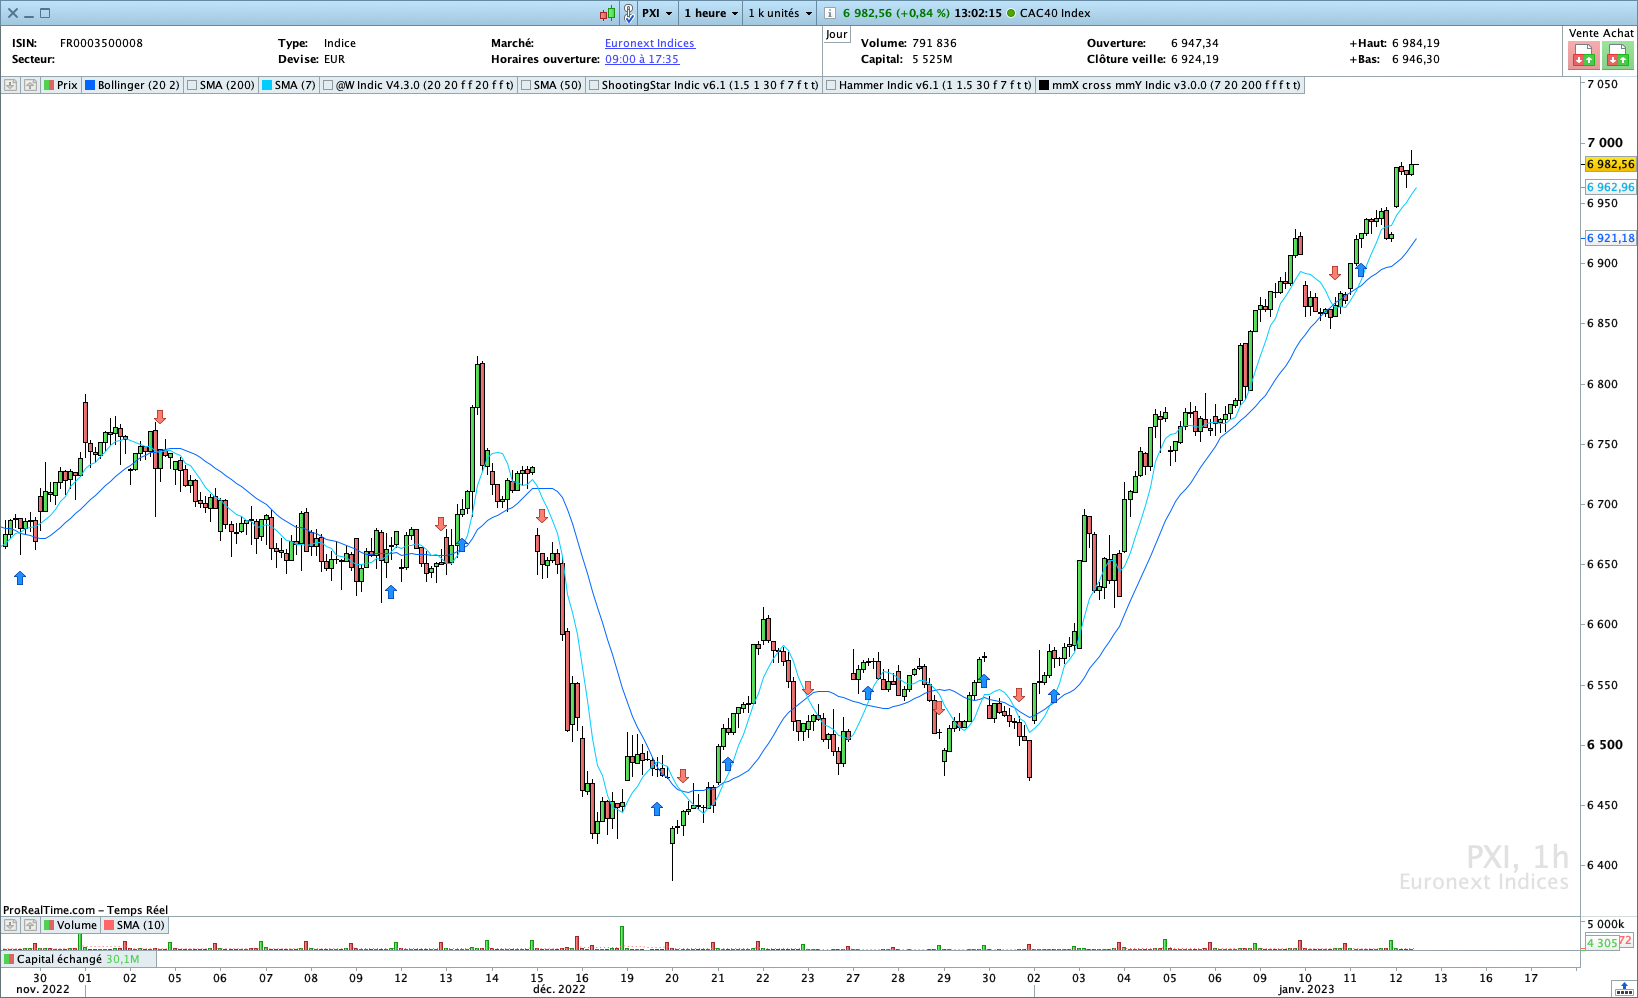

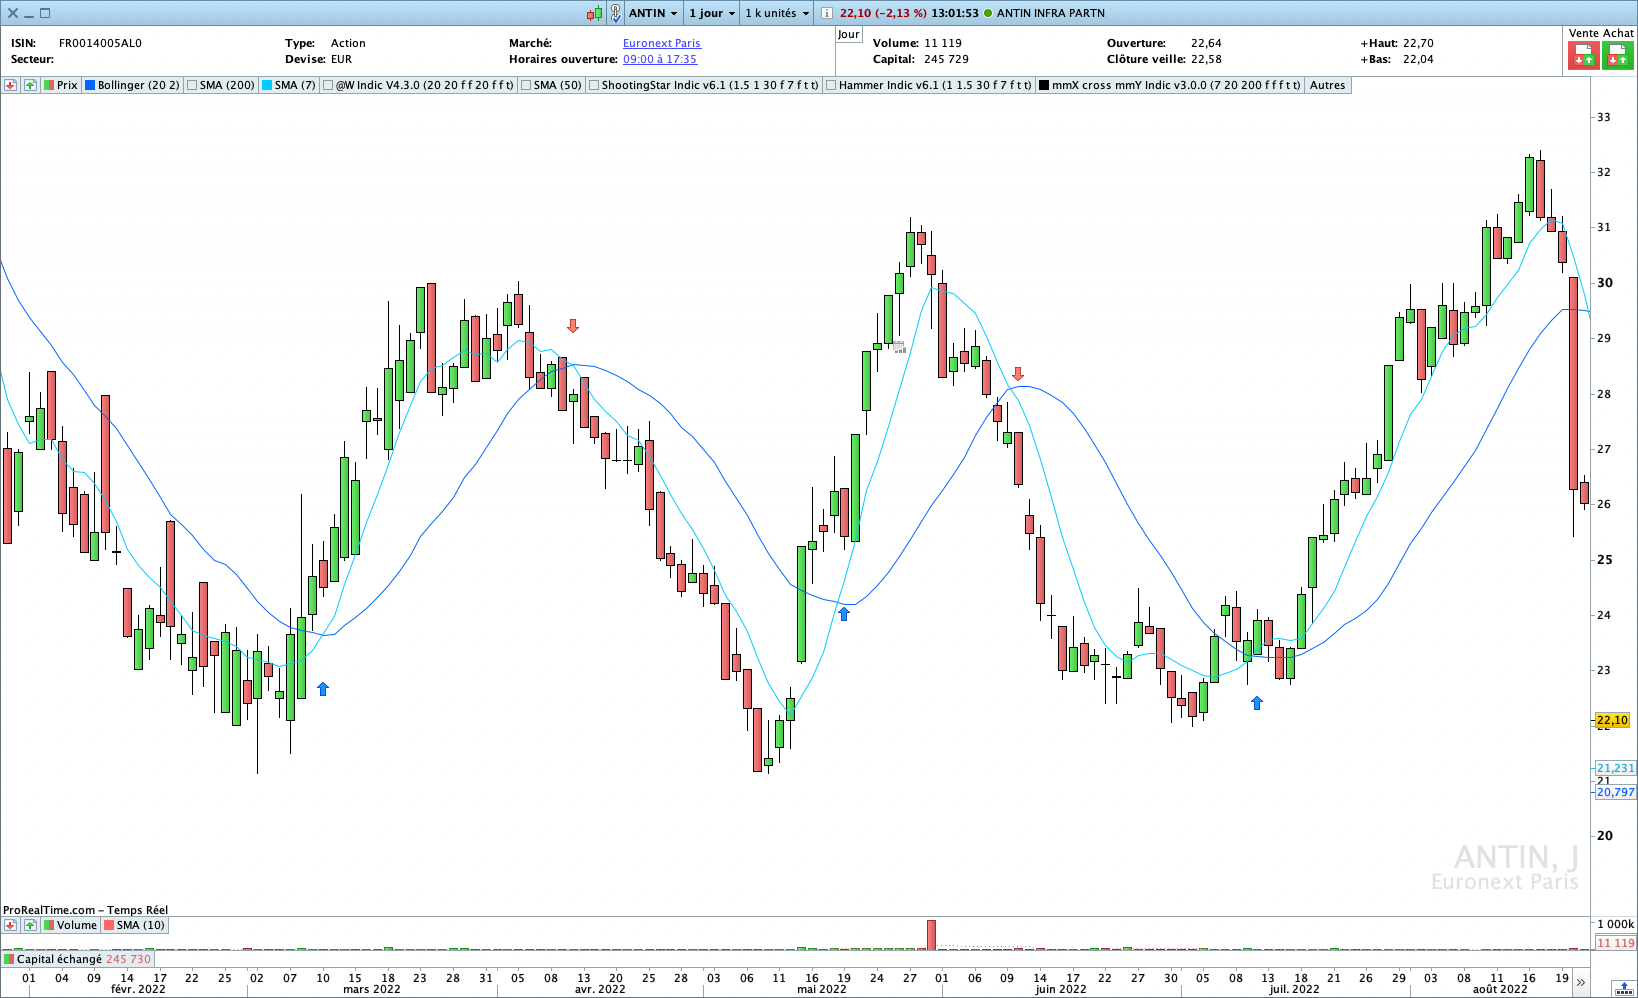
This indicator will allow you to visualize moving average crossings by :
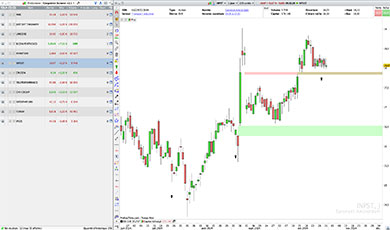
- drawing a blue arrow under a bullish moving average crossing,
- drawing a orange arrow above a bearish moving average crossing.
Can be used on all time frames, from the smallest to the largest.
Just click on “Configure” 🔧 to change many settings.
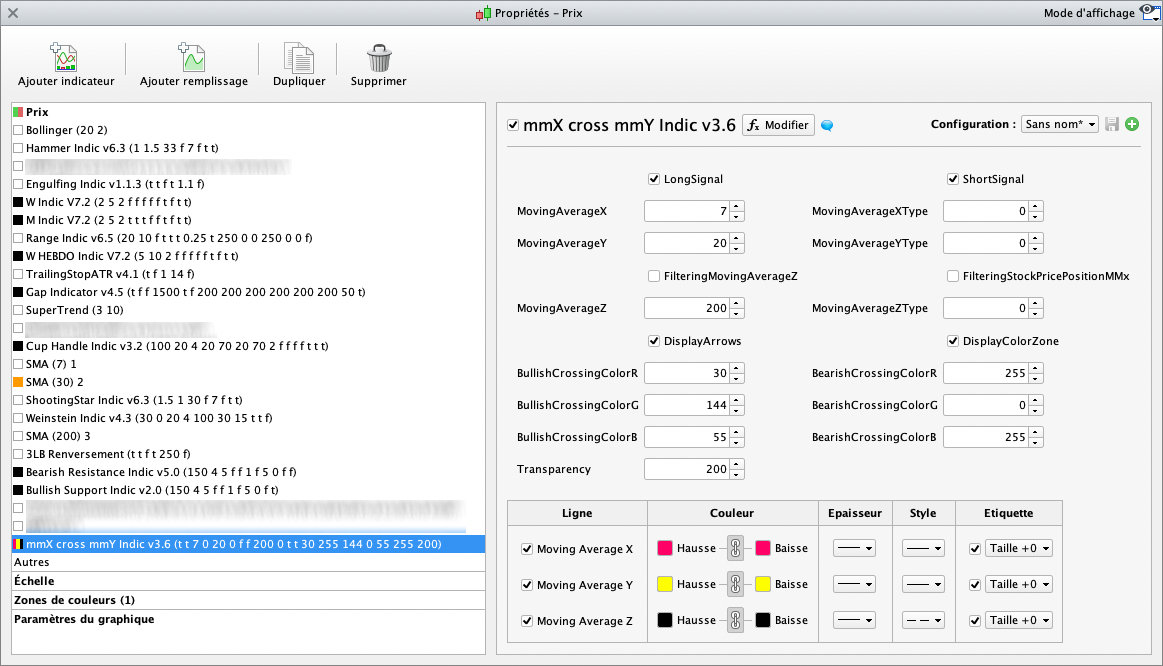
The values shown above are given, as examples and do not constitute an optimal or recommended setting, everyone should find his own settings.
Use our Moving Average Crossing screener to scan the market.
Adjustable validation criteria :
- Short moving average period,
- Long moving average period,
- Filtering moving average,
- Mobile average type (EMA, SMA, WMA, …) independantly for each one.
Available filters :
- Stock price must be above / below a choosen moving average,
- Stock price must be above / below the short moving average.
Display options :
- Display bullish crossings
- Display bearish crossings
- Display arrows or color zone
- Modify independantly bullish and bearish displays
Characteristics :
- Works on all TimeFrames
- ProRealTime V11 and later versions compatible
- Free ProRealTime (daily closings) compatible
- Automatic and free updates
Watch the video user’s guide on our Youtube channel, subtitles available in English :
🇫🇷 Croisement Moyenne Mobile / 🇮🇹 Crossover della media mobile / 🇩🇪 Crossover mit gleitendem Durchschnitt / 🇪🇸 Cruce de la media móvil
Reviews
There are no reviews yet.