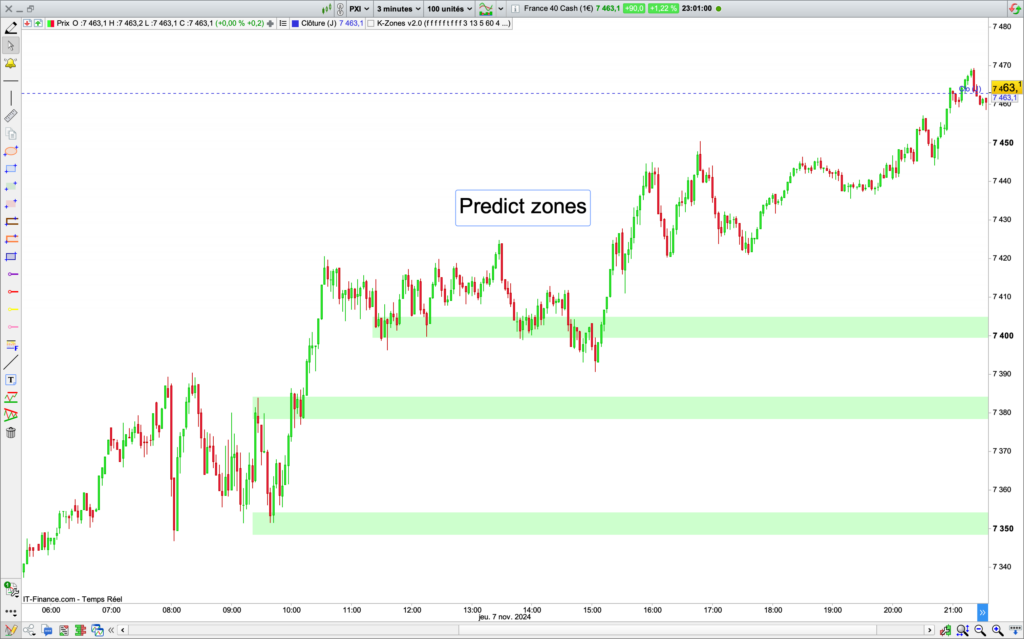
K-Zones combines multiple powerful technical analysis approaches to identify and visualize critical market zones:
✨ Key Features:
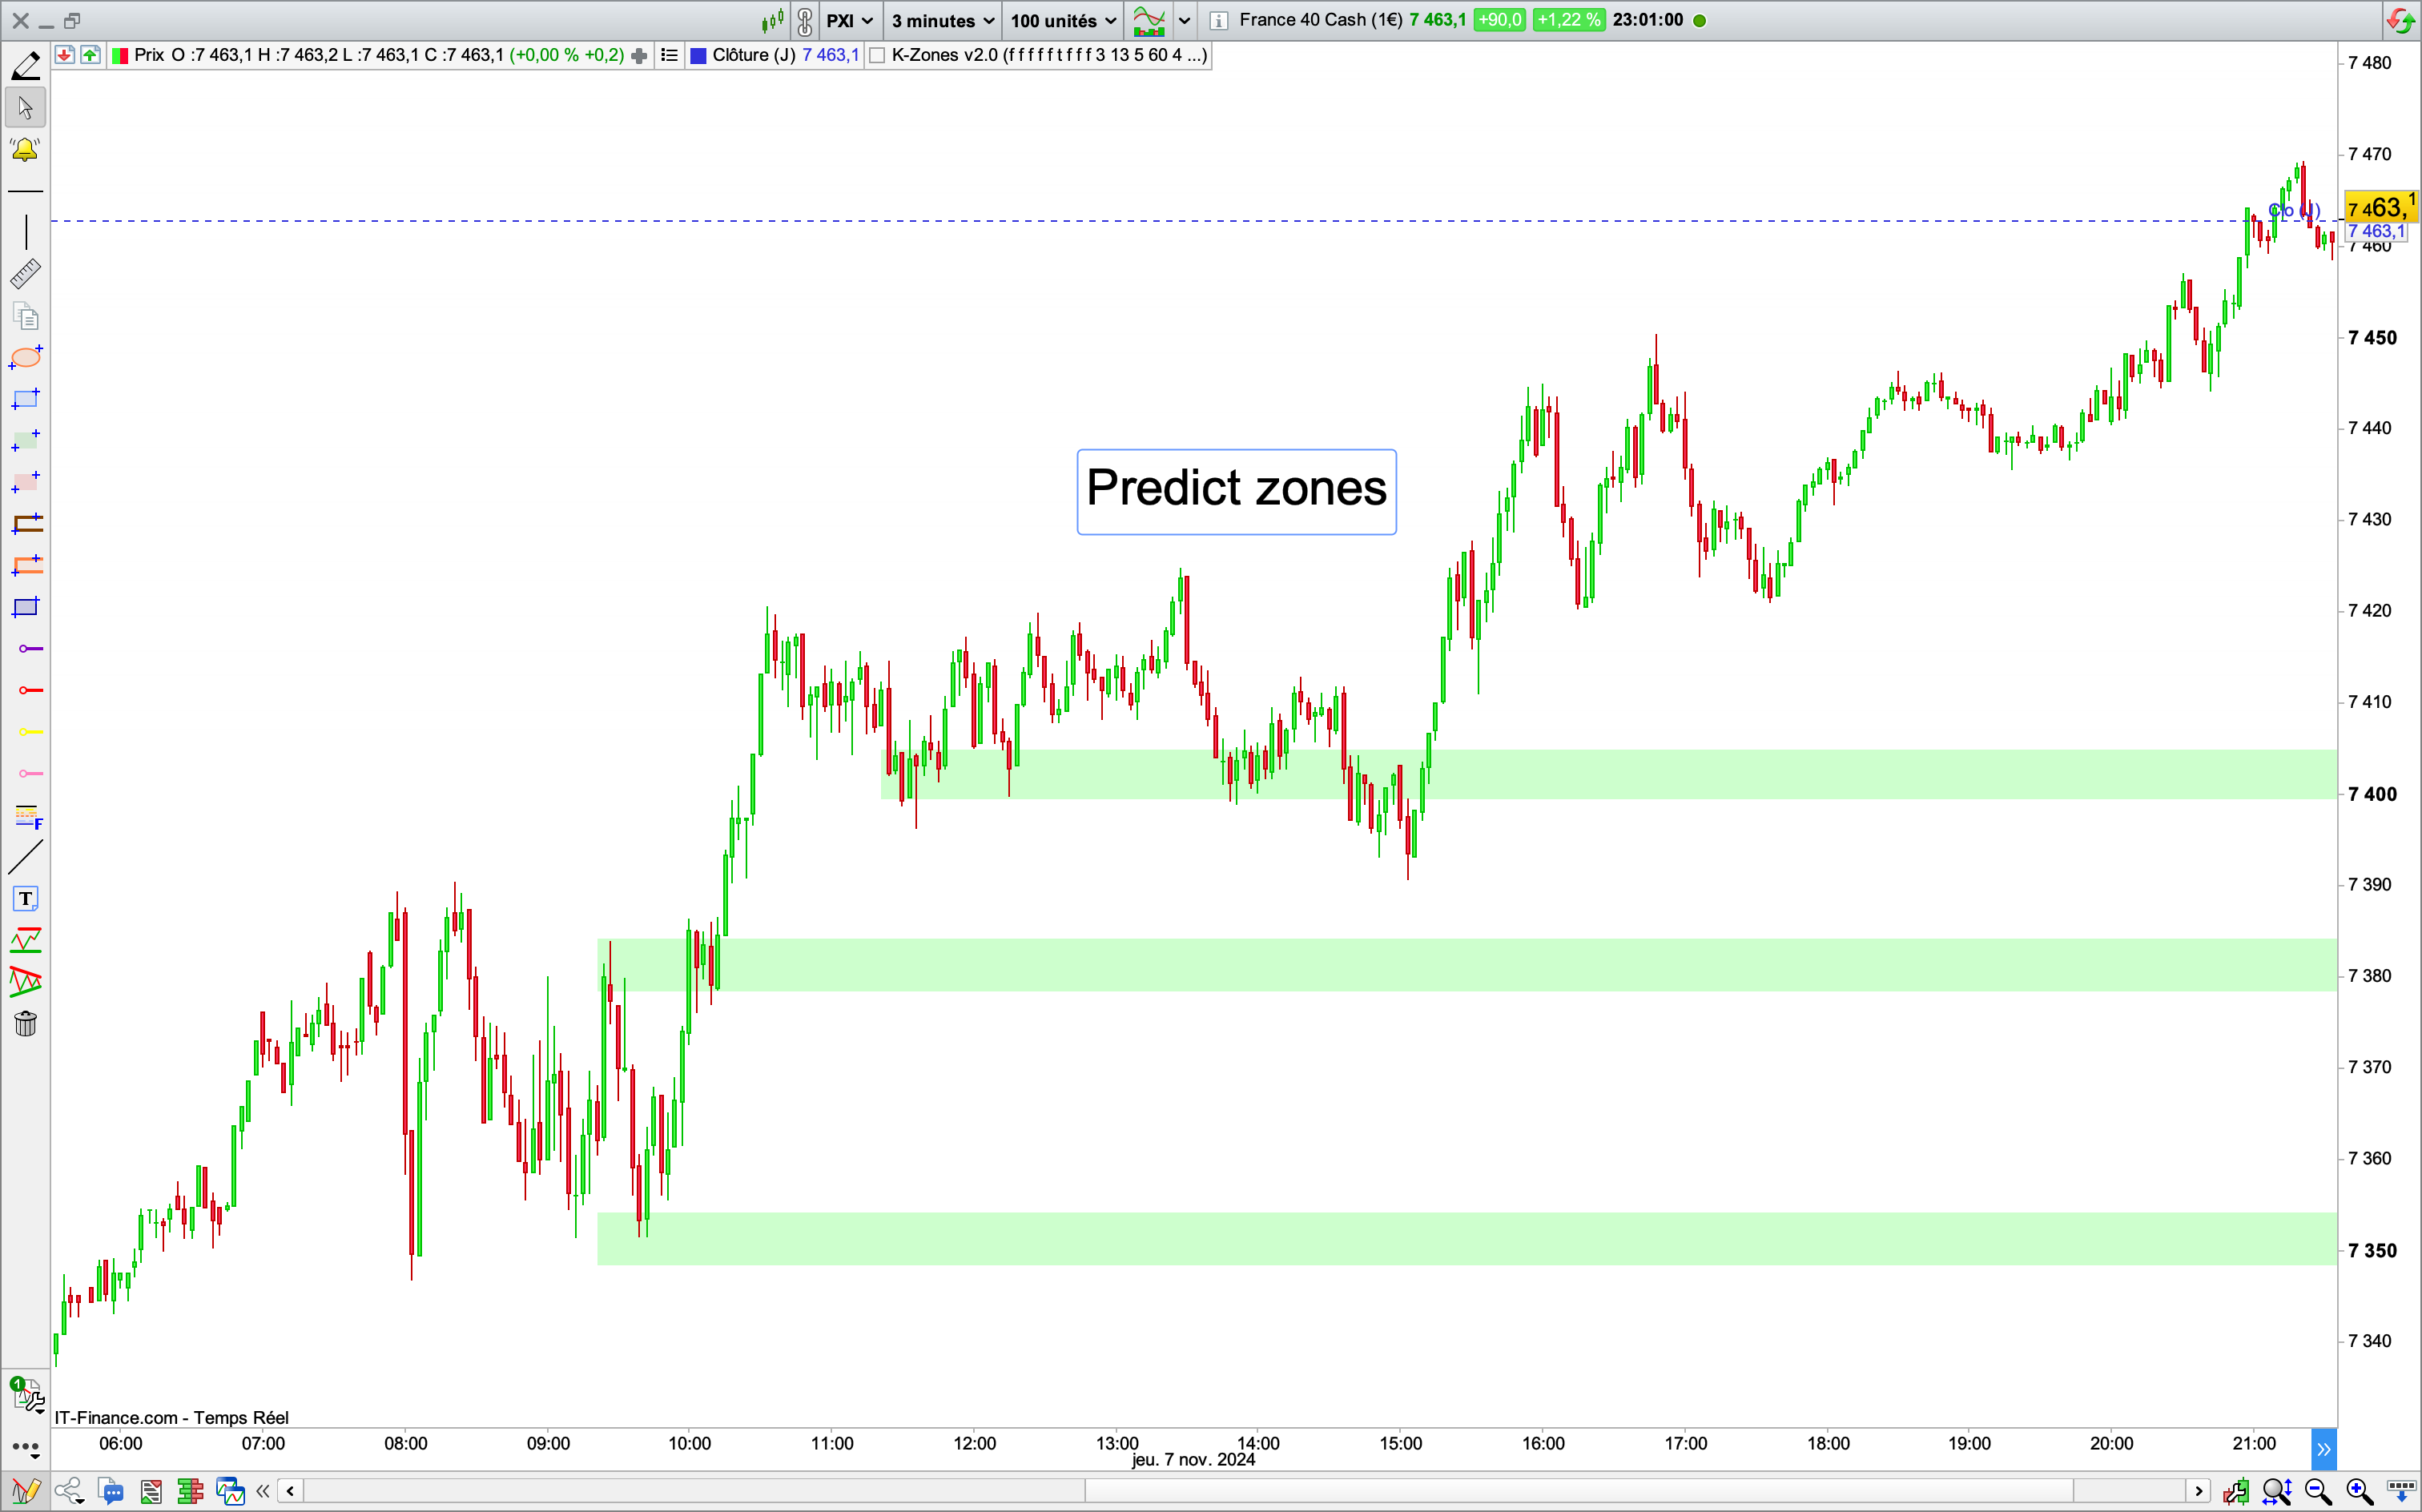
• Smart zones based on market volatility and psychology
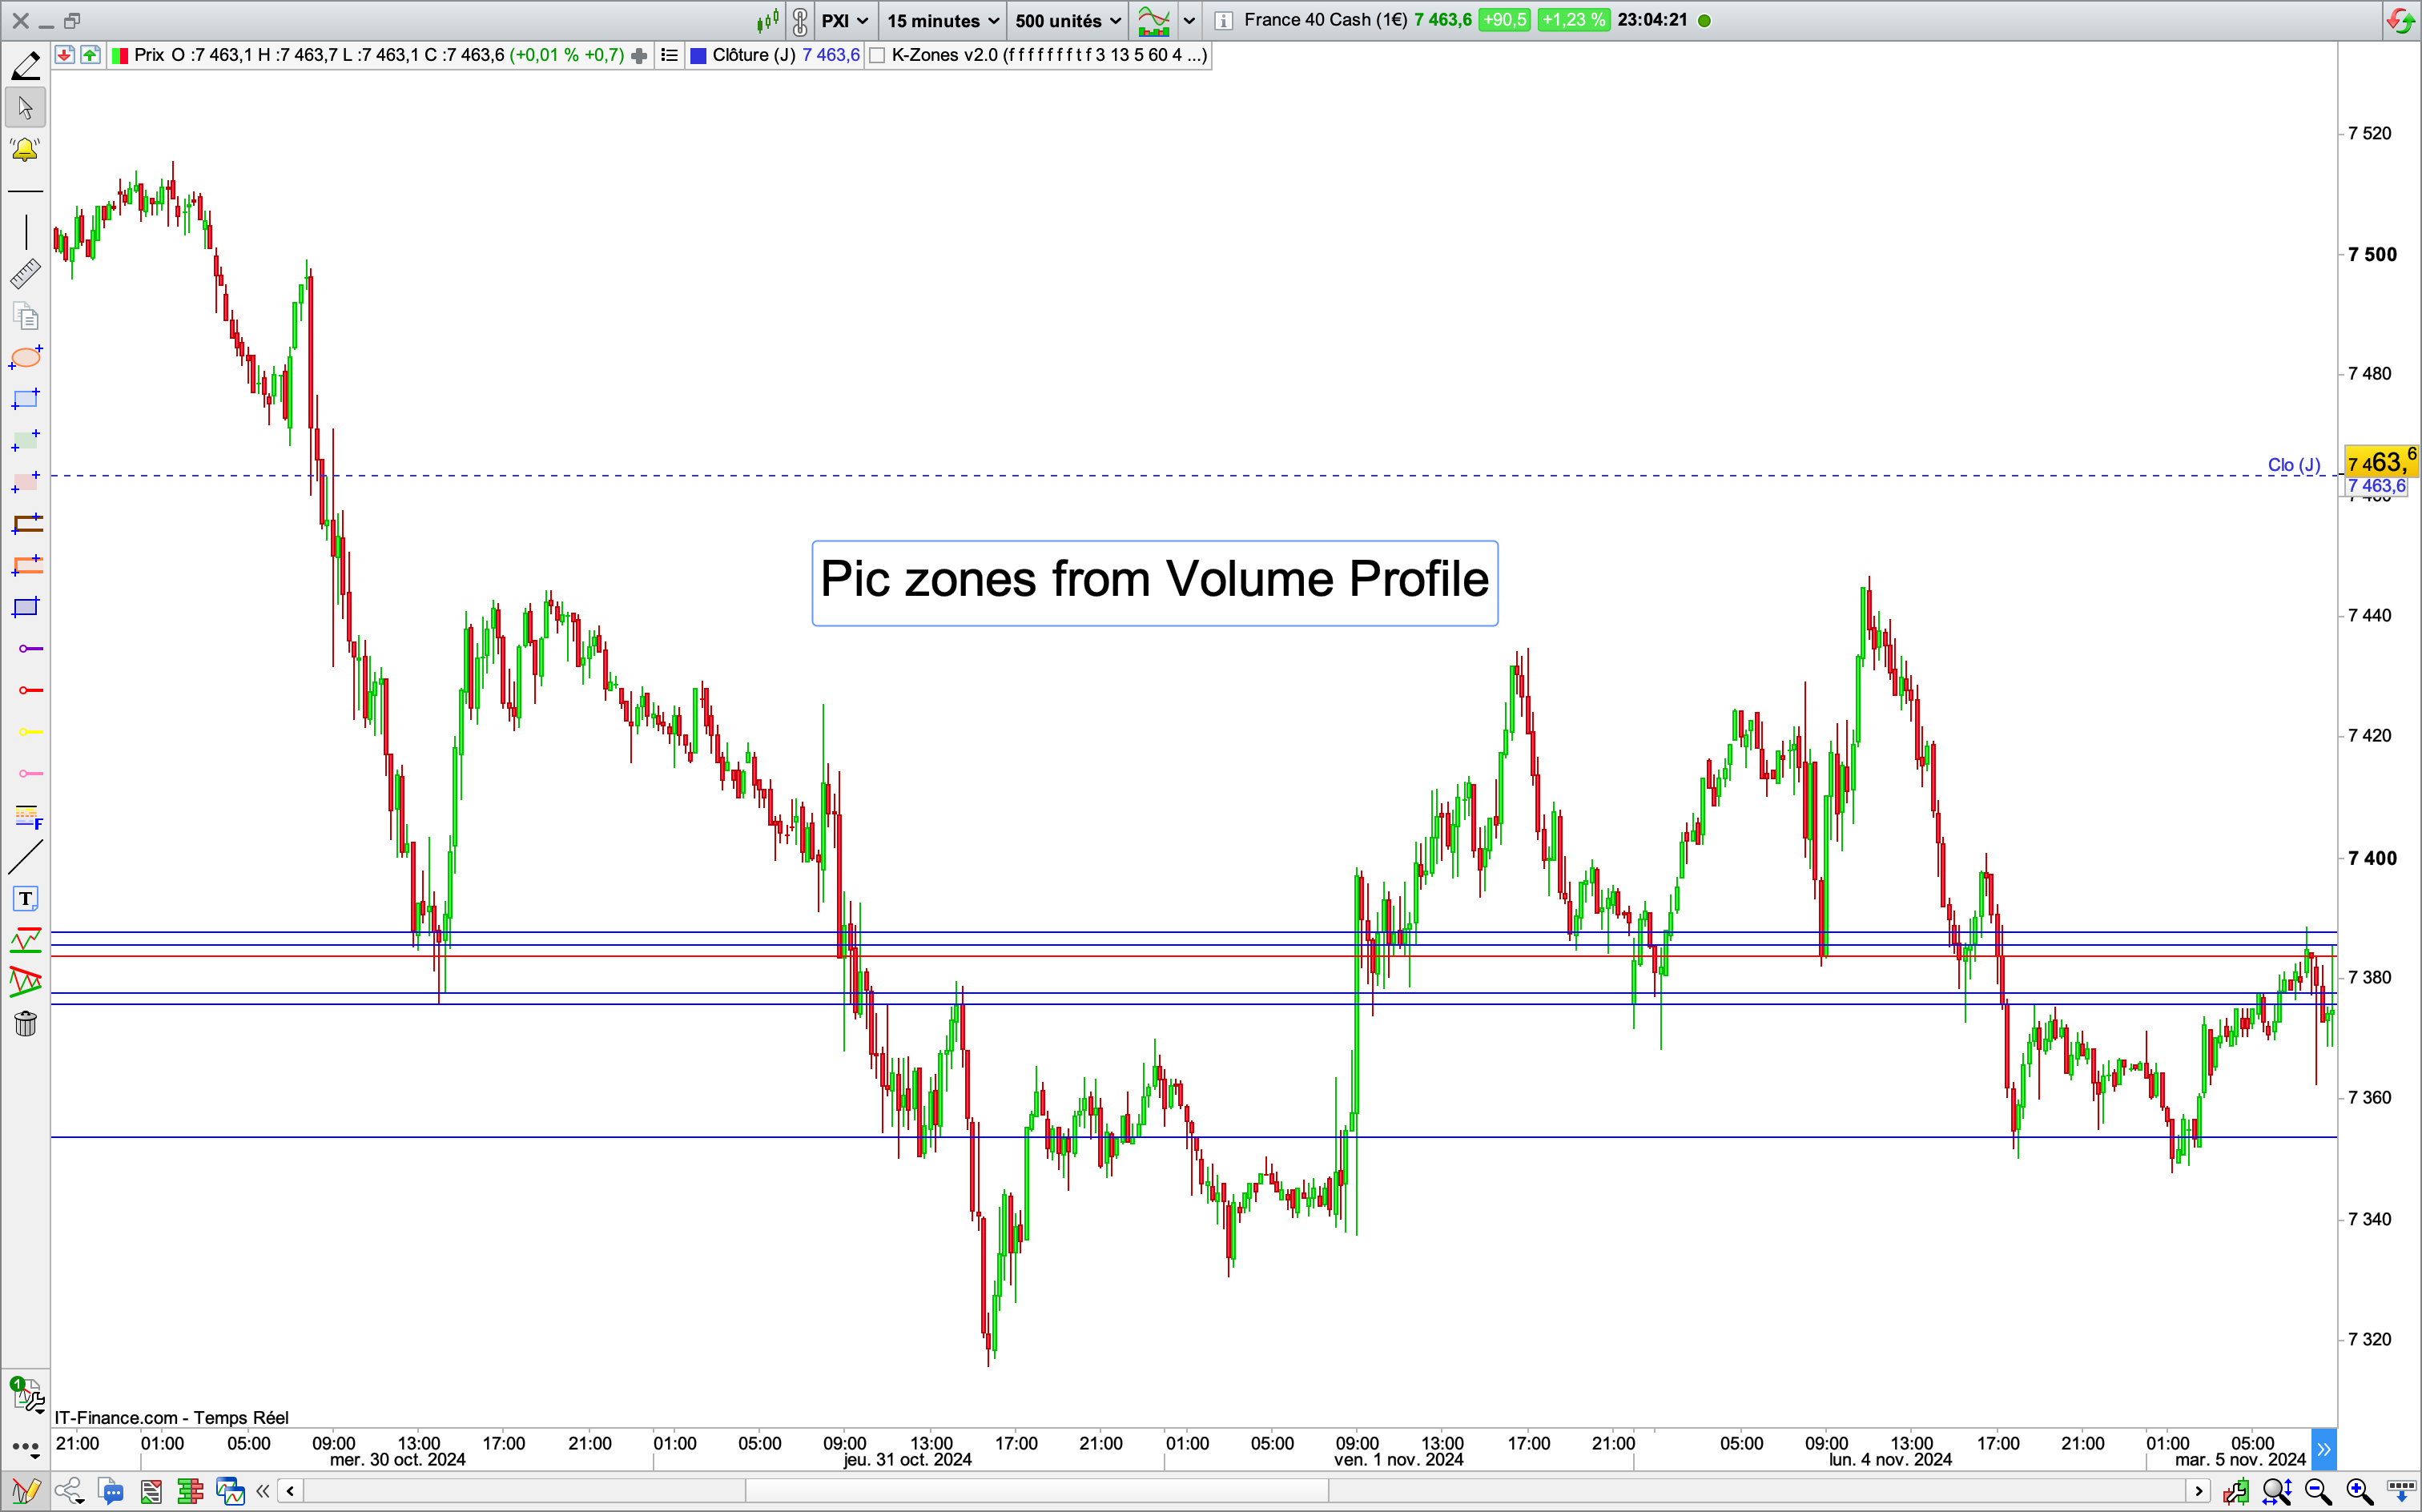
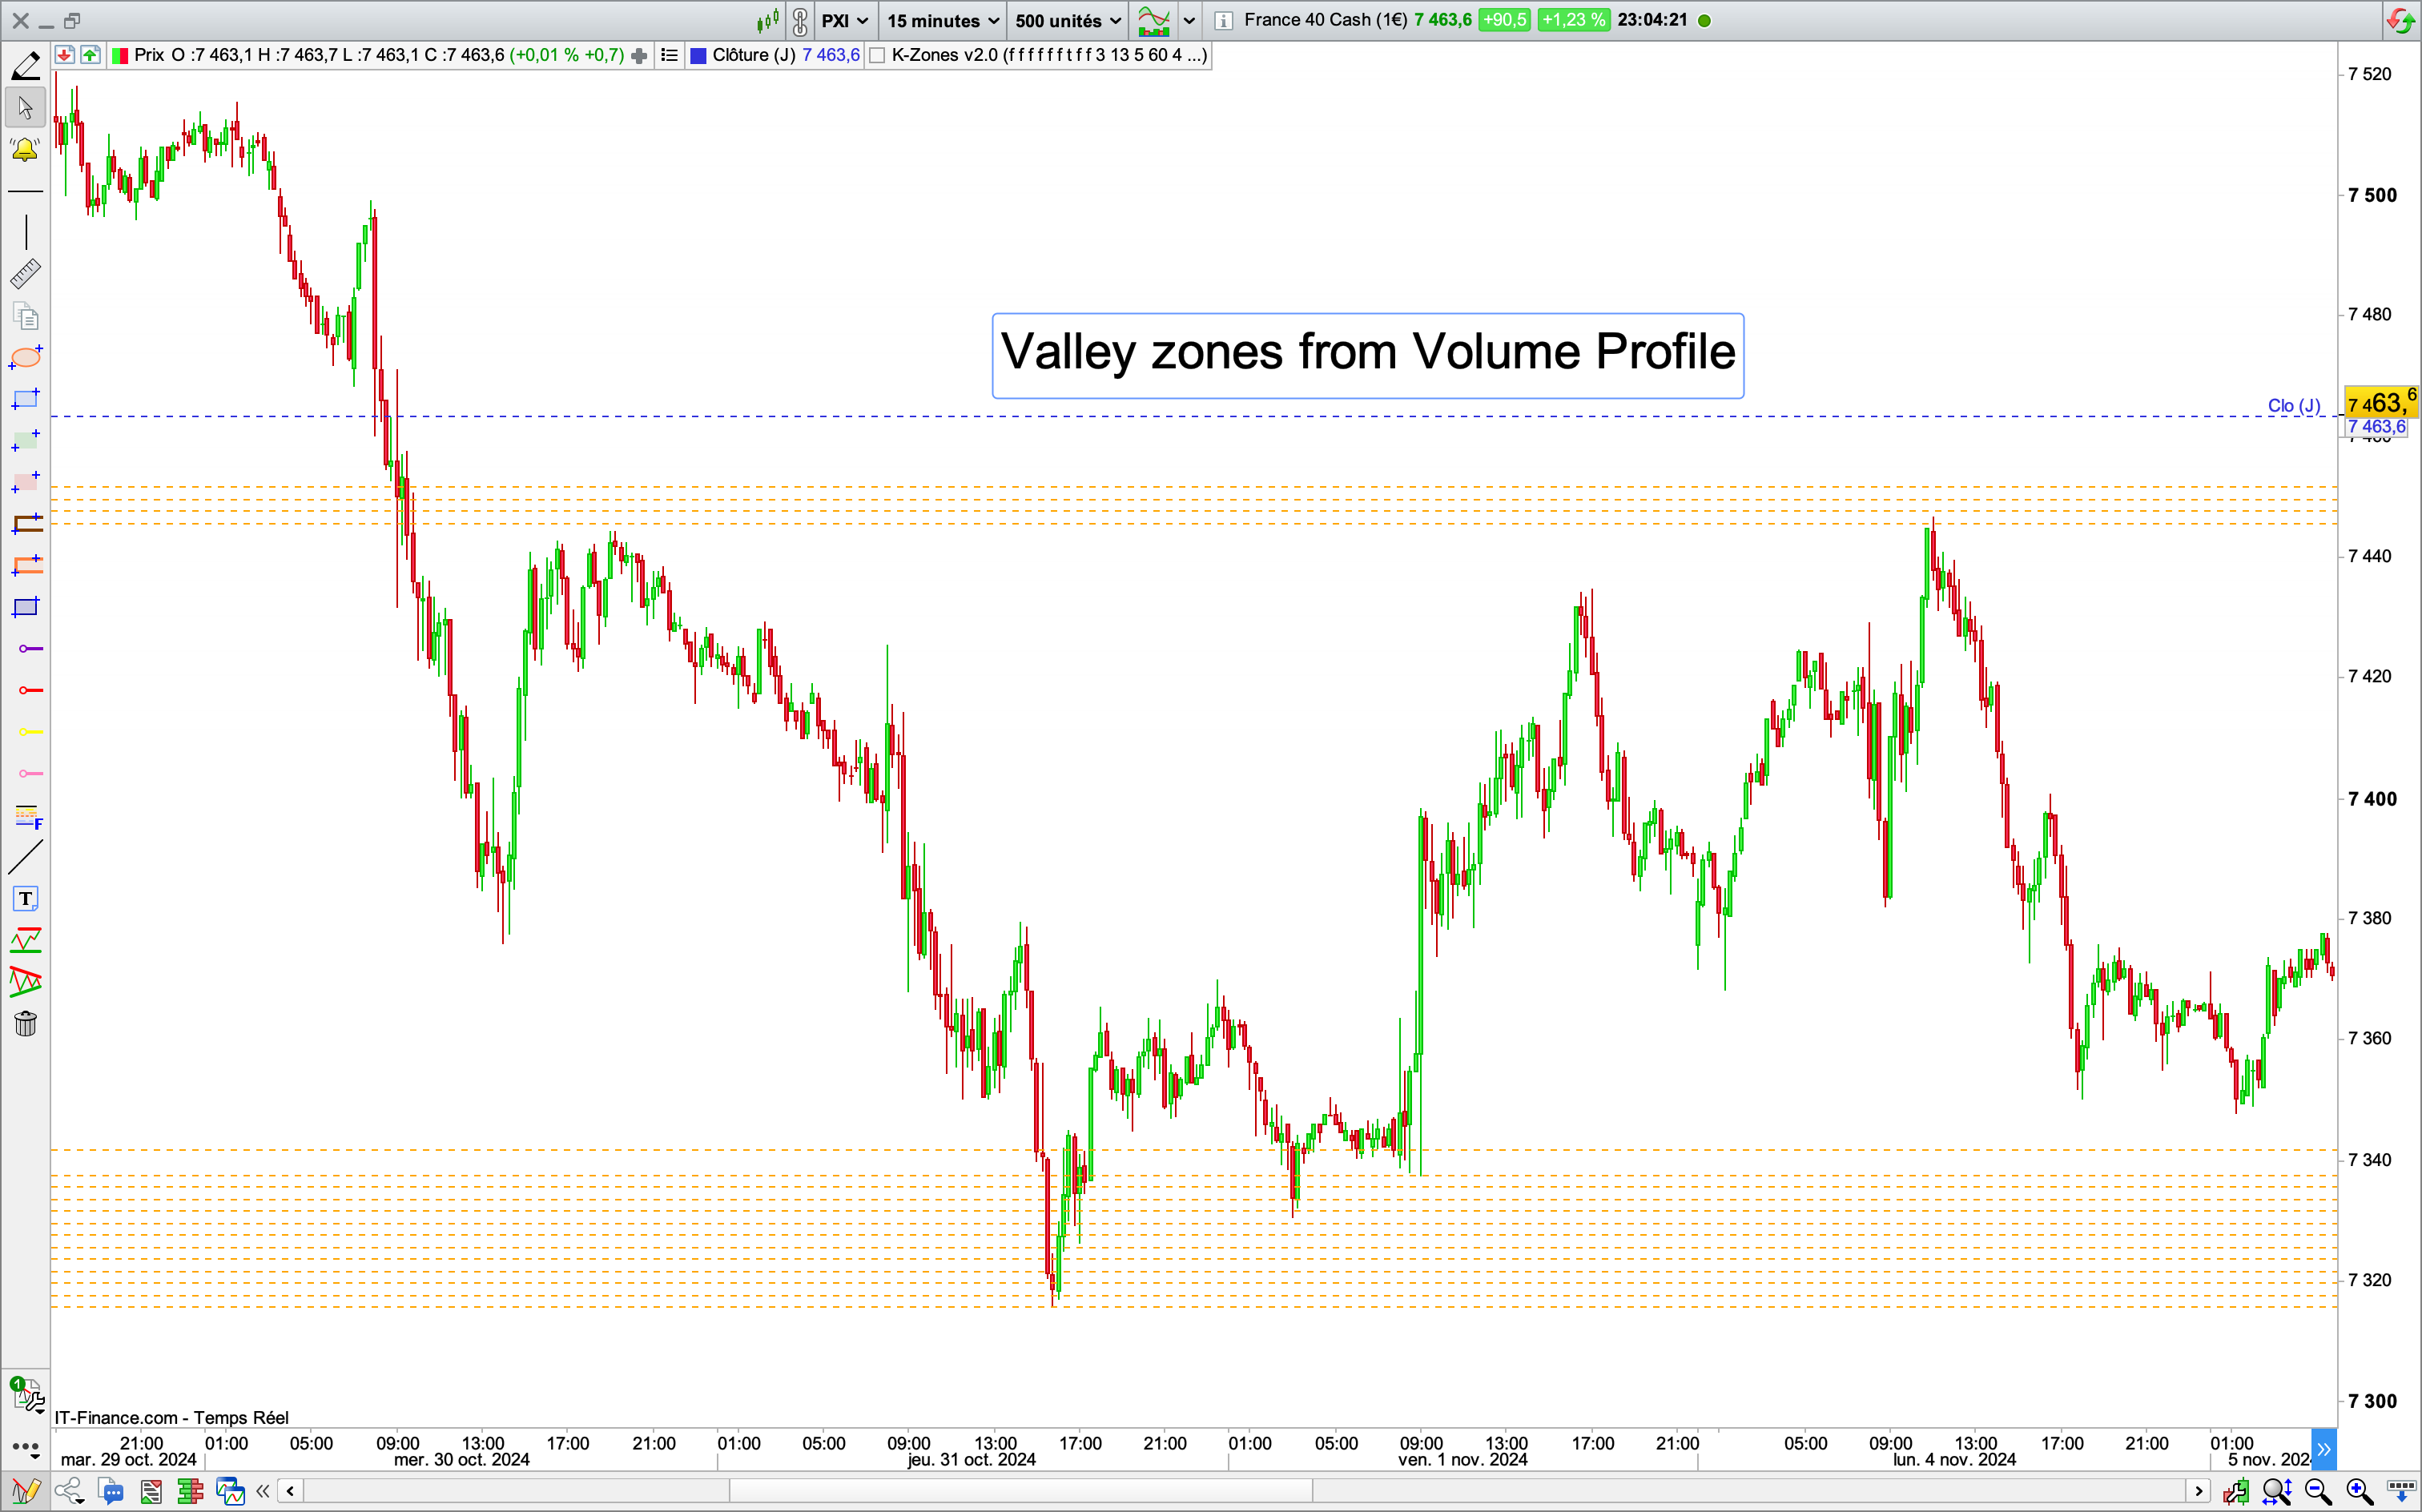
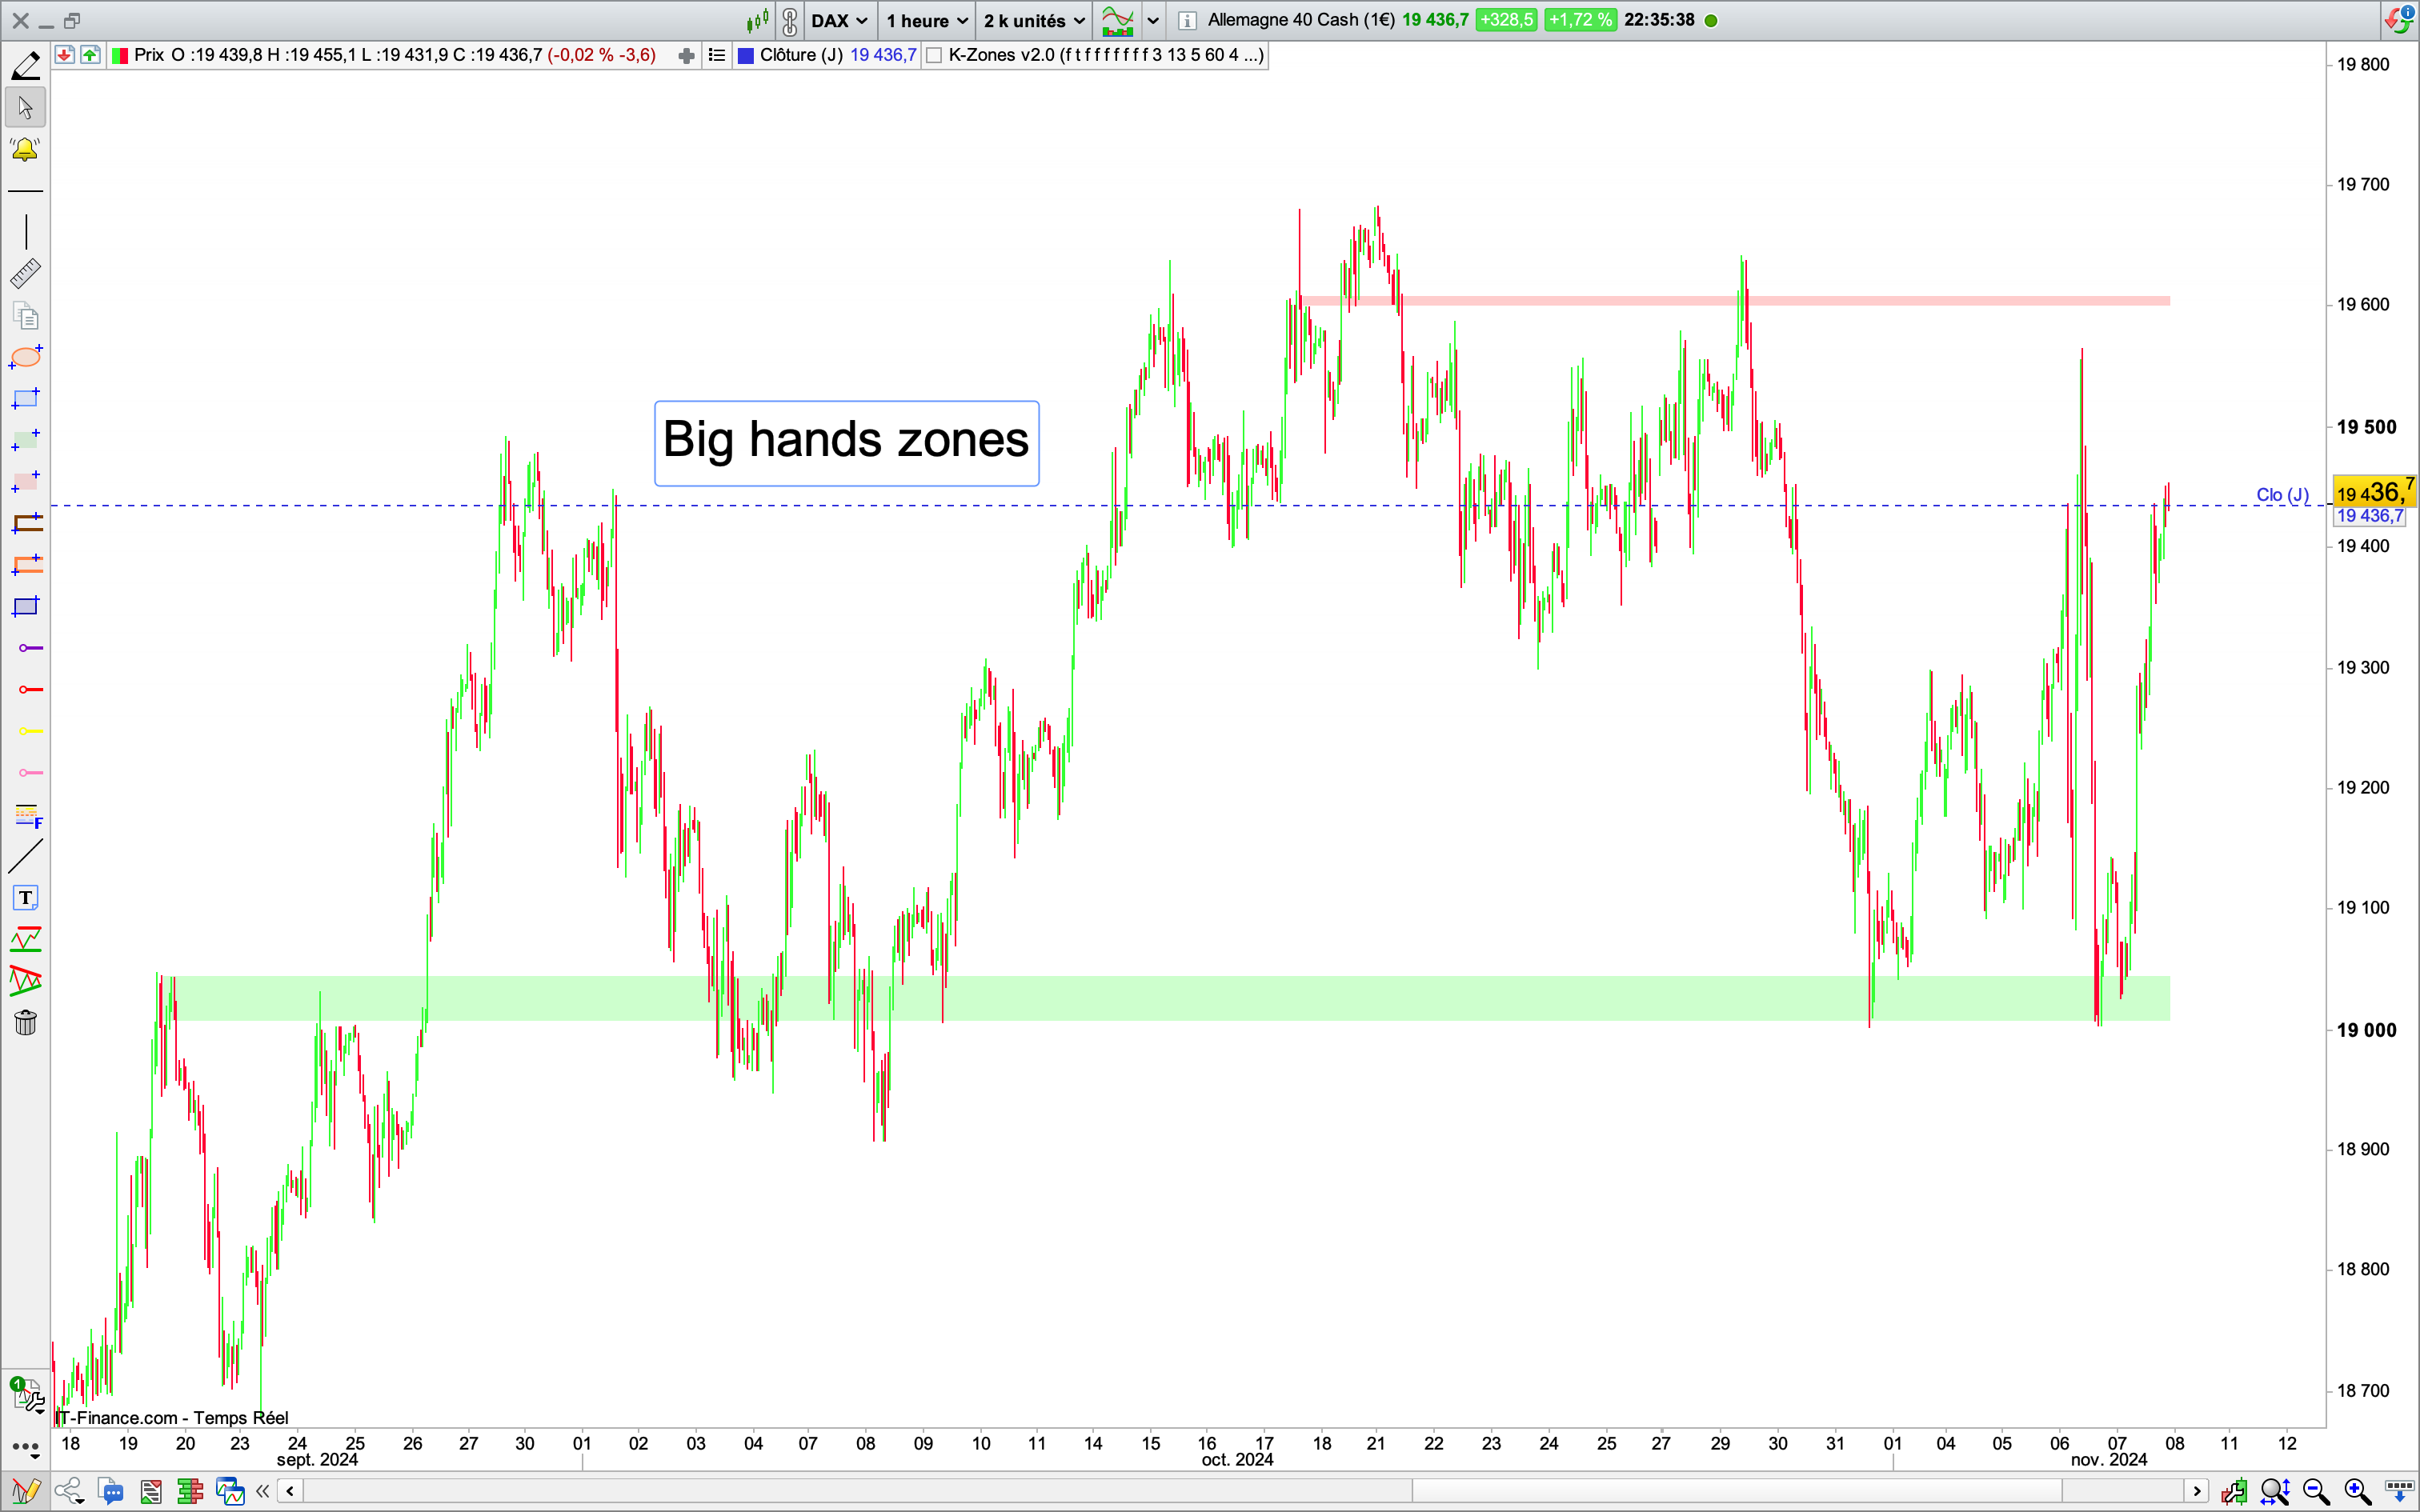
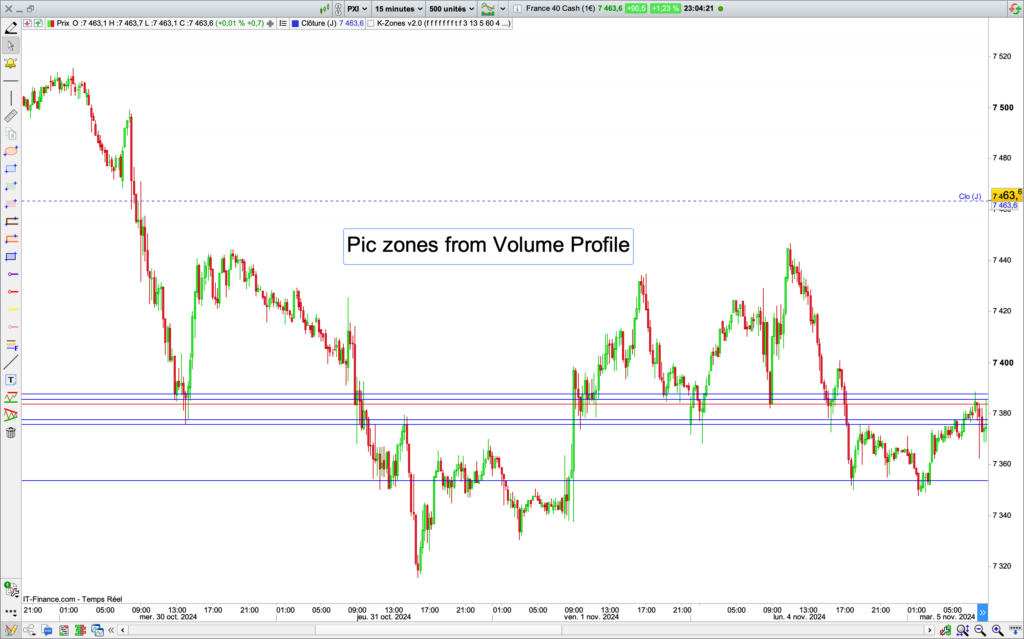
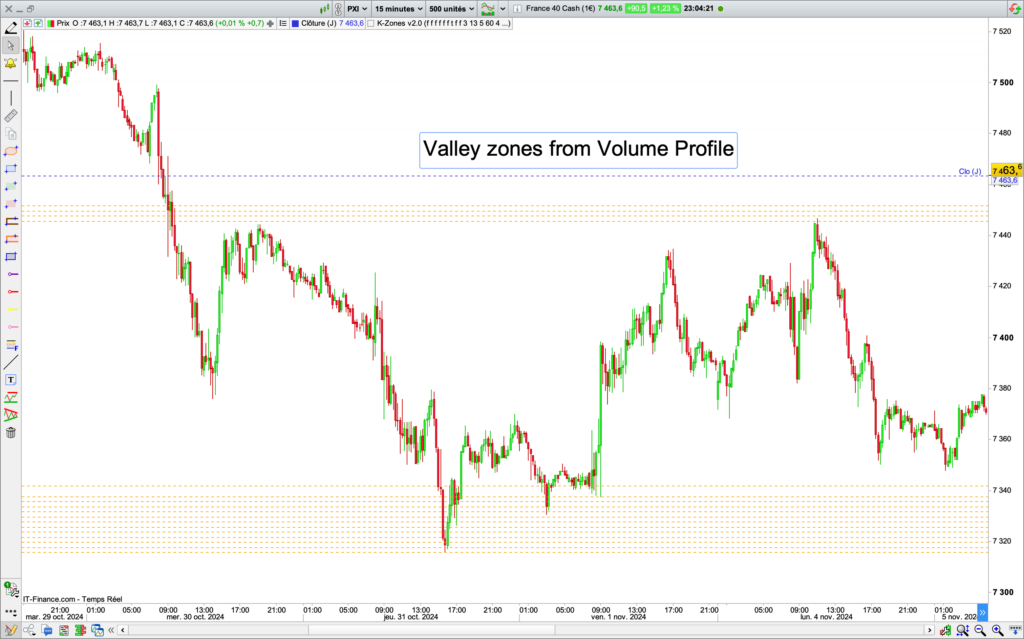
• Integrated Volume Profile with high/low volume levels detection
• Real-time Market Profile Single Prints
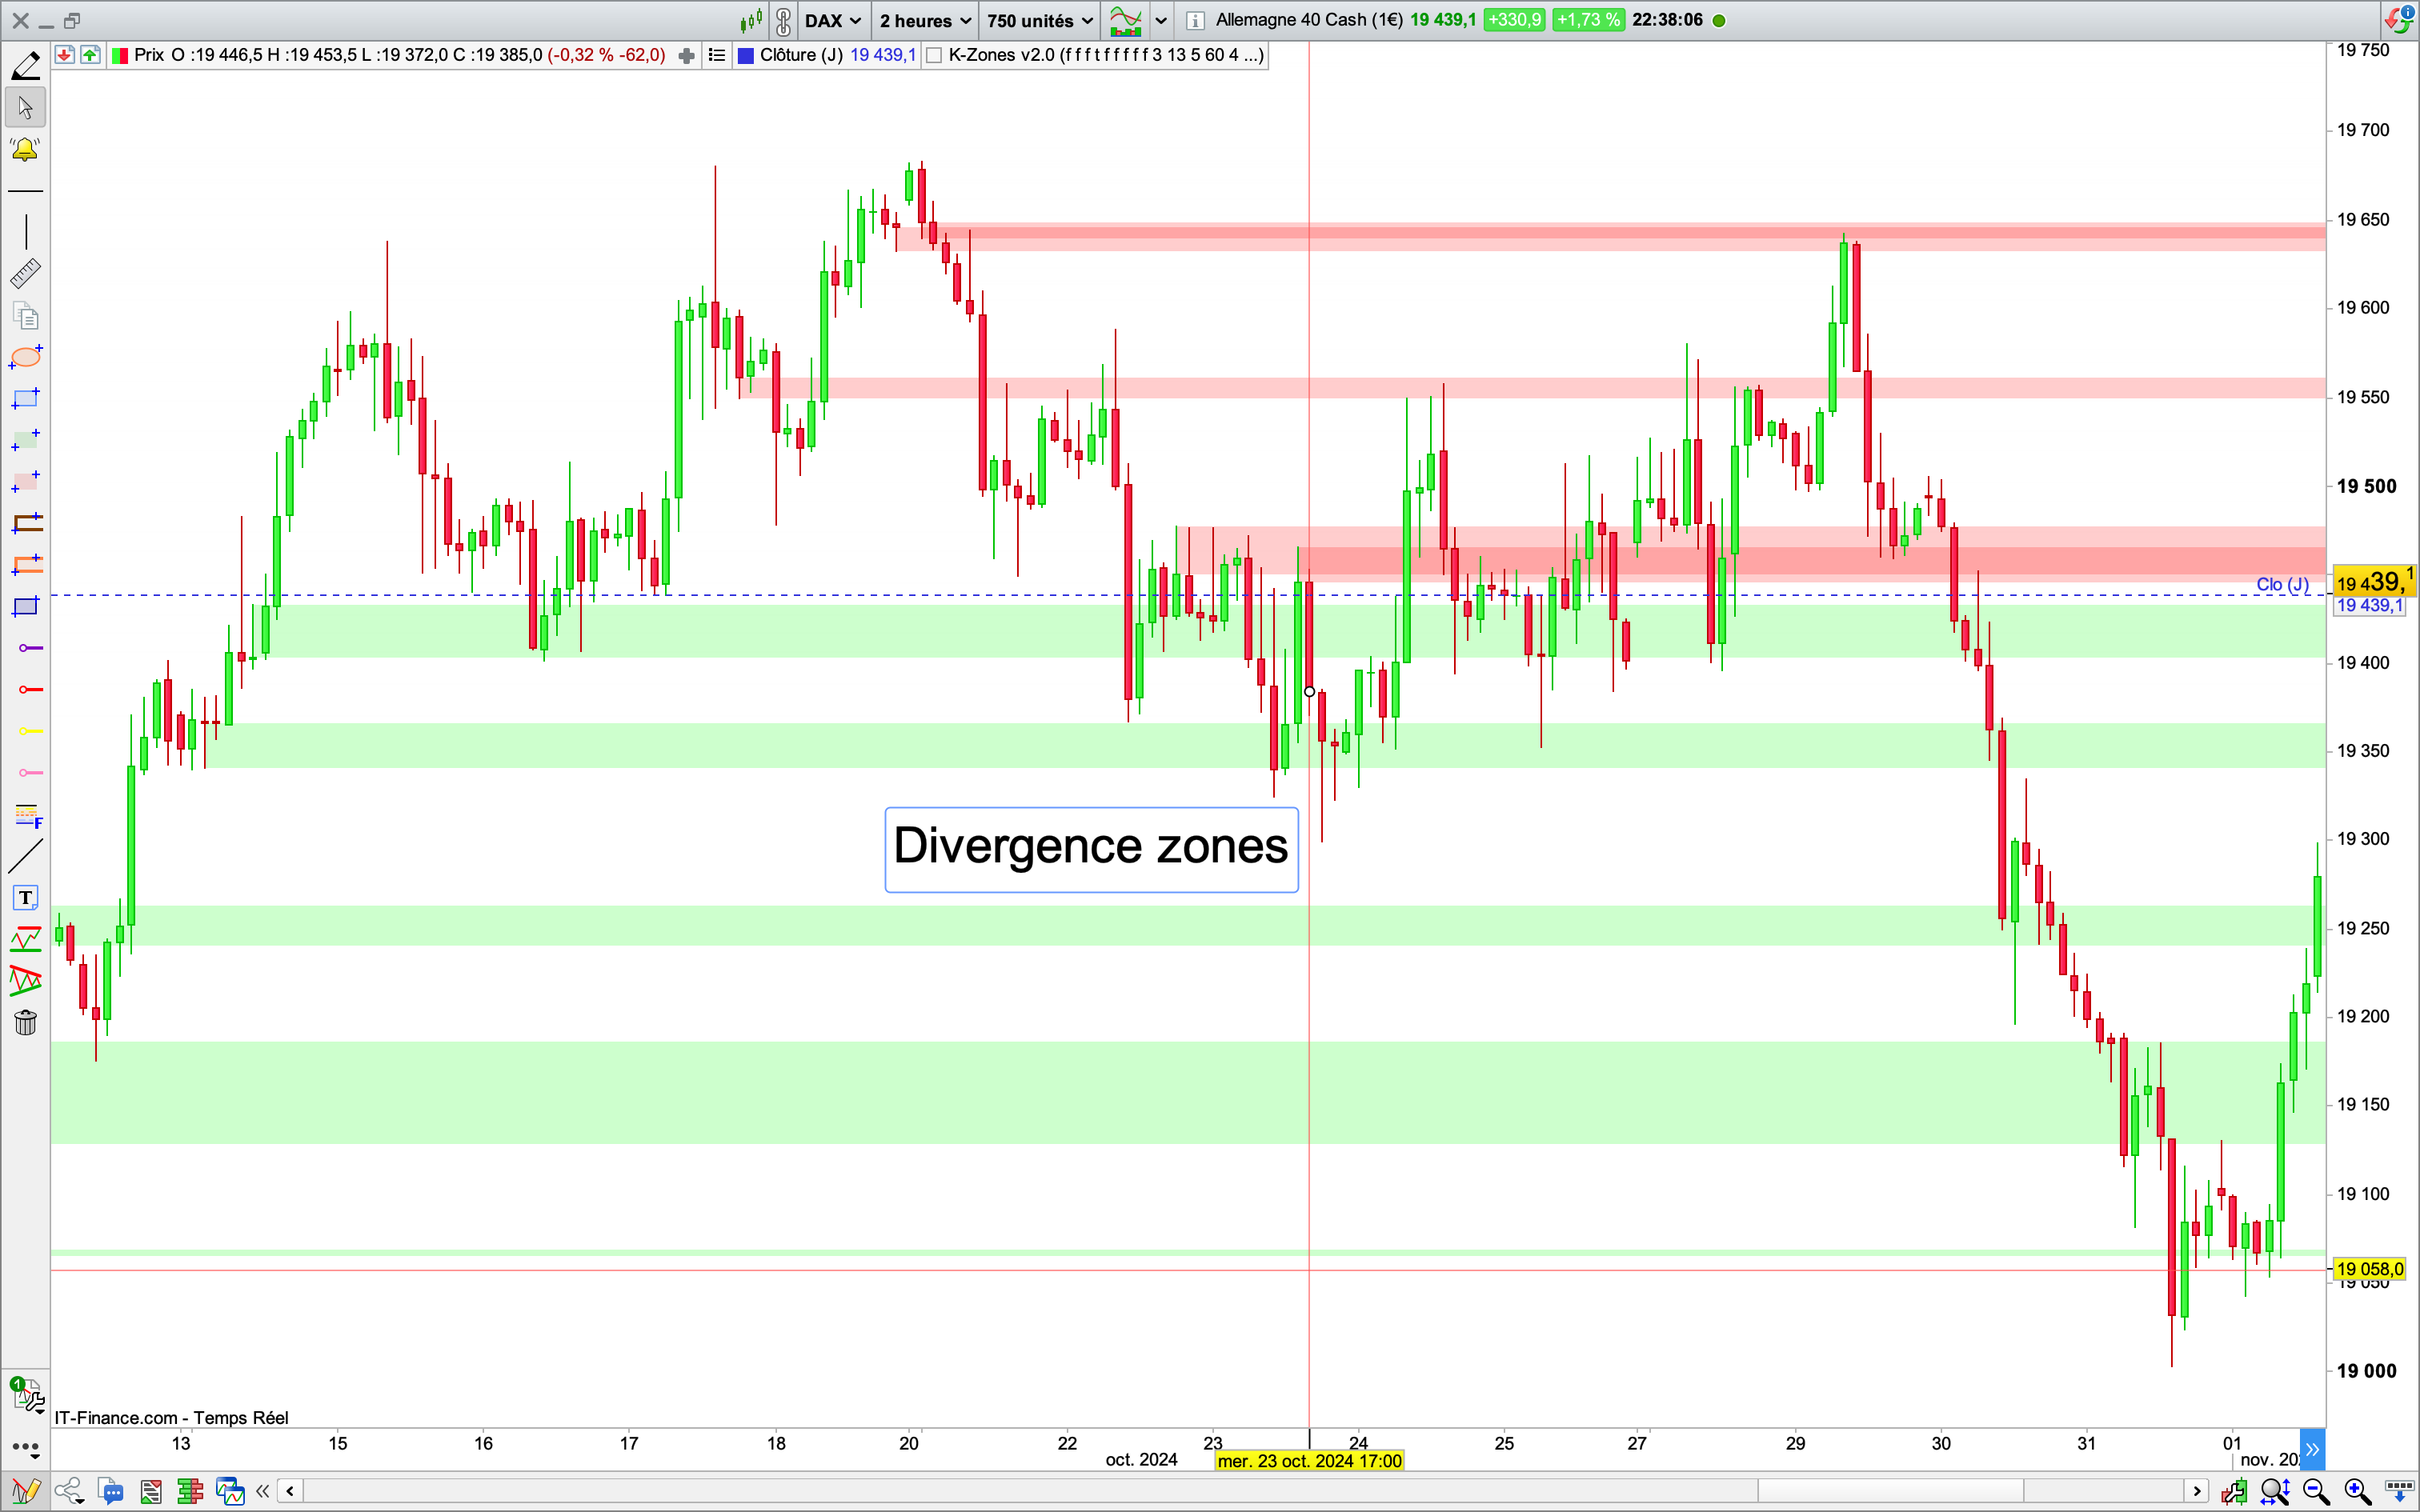
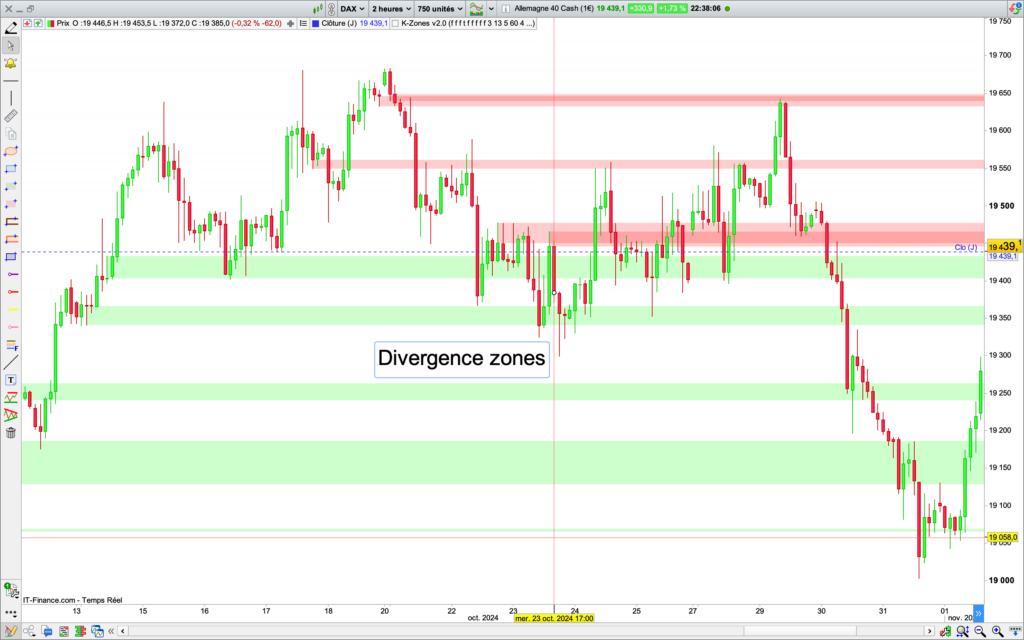
• Divergence zones with support/resistance
• Automated trendlines
• Dynamic Fibonacci retracement zones
🎯 Main Benefits:
• Clear visualization with intuitive color coding (green/red)
• Automatic identification of potential reversal zones
• Dynamic adaptation to market conditions
• Perfect for both day trading and swing trading
A comprehensive tool for traders looking to combine multiple analysis methods into one powerful indicator!
Optimized for: Forex, Indices, Cryptocurrencies, Stocks.



Avis
Il n’y a pas encore d’avis.