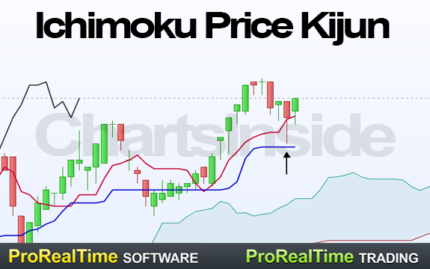
You know that kijun bends are very nice signals to enter or strengthen your positions and you can not afford to waste time looking for this type of signal. This is why a market scanner is essential in order to list automatically all the values of your lists presenting this so much sought-after configuration.
I propose you the new version of this ProScreener to which I made changes compared to the first version. The code is now lighter and faster, and the identification of the fallback signals is completely redesigned. Another novelty of the V2, you can choose now the version you prefer between the ProRealTime version End of Day Quote or ProRealTime Real Time version. If you’re working on the free version of ProRealTime, then the end-of-day edition will probably be the most appropriate, but if you have access to real-time data, the real-time version will surely be the version that suits you best.
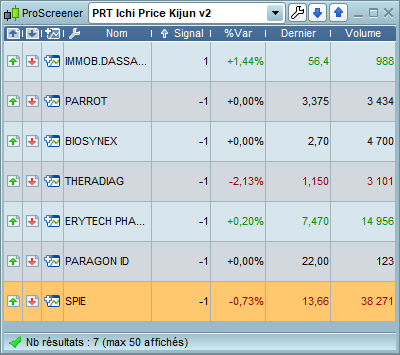 This new version of ProScreener Price Kijun for ProRealTime allows you to see the signal type directly from the Signal column of the ProScreener window. There you will find two types of signals, a signal of type 1 informs you that the kijun bend is on an uptrend and conversely a -1 signal indicates a decline on a sell tendency. The display of the signal allows you to save even more time in your analyzes by avoiding you to take a look at all the graphs of the selected values in search of a signal in the direction of your investment that it is to the purchase or VAD.
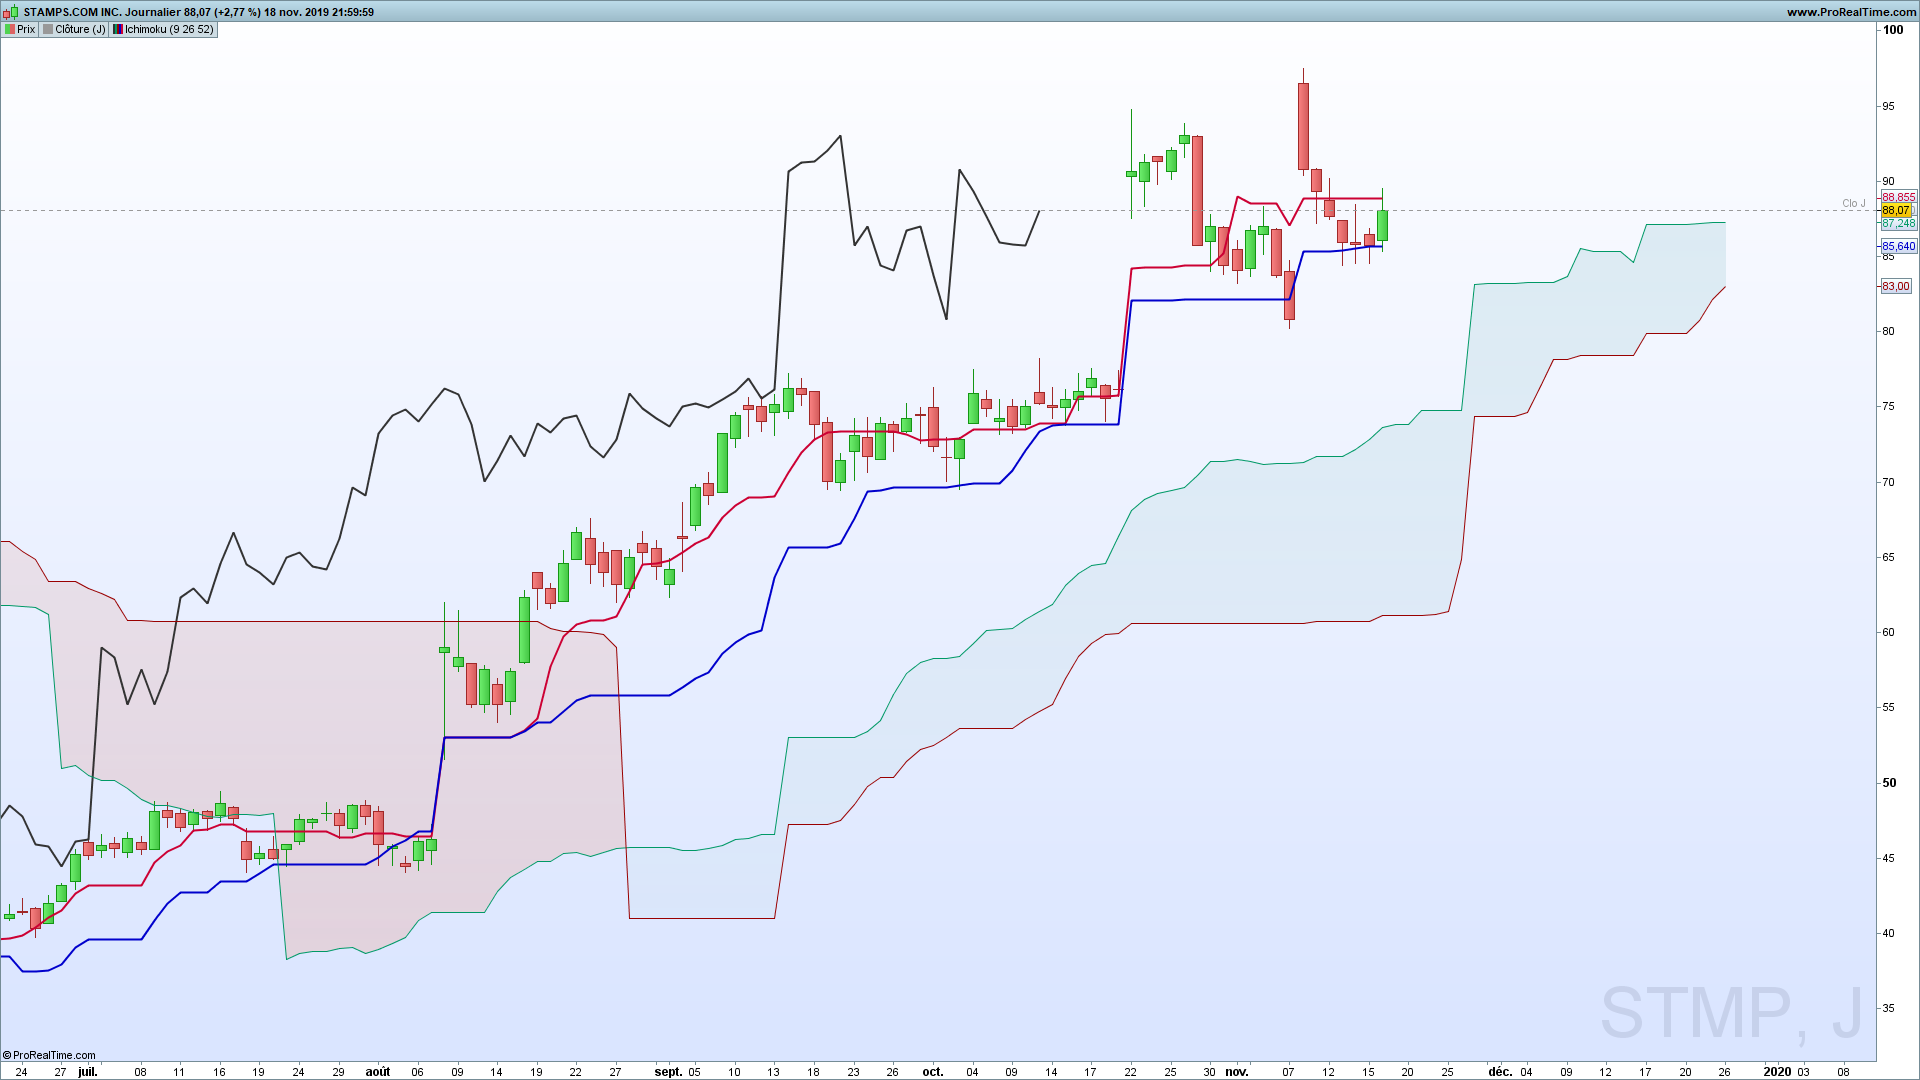
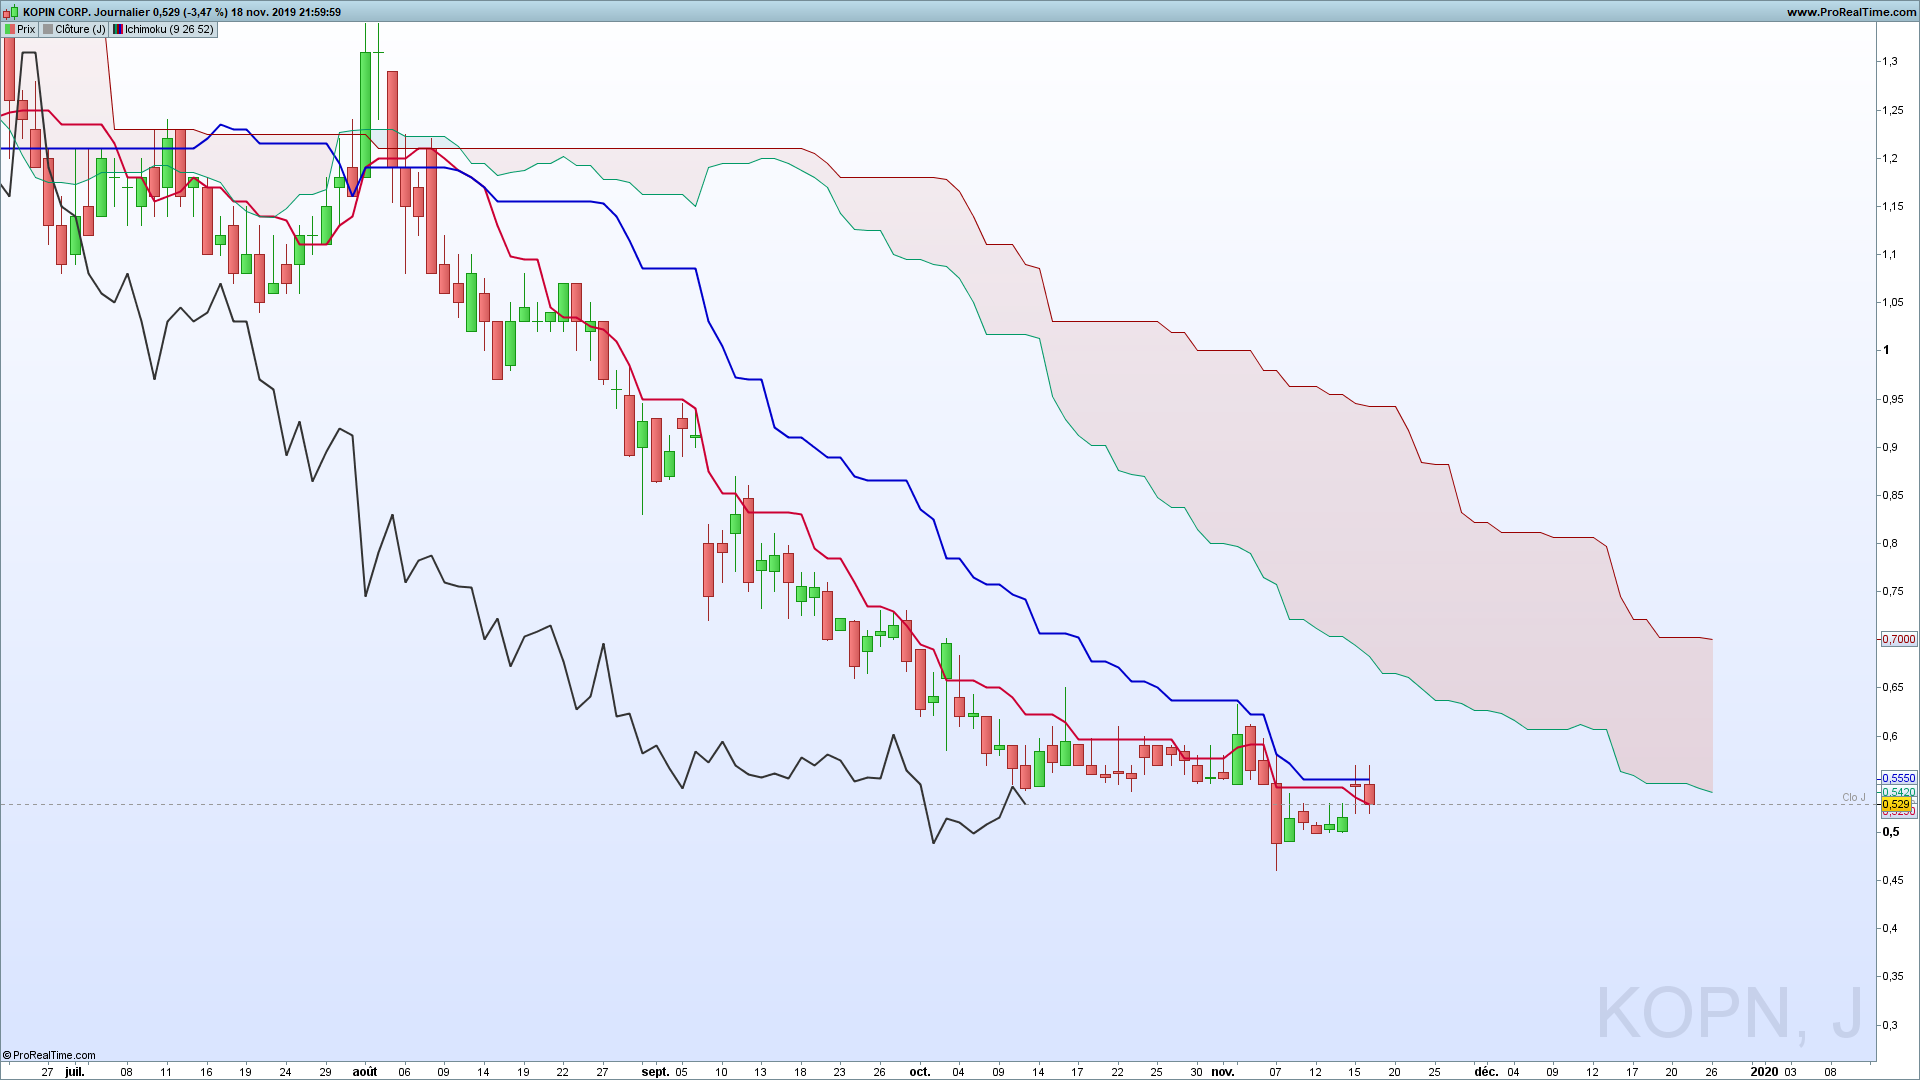
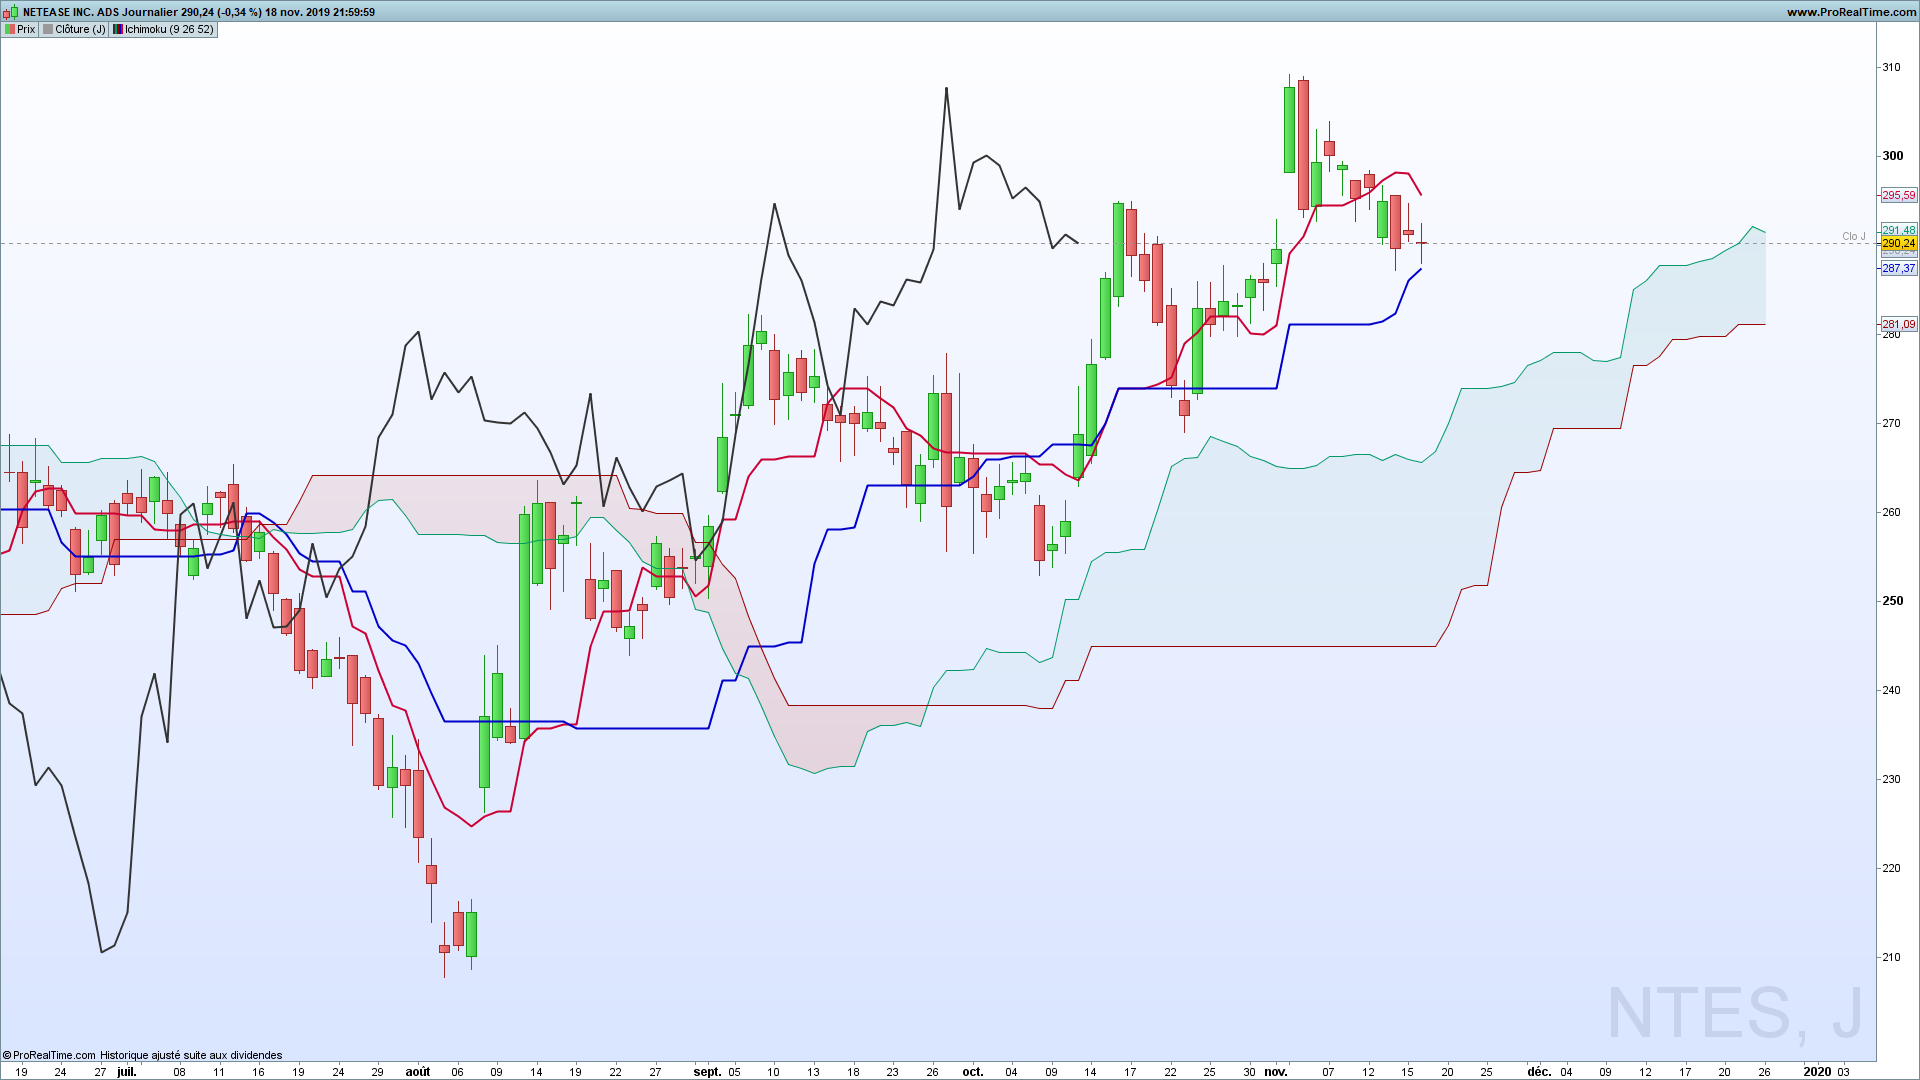
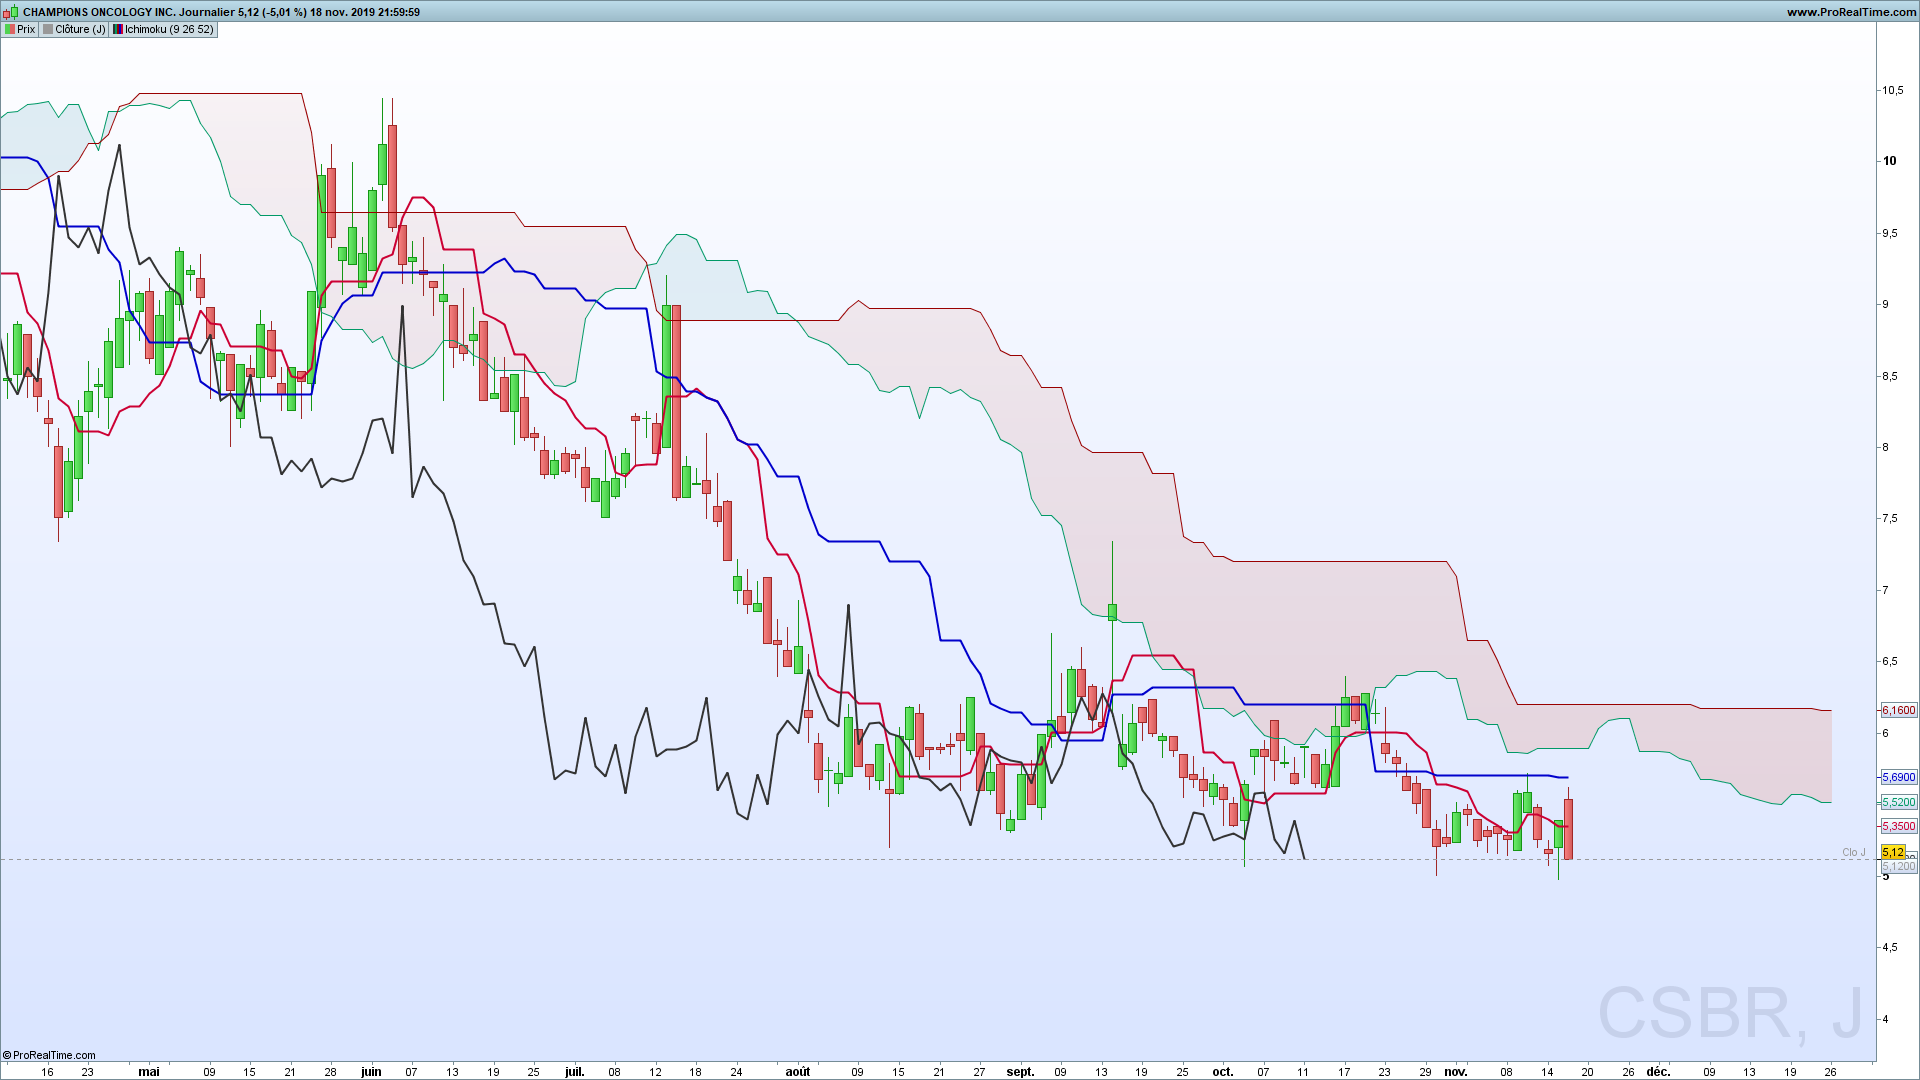
Here are some screenshots of graphics detected by the ProScreener.
Watch the demonstration video



Avis
Il n’y a pas encore d’avis.