

The Gamma Levels Indicator for the S&P 500 is a sophisticated financial tool designed to provide traders and investors with crucial insights into market dynamics. This indicator visualizes various gamma levels, enabling users to make informed decisions based on comprehensive market data. It is particularly valuable for understanding potential support and resistance levels derived from options market activity.
Features:
- Gamma Levels Display: the indicator showcases the following critical gamma levels:
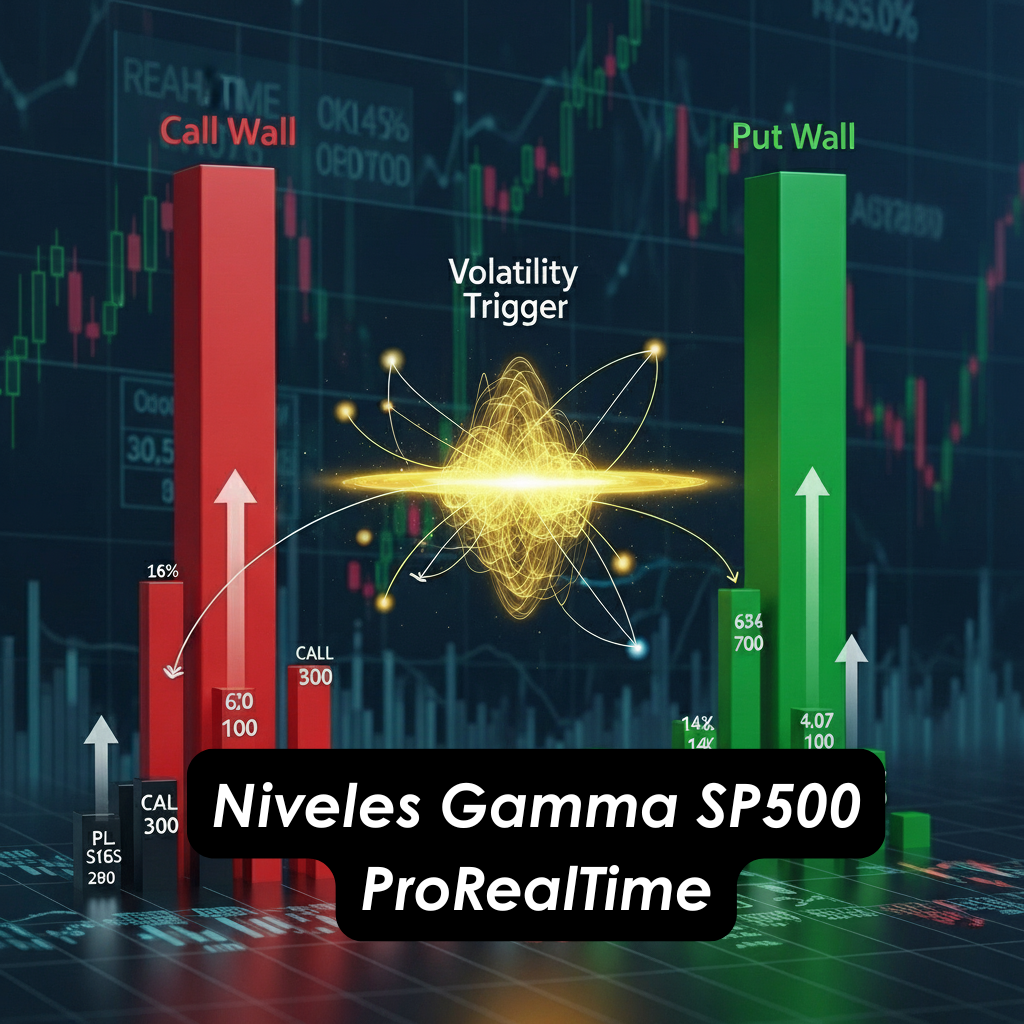
- Call Wall: represents the strike price with the highest concentration of call options. This level often acts as a significant resistance point where upward price movement may encounter selling pressure.
- Put Wall: indicates the strike price with the highest concentration of put options. This level commonly acts as a major support point where downward price movement may find buying interest.
- Quantitative Resistance: a calculated resistance level derived 0DTE call options. It signifies where the market may face strong resistance based on the current options landscape in the shortest run.
- Quantitative Support: a calculated support level derived from 0DTE put options. It highlights where the market may find substantial support in the shortest run.
- VolTrig (Volatility Trigger): this level marks a significant point where gamma exposure could lead to increased volatility in the underlying asset. It is essential for anticipating sudden market movements.
- Daily VolTrig: a day-specific volatility trigger point using 0DTE options, offering a granular view of potential volatility shifts for the current trading session.
- Historical Context: the indicator provides a 3-month historical view, allowing users to analyze how gamma levels have evolved over time. This historical context is crucial for identifying trends and patterns, helping traders understand past market behaviors and predict future movements.
- Daily Updates: to ensure accuracy and relevance, the Gamma Levels Indicator is updated daily. This daily refresh incorporates the latest options data, reflecting the most current market conditions and offering users up-to-date information for their trading strategies.
Visualization: the indicator is presented on a dynamic chart overlaying the S&P 500 price action. Each gamma level is distinctly marked with clear labels for easy identification.
These visual cues help users quickly discern key support and resistance levels and potential volatility triggers.
Usage: the Gamma Levels Indicator is an essential tool for both short-term traders and long-term investors. Short-term traders can leverage the daily updates and volatility triggers to time their entries and exits more precisely. Long-term investors can use the historical context and quantitative support and resistance levels to identify longer-term trends and potential turning points in the market.
Technical Specifications:
- Data Source: The indicator pulls data from our own quantitative models developed by @InversoresInstitucionales, ensuring accurate and timely gamma level calculations.
- Platform Compatibility: tt is compatible with major ProRealTime versions.
- Customization: users can customize the look and feel of the indicator, adjusting colors, line thickness, and historical range according to their preferences.
Find next a video guide that will explain how to insert this indicator in your S&P500 chart, and the different visualization variables you can play with to customize your chart.
Conclusion: the Gamma Levels Indicator for the S&P 500 is a powerful analytical tool designed to enhance market understanding and trading performance. By visualizing key gamma levels and providing historical context and daily updates, it equips users with the insights needed to navigate the complexities of the options market and make more informed trading decisions.
Avis
Il n’y a pas encore d’avis.