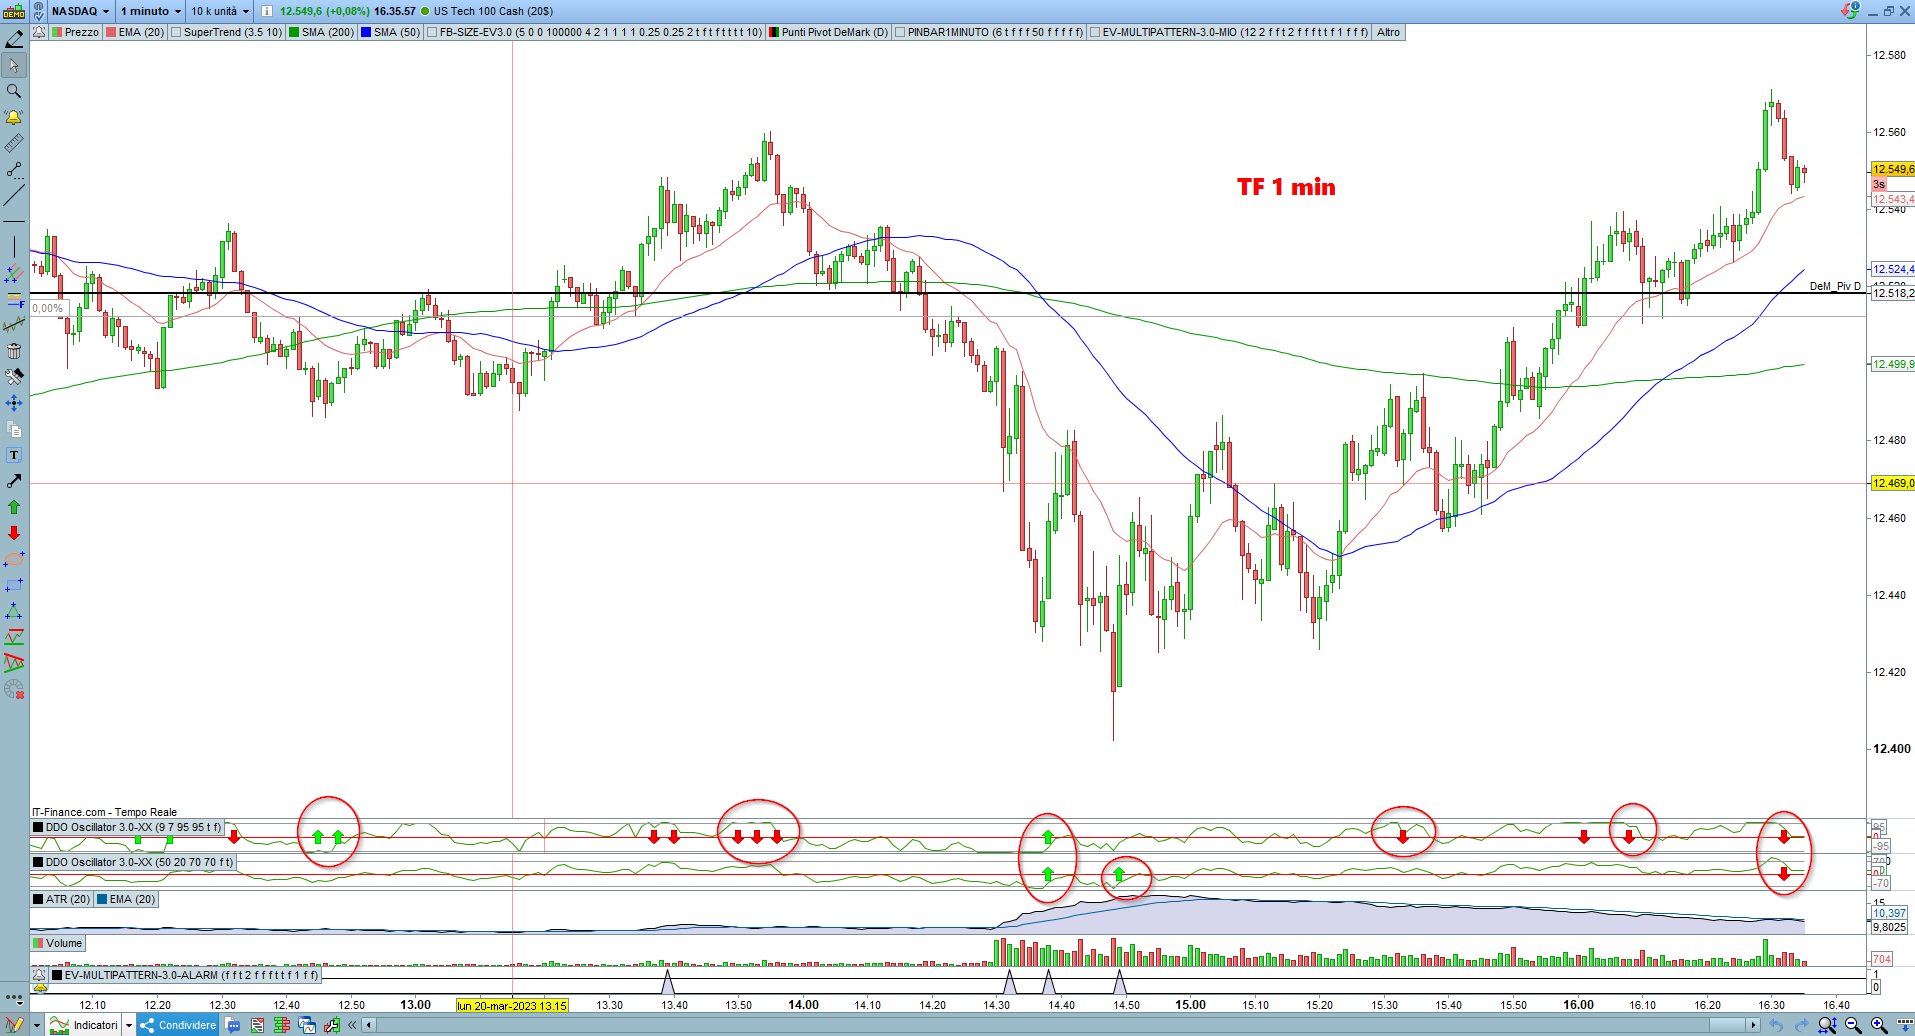
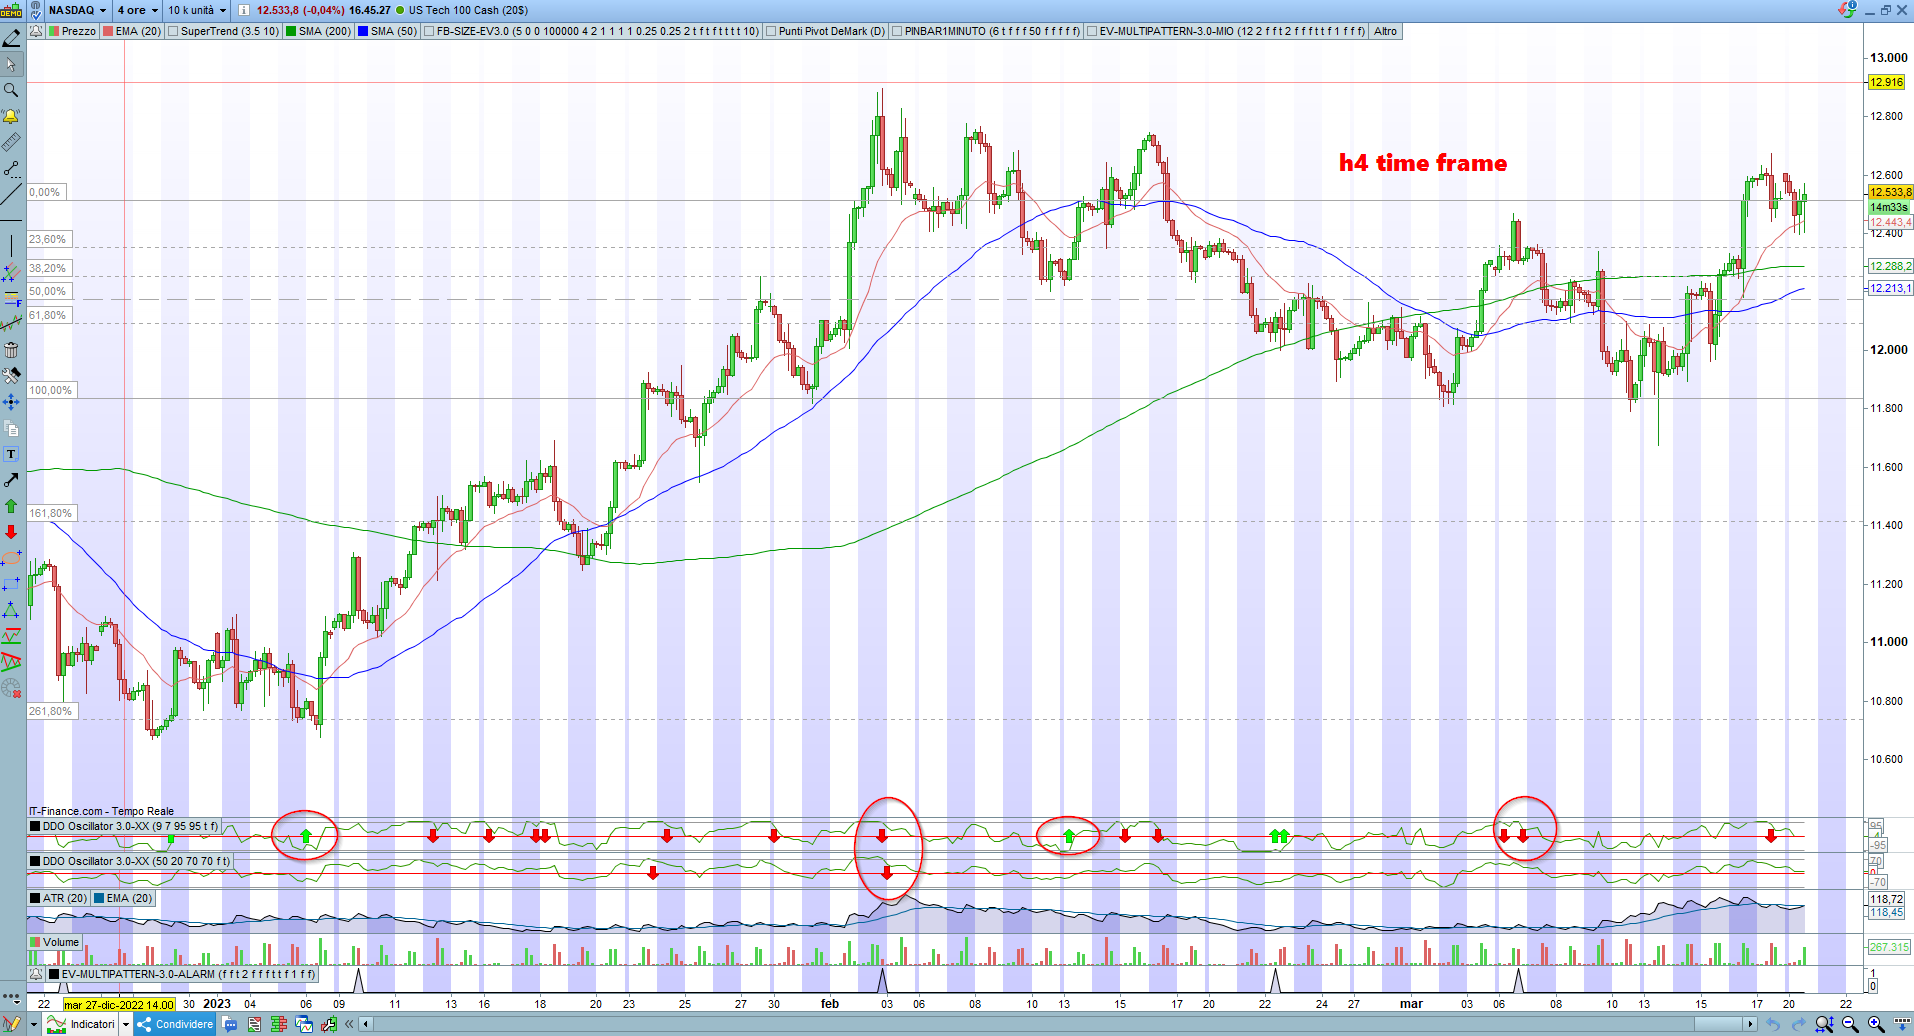
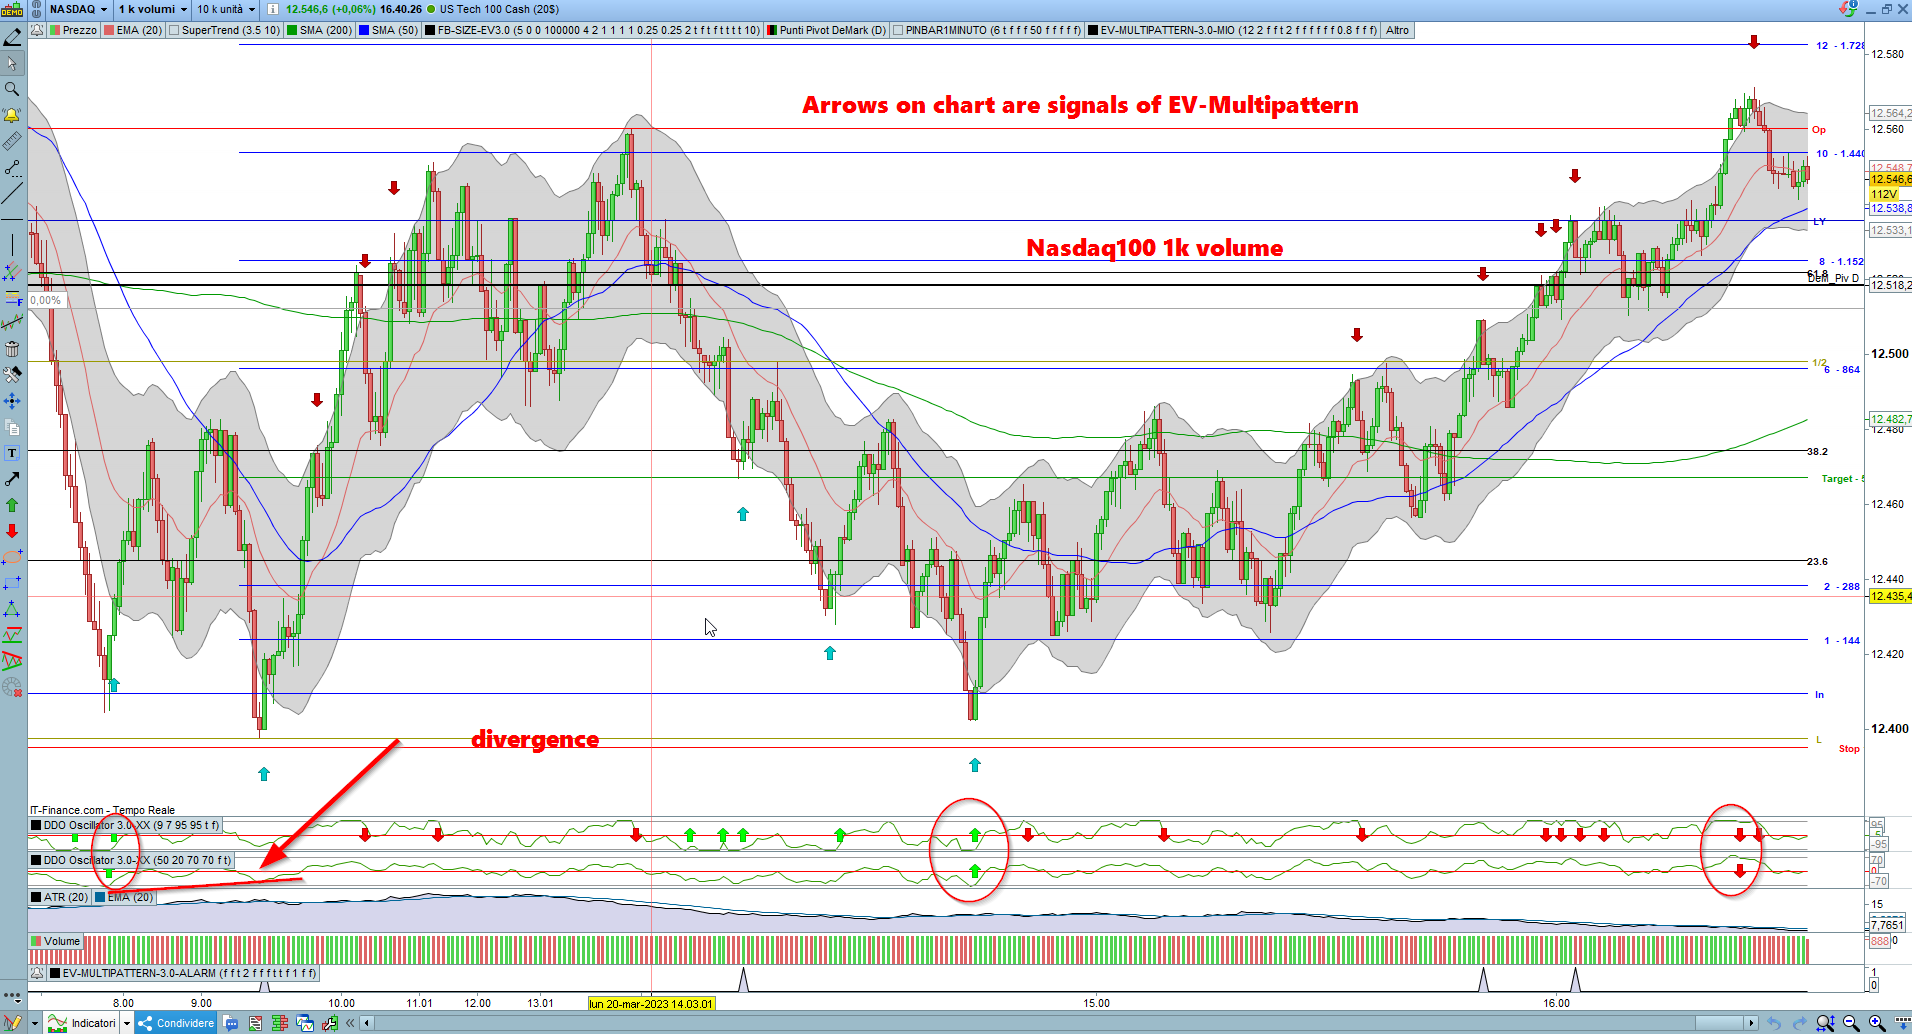
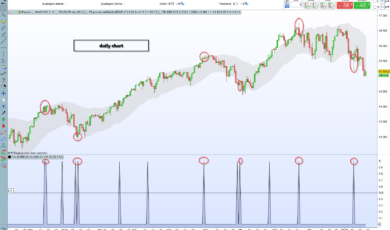
This oscillator is based on measuring the difference between bullish strength and bearish strength. It has 2 adjustable overbought and oversold bands. The signal is highlighted by an arrow. If the signal turns out to be a false signal, a divergence can be expected. The default setting is 50-20-70 and -70 but the user can experiment with various settings depending on his operation and the signals that the oscillator returns that the user considers valid. For example for a scalping operation you can use the setting 9-7-95 and -95.
The oscillator is usable on all time frames.
The user can set the average used for the calculation and choose between ema or Wilder’s average.
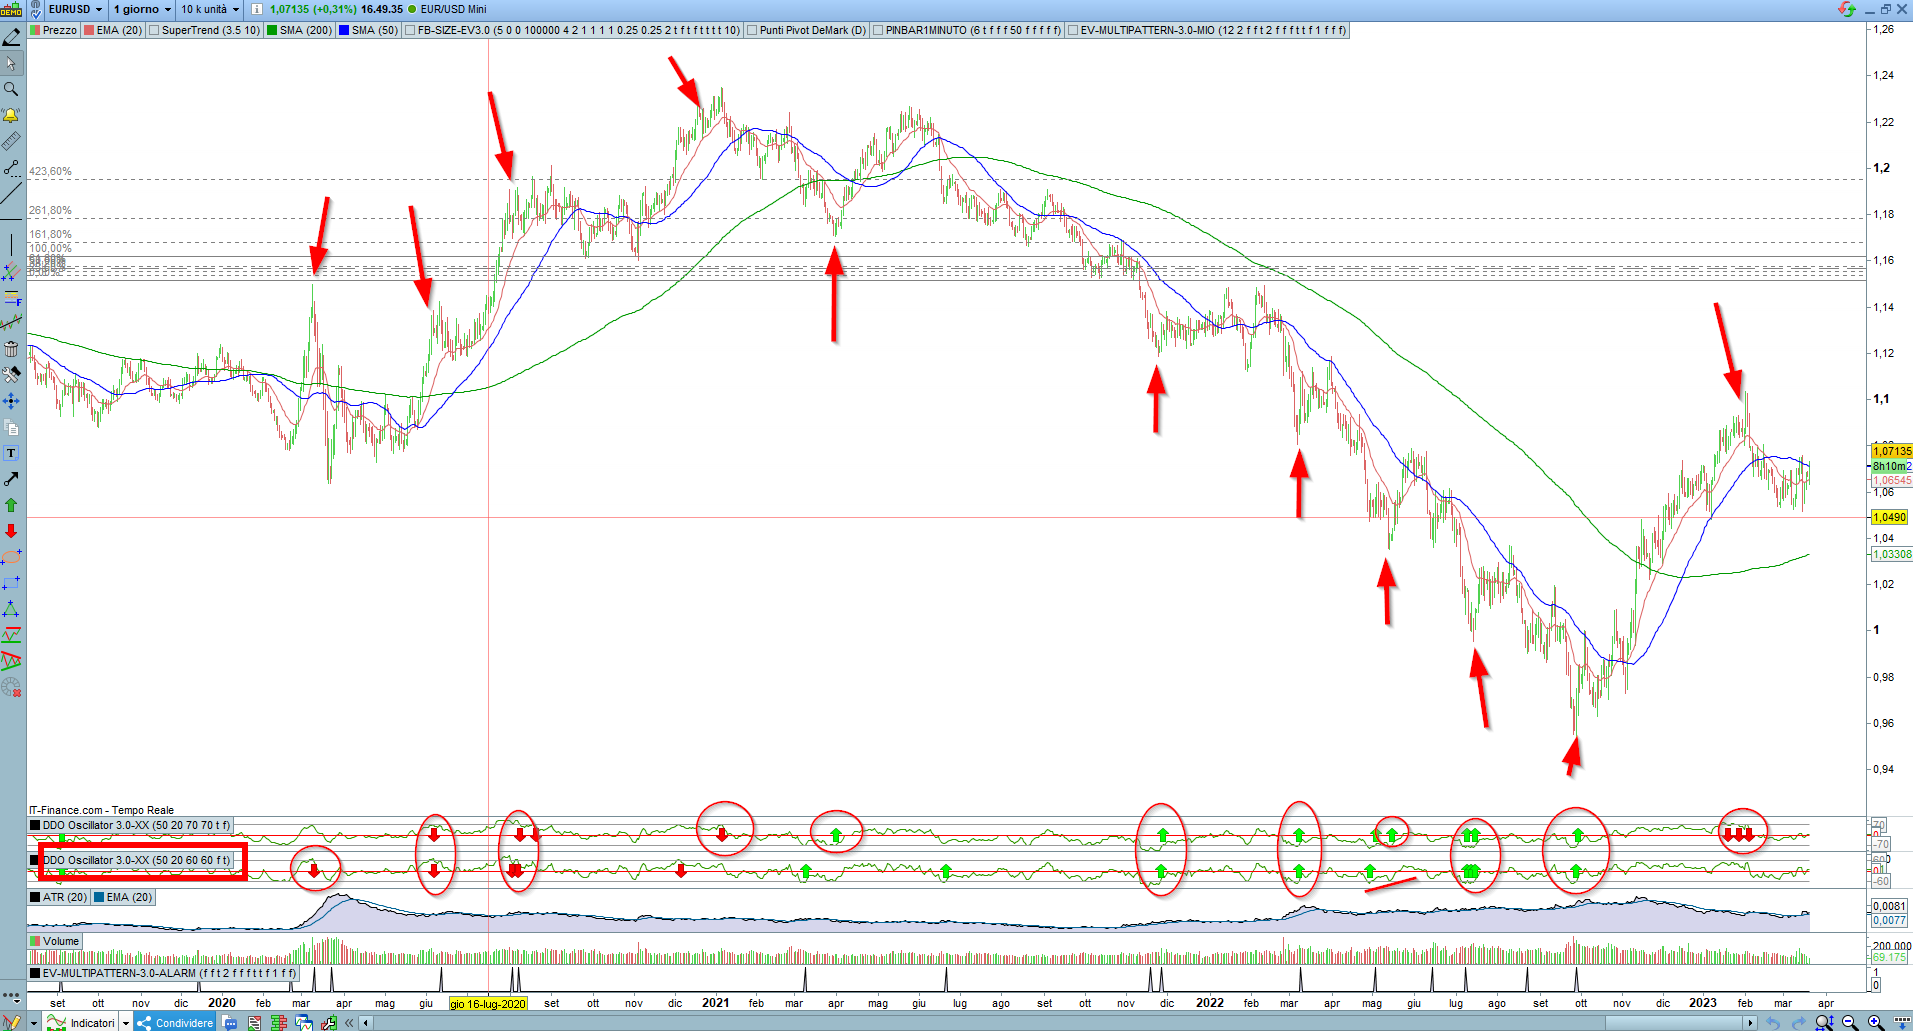
The simultaneous use of 2 DDOs is interesting, one set with ema and the other set with Wilder’s mean. Thus the signals that appear simultaneously on both oscillators become interesting and the divergences become more visible.
Parameter settings
Historical – History on which the oscillator calculates
Period – period of the moving average
OversoldLevel – oversold level
OverboughtLevel – overbought level
Wildma – the moving average for the calculation is the Wilder mean
EMA – the moving average for the calculation is the exponential average
Signals – the signal is highlighted by an arrow
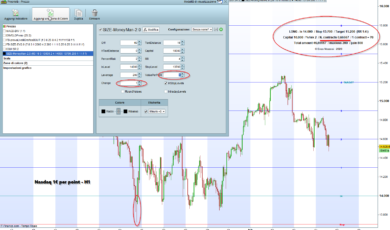
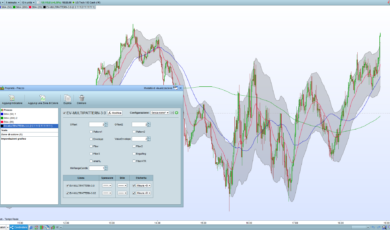
See the pictures for a better understanding of using the oscillator


Reviews
There are no reviews yet.