
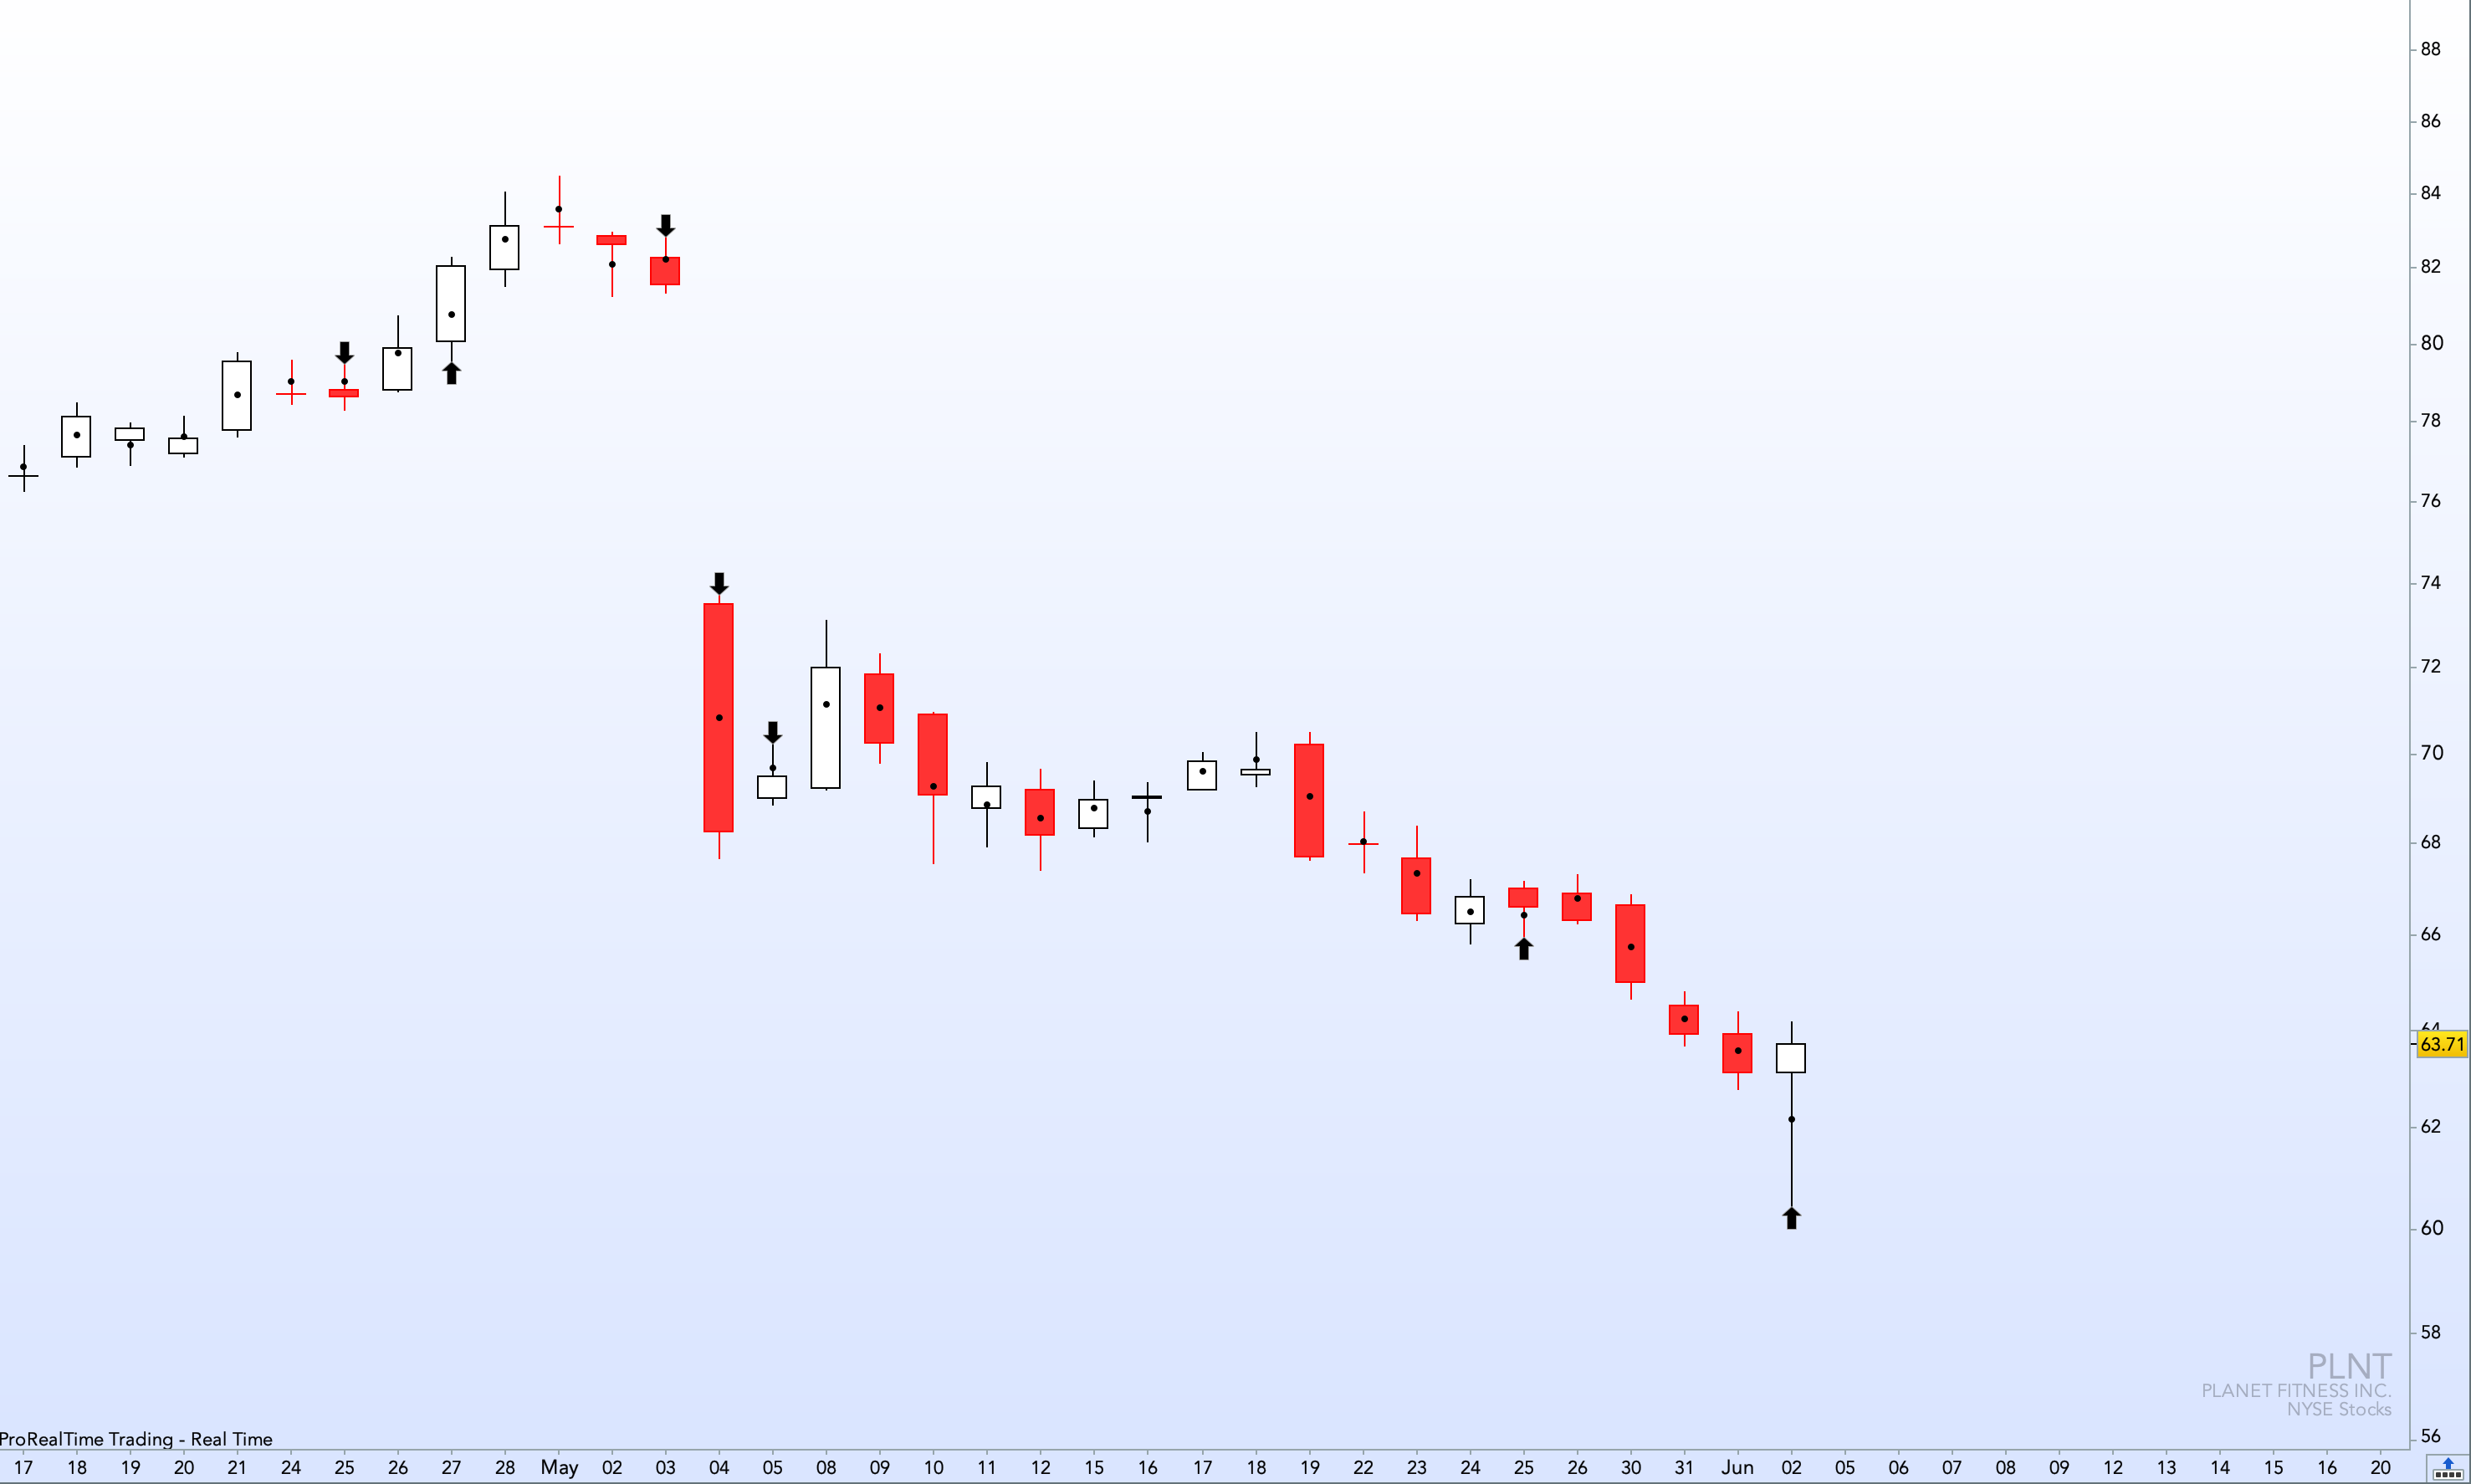
The Day Type blueprints indicator is designed to help you identify and execute entries for single sessions that are statistically important in the market.
These blueprints are designed to help you find high probability opportunities in any market and in any timeframe, and come with specific guidelines for executing and building positions.
Thoroughly understanding these blueprints will give you the power to confidently execute trades in any market when the opportunity strikes.
Day type blueprints explained:
· WICK: The Wick Rejection Day is a significant day type that tends to precede powerful reversals. Absorption days typically follow this day type, which fuel the developing reversal.
· OUTSIDE: The Outside Day is a day type that powerfully illustrates rejection, stop runs, and shakeouts. This is a significant day type that oftentimes precedes a strong reversal.
· STOPRUN: The Stop Run Day is an aggressive trend day that can lead to some of the most powerful days in the market. Absorption days help fuel these days.
· FAILED NEW LOW/HIGH : The Failed New Low or High day types can both trigger reversals and be part of continuation patterns. These day types are usually traps to generate more fuel.for the existing trend.
· ABSORPTION : The Absorption Day is typically a range bound day that is designed to facilitate trade between market participants. This day type fuels the forthcoming move.
All these blueprints can be bullish or bearish deepening on the candle/price configuration.
The indicator can be plot on any timeframe (preferably on the 1-hour up to daily timeframe to spot the best swing opportunities).
Plotted on a weekly timeframe, it might become interesting for position trading opportunities.
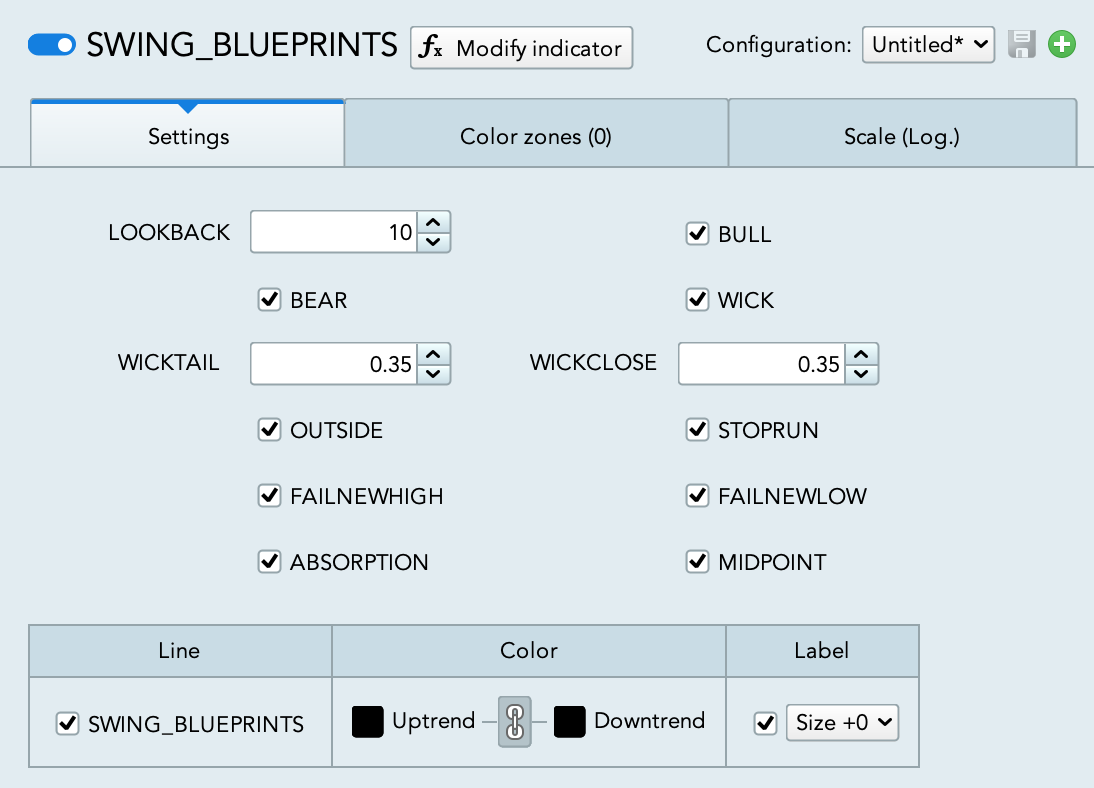
Configuration settings:
- BULL: plot bullish blueprints on chart
- BEAR: plot bearish blueprints on chart
- WICK: plot Wick Rejection Day on chart
- WICKTAIL: referred to WICK blueprint, it is set by default to 2.5 meaning that the upper or lower shadow is 2.5x the body size of the candle
- WICKCLOSE: referred to WICK blueprint, it is set by default to 0.35 meaning that the close falls in the upper or lower 65% of the candle range
- OUTSIDE: plot Outside Day on chart
- STOPRUN: plot Stoprun Day on chart
- FAILNEWHIGH: plot Failed New High Day on chart
- FAILNEWLOW: plot Failed New Low Day on chart
- ABSORPTION: plot Absorption Day on chart
- MIDPOINT: plot the Midpoint (50% of the range) of each candle on the chart
The knowledge basis to develop the Day Type blueprints indicator is taken from the “Swing Trade Pro 2.0″ course by Frank Ochoa.

Valoraciones
No hay valoraciones aún.