
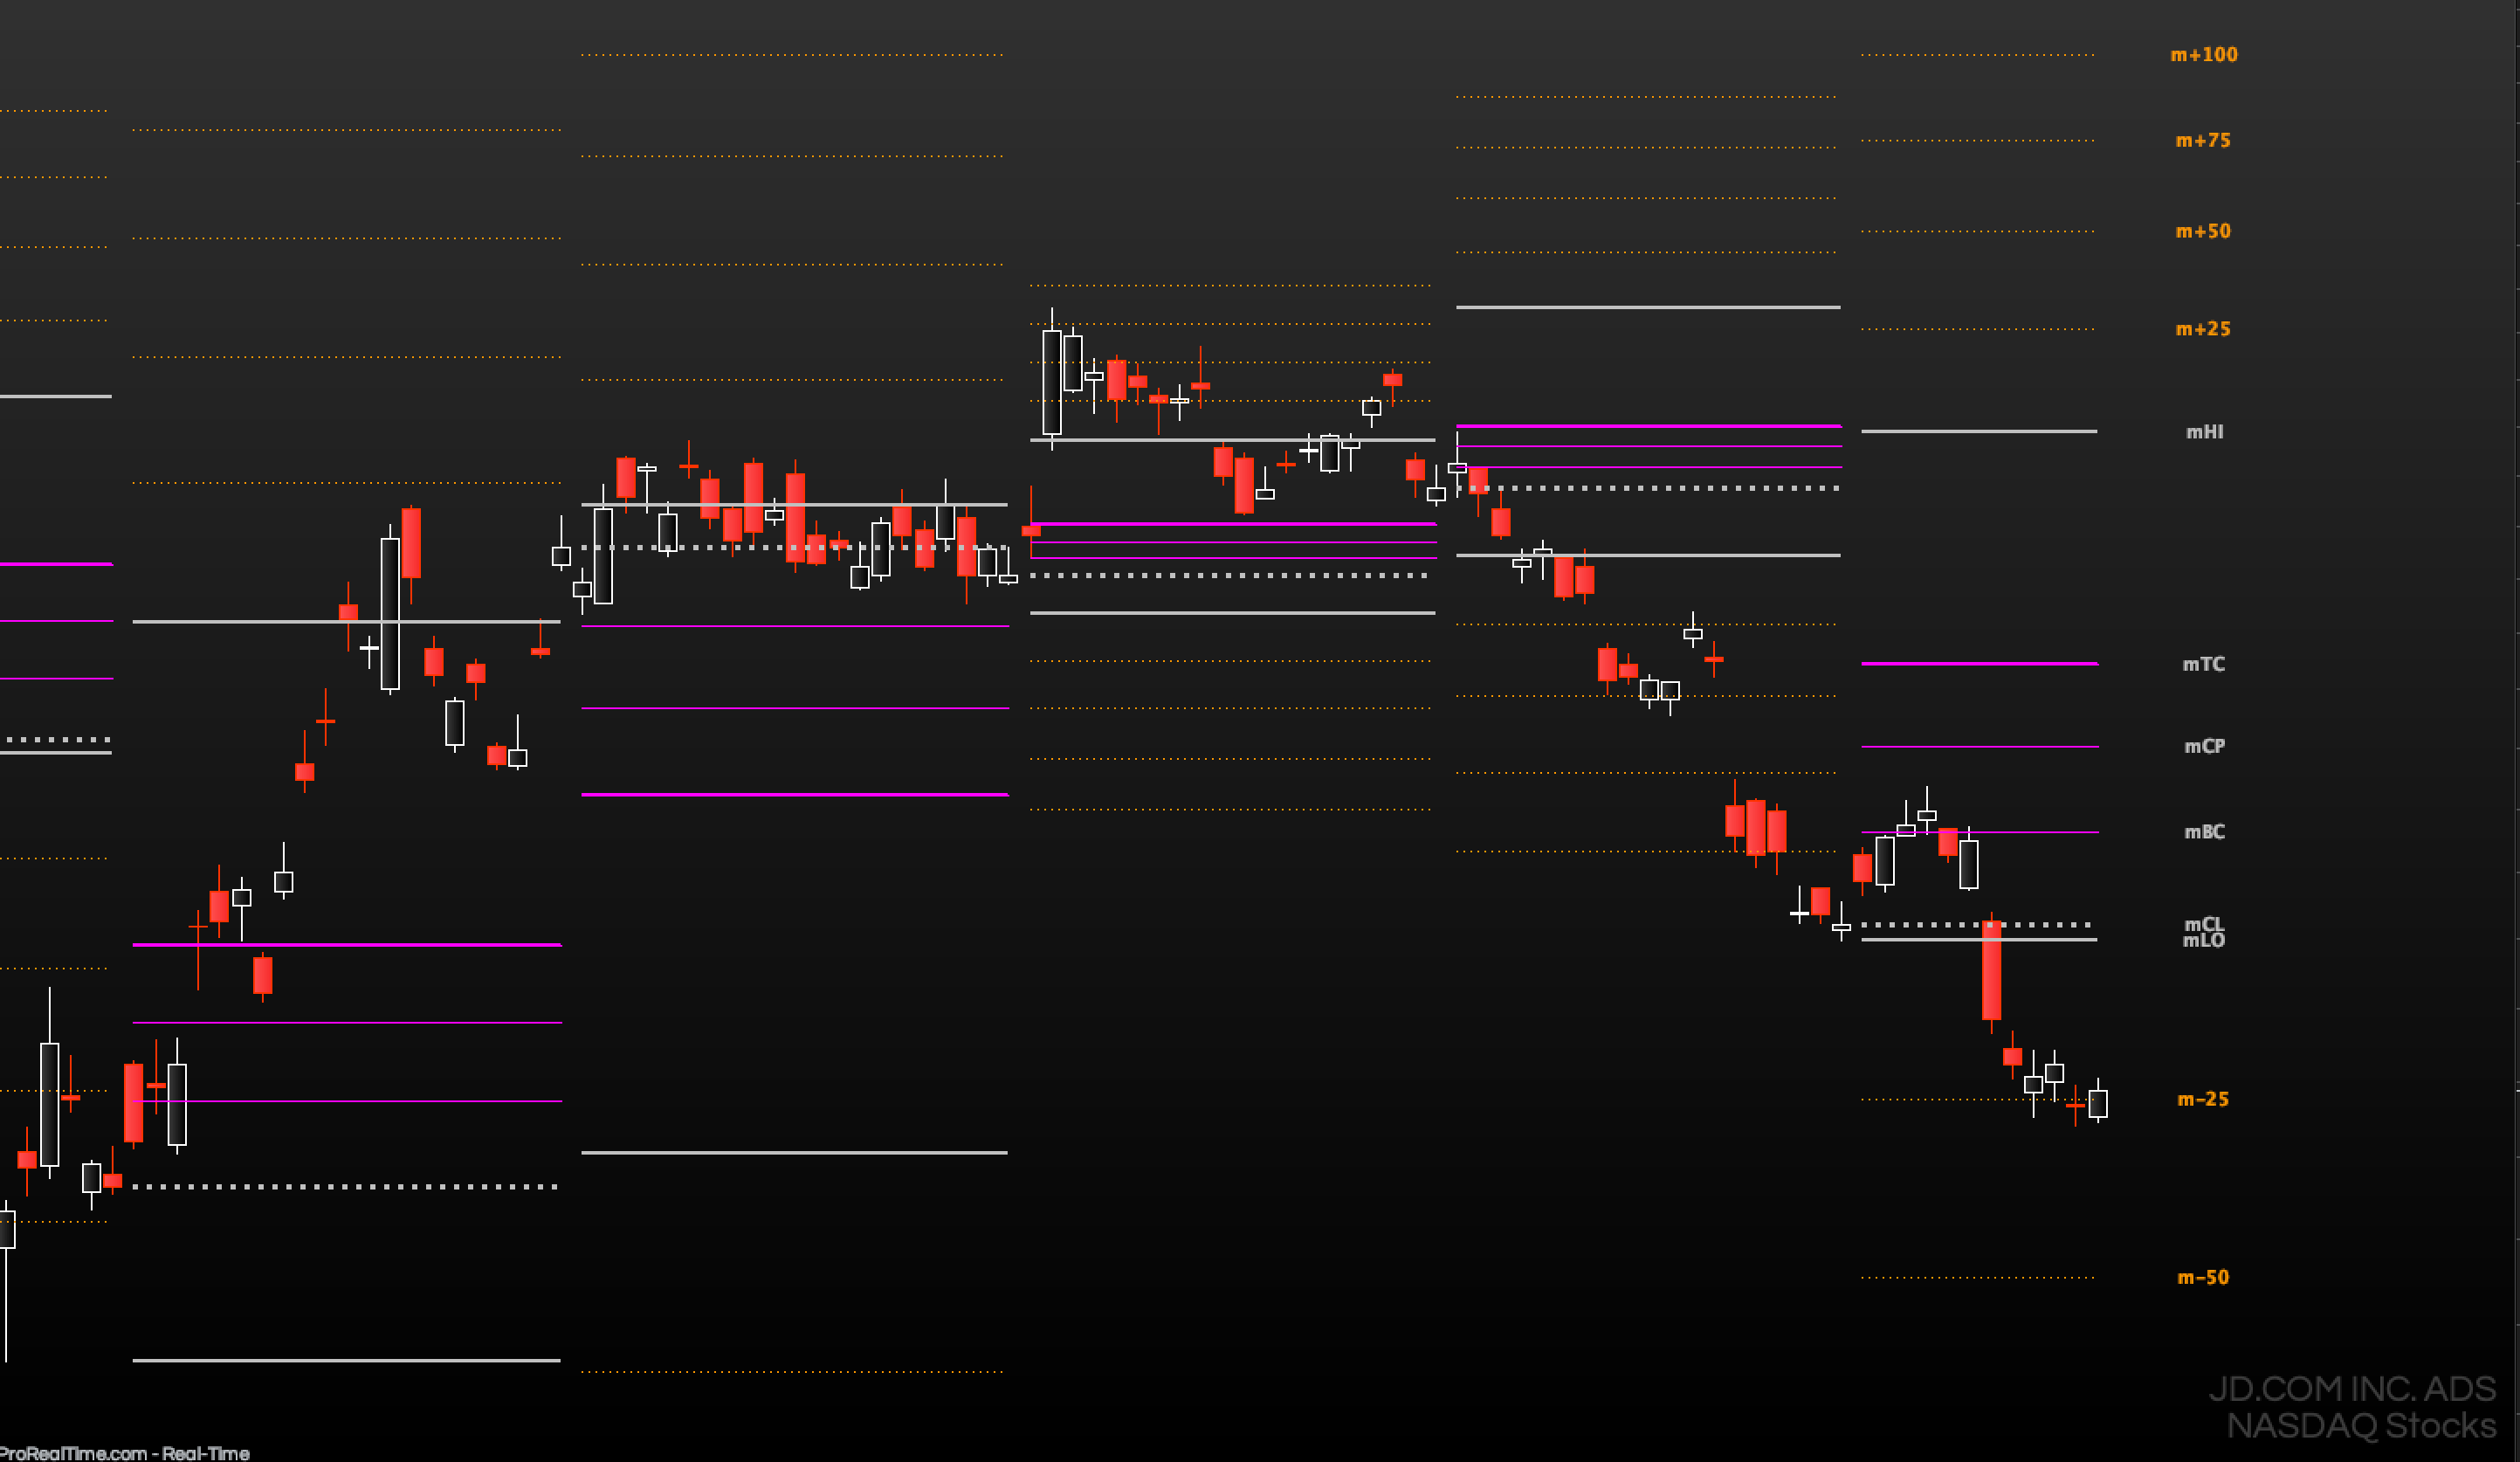
The Central Pivot Range indicator plots a value area that is calculated based on data from the previous session:
(High, Low and Close from the daily/weekly/monthly/quarterly or yearly range).
Additional key levels are available with this indicator, such as:
- Previous range High/Low/Close
- Previous range extensions
- Floor Pivots
- Camarilla Pivots
- The above mentioned levels are also plot-able for the upcoming session to better prepare your trading plan
The CPR shows purely price-based and market generated information. It helps identifying value, overbought and oversold conditions. It is a leading zero-lag indicator. It is very versatile for day, swing and position traders. These pivots work on every chart and are perfect for stocks, futures and ETFs trading.
CPR helps to forecast price direction, volatility expectation, analyse the current trend and combine multiple timeframes for powerful confluence analysis.
In detail:
CPR is composed by three lines showing respectively:
– CP: Central Pivot (High+Low+Close / 3)
– BP: Bottom Pivot (High+Low / 2)
– TP: Top Pivot (CP – BP) + CP
The three levels compose the CPR which gets updated every day/week/month/quarter/year at the beginning of the first session of the period.
Depending on your personal trading style, you might want to utilise the CPR as following:
– Day trading: daily CPR on 1 to 15 min chart
– Swing trading: weekly CPR on 15 min to 1 hour chart
– Position trading: monthly and/or quarterly CPR on daily chart
– Investing: quarterly and/or yearly CPR on weekly chart
Its methods of use and analysis can be clustered in two macro areas:
- 2-periods CPR relation: the relation between the CPR from two periods (days, weeks, months, quarters or years) helps as developing a directional bias for the upcoming session:
- HIGHER relation (LONG bias): the CPR of the current period is above the CPR of the previous period (BP > prev TP). This is the most bullish relation. The CLOSE of the previous period should be above the current TP level to enhance the LONG bias in the upcoming session. In addition, the OPEN of the current session should also be above the current TP level.
- LOWER relation (SHORT bias): the CPR of the current period is beneath the CPR of the previous period (TP < prev BP). This is the most bearish relation. The CLOSE of the previous period should be below the current BP level to enhance the SHORT bias in the upcoming session. In addition, the OPEN of the current session should also be below the current BP level.
- INSIDE relation (BREAKOUT bias): the CPR of the current period is included within the CPR of the previous period (TP < prev TP and BP > prev BP). This indicates volatility increase and potential breakout of previous HIGH or LOW in the upcoming session.
- OUTSIDE relation (RANGE BOUNDED bias): the CPR of the current period includes the CPR of the previous period (TP > prev TP and BP < prev BP). This indicates sideways or trading range in the upcoming session.
- CPR width: the width of the current CPR helps as developing a directional bias for the upcoming session.
More specifically, if the market experienced a wide range of movement in the prior session, the pivots for the following session will likely be wider than normal, which usually leads to a sideways or trading range day. Conversely, if the market experiences a very quiet trading day in the prior session, the pivots for the following day are likely to be unusually tight, or narrow, which typically leads to a more expanded trend or breakout Day
The CPR concepts have been taken from the book “Secrets of a Pivot Boss” by Frank Ochoa and made available on PRT through proprietary coding.
Please feel free to get in contact with me to deepen the trading methods behind its usage.

Valoraciones
No hay valoraciones aún.