How the “Day Action Strategy” works
This strategy is designed as a mid-term strategy for timeframe 15 minutes and is based on the previous day’s candles and their main points. The rules for determining a long/short position are based on entry/exit/pivot points and rules for determining the trend based on previous highs/lows. By the way, with the option to adjust the strategy parameters, it could also be used in other time frames or run multiple time frames in one asset.
When developing the strategy, the main goals were a flexible algorithm and an efficient and convenient option for automated trading:
- best results were at several stock index!
- runnable at forex and commodities also
- maximum of probability
- efficiency with minimum drawdown
- reaction to changes in the market
- scaleable strategy
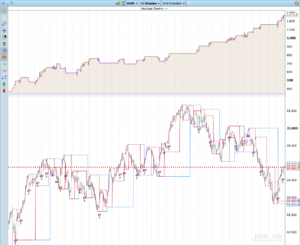
Some statistics and backtest
The initial capital set for the backtest was the minimum lot size for the asset – this shows you the real performance when running this strategy even with a small account.
Initial capital: 340 Eur / Runtime: about 8 month: / Performance: 267 %
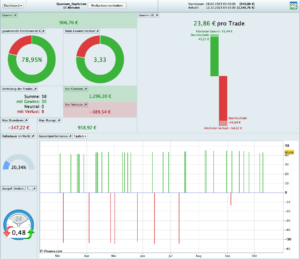
A balanced ratio between the number of positions, probability and drawdown makes this strategy efficient:
Detailed statistics for long/short positions and drawdown ratio:
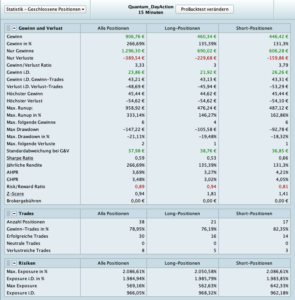
The performance was clearly positive every month – of course it could also be negative for a month:
How to adjust the strategy – Your Advantages!
The extended adjustment options make the strategy very comfortable, flexible for your own trading style and offers many advantages:
Possibility of reaction
Even if a strategy has worked for a long time, a change in the market can cause it loose. To protect your capital, adjust the strategy every 2 to 3 months to respond to new market situations, new trends and volatility
Adjust the trend based on asset
Optimize “Channel and Trade” (channel = trend, trade = movement within the trend) that describe the number of candles to determine the trend. This option allows you to tailor the strategy to the asset you want to execute – also as a way to execute different time frames on an asset to diversify your trading. Of course, not every asset is suitable for this. Tweak the values, run a backtest and look for combinations that suit you
Risk management
For each trade-position, define the “Risk” you are comfortable with in percent of the base value (in this backtest example 0.8 %)
Define your reward
Define the “WinRatio” for the trades as a ratio to the given risk , for example 1.0 at 0.8% risk means the same “take profit” at 0.8% etc. By the way, this also depends on the probability that you choose with the “Channel and Trade” adjustment. If the probability is high, you should choose a lower “WinRatio” to achieve good performance as well
Ability to scale-up your cash-cows
The “Position” size of a lot (CFD lot size) is the ability to expand the strategy for high-performing assets or even if you want to run a larger account
Backtest the strategy before RUN !
Technical overview of the strategy backtest
Broker : IG
Share: CFD
Risk: 0.8 %
WinRatio: 1:1
Timeframe : 15 Minutes
Stock Index : WallStreet (1E)
Terms and Conditions
Please note our general terms and conditions.
These are accepted by you when purchasing our products






Valoraciones
No hay valoraciones aún.