Original price was: 299€.Current price is: 149€.
Compatible con

Favoritos:2   Vistas:403   Reseñas:0  

BountyHunter plots a probability channel computed from historical price action.

Category:
Report Abuse


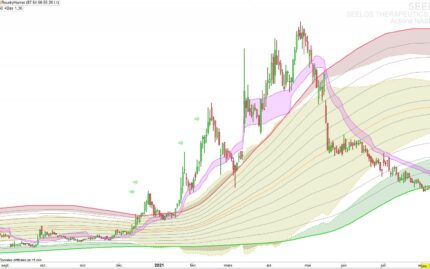
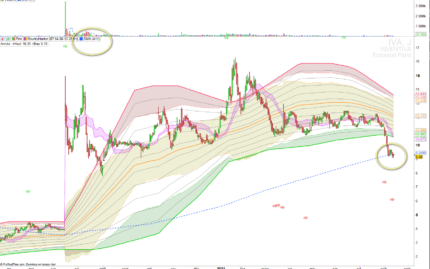
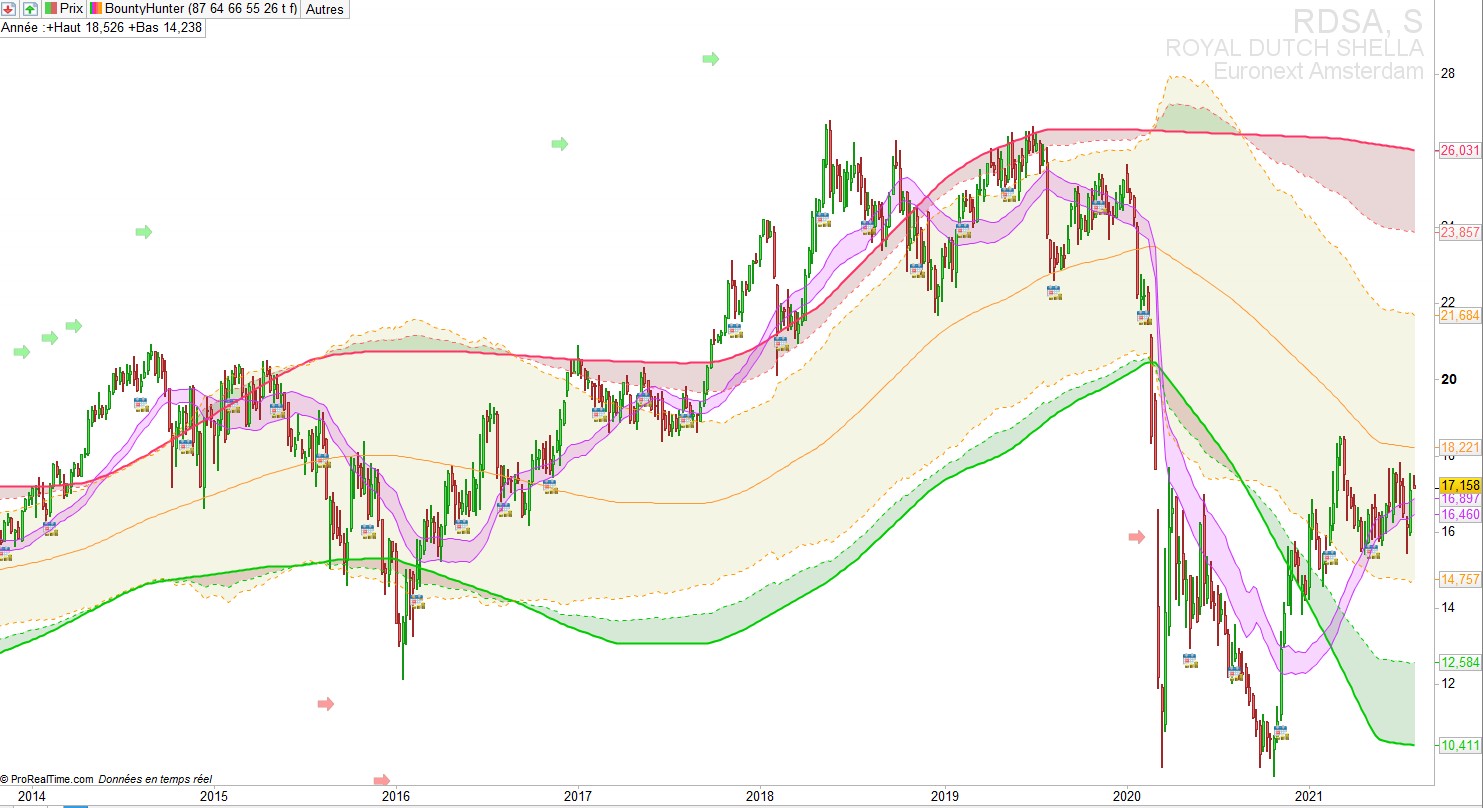
BountyHunter plots a probability channel divided into colored stripes,

green sripe is a dynamic support, red stripe is a dynamic resistance, orange stripe is the balance zone .

It uses a mix of algorythms to achieve its purpose.

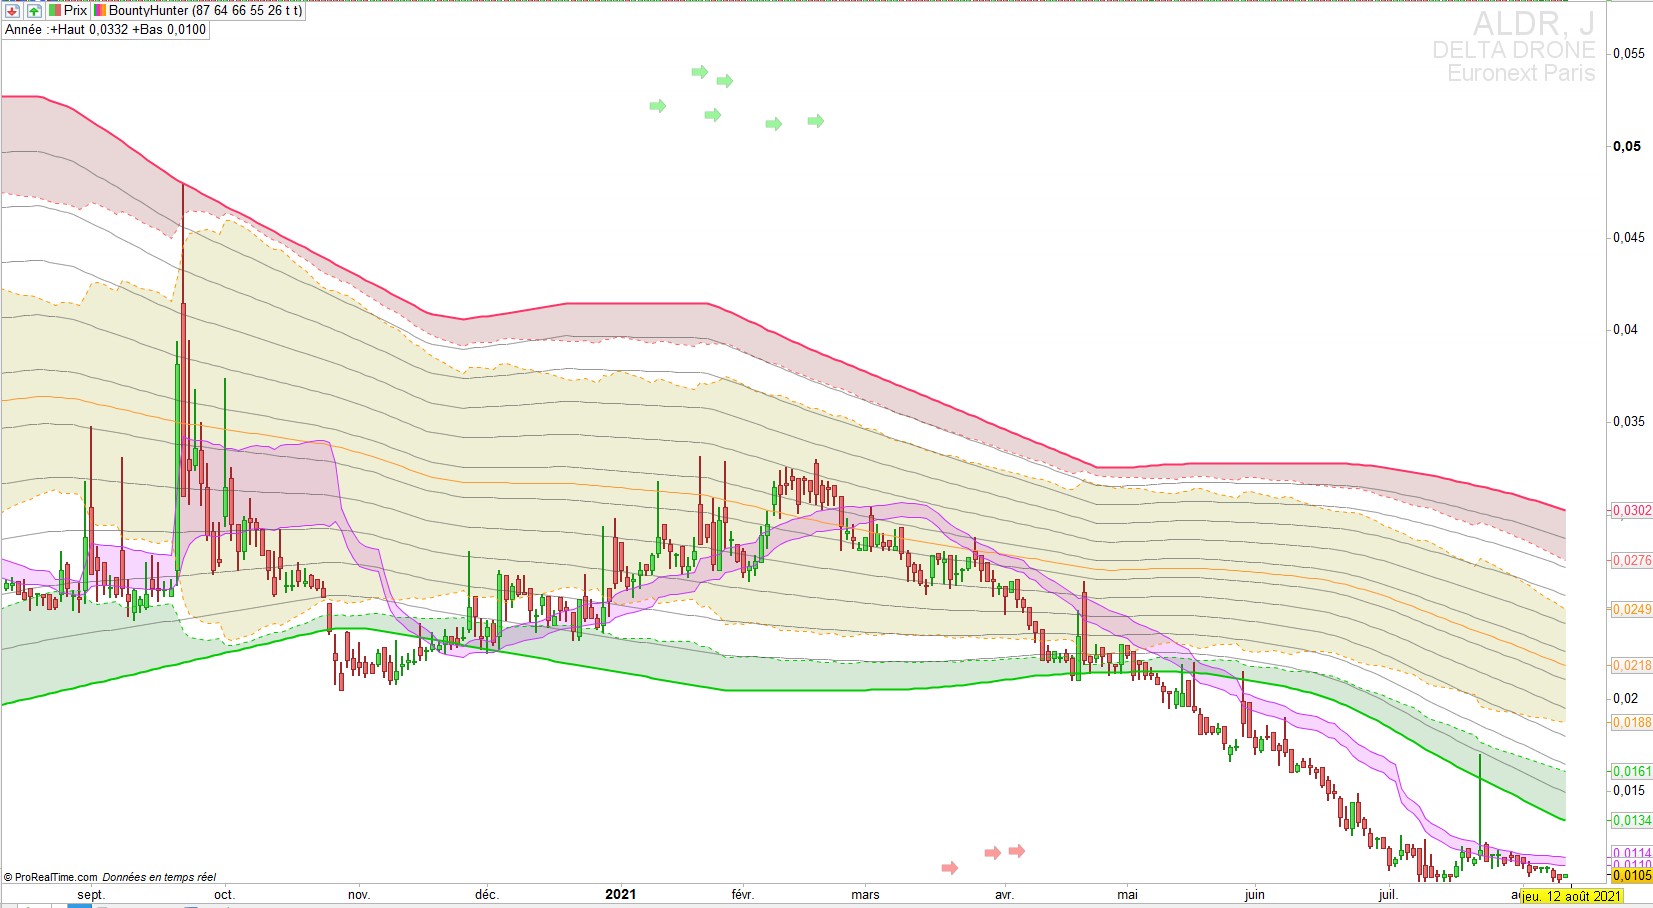
The purple “snake” shows the equilibrium of the price compared to the flowing volume of exchange, it’s like a vwap but continuous. It shows short term polarity.

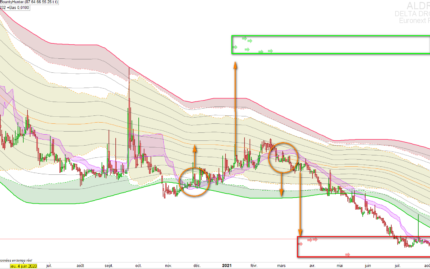
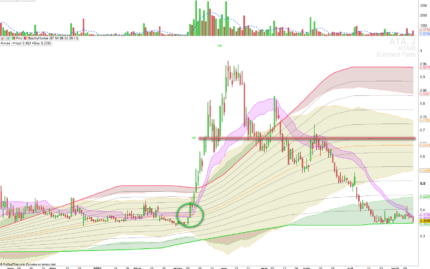
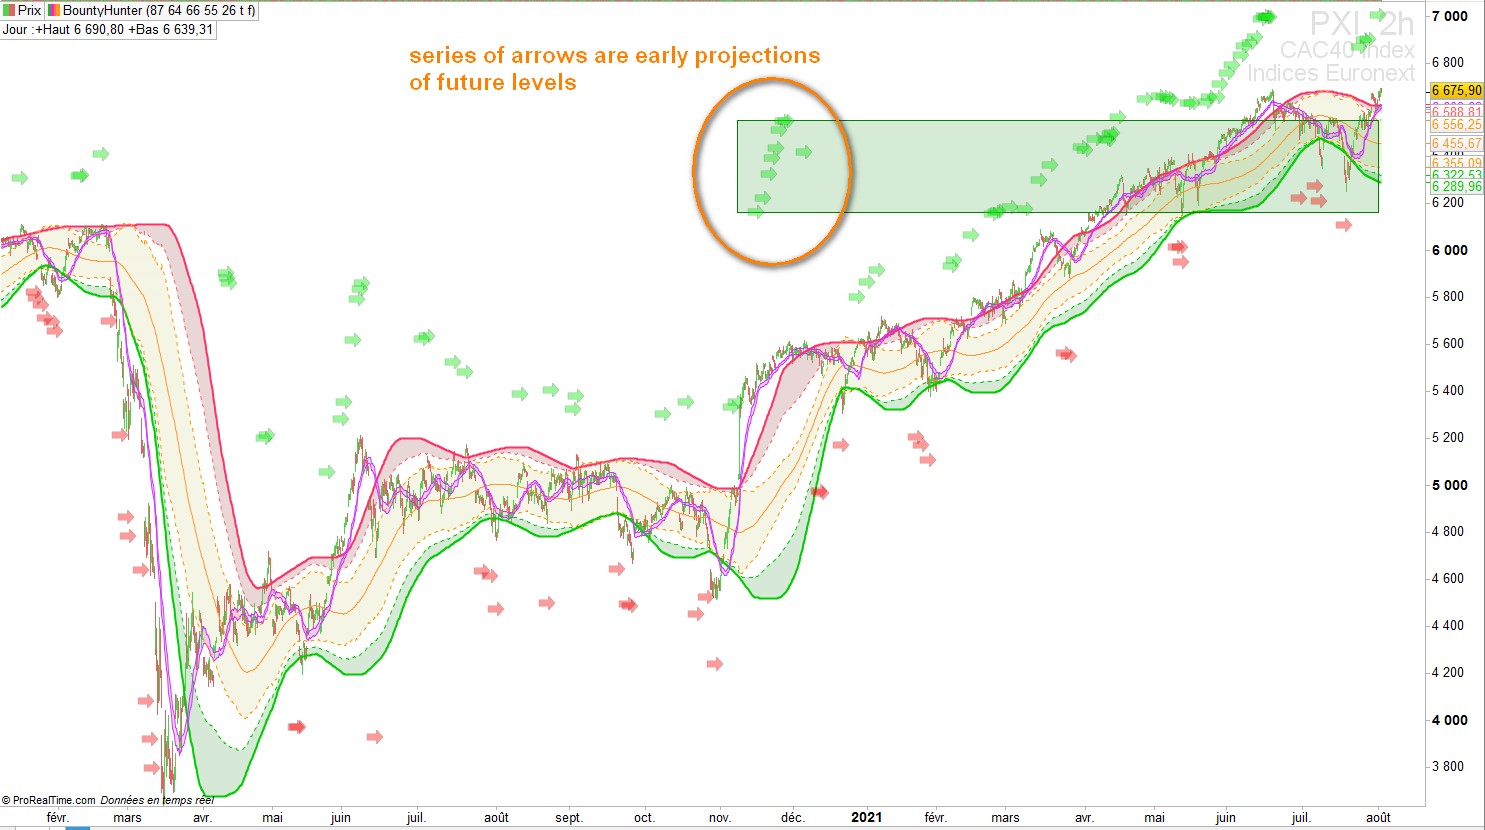
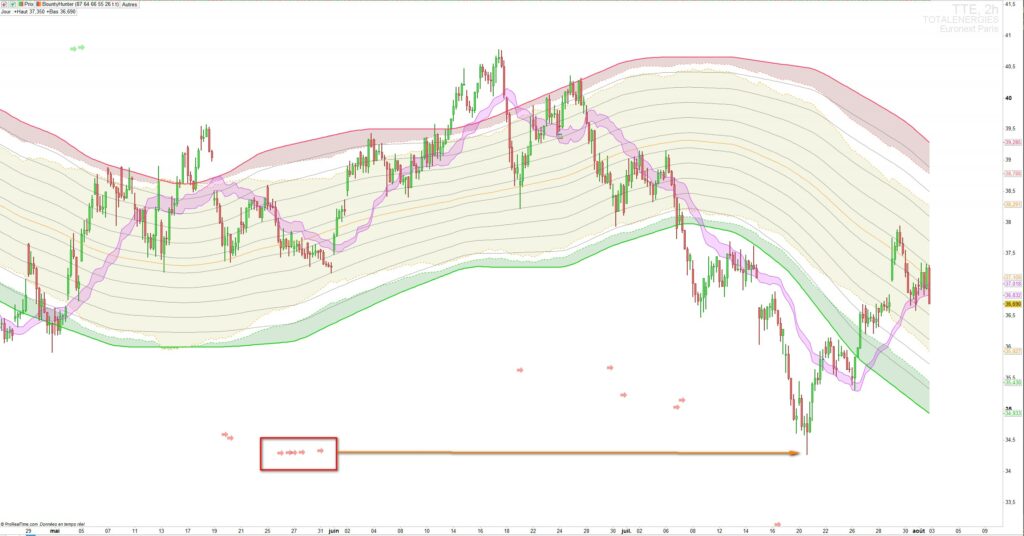
This indicator also shows likely targets when impulsions arise, by the means of green and red arrows , often it shows in advance where the price is going to consolidate or bounce.

Series of arrows at the same level show good overall prediction.

It is fully customizable appart from the color of the arrows (wich can be turned off)

Cac 40 index, 2h chart

Figure 1 : Cac 40 index in a 2 hours timeframe , shows likely targets in advance

Totalenergies 2h chart

Figure 2 : Totalenergies stock , 2 hours timeframe

Rdsa weekly chart

Figure 3 : Royal Dutch Shell A stock, weekly chart .


Delta Drone, daily chart

Figure 4 : Delta Drone, daily Chart, purple snake shows polarity

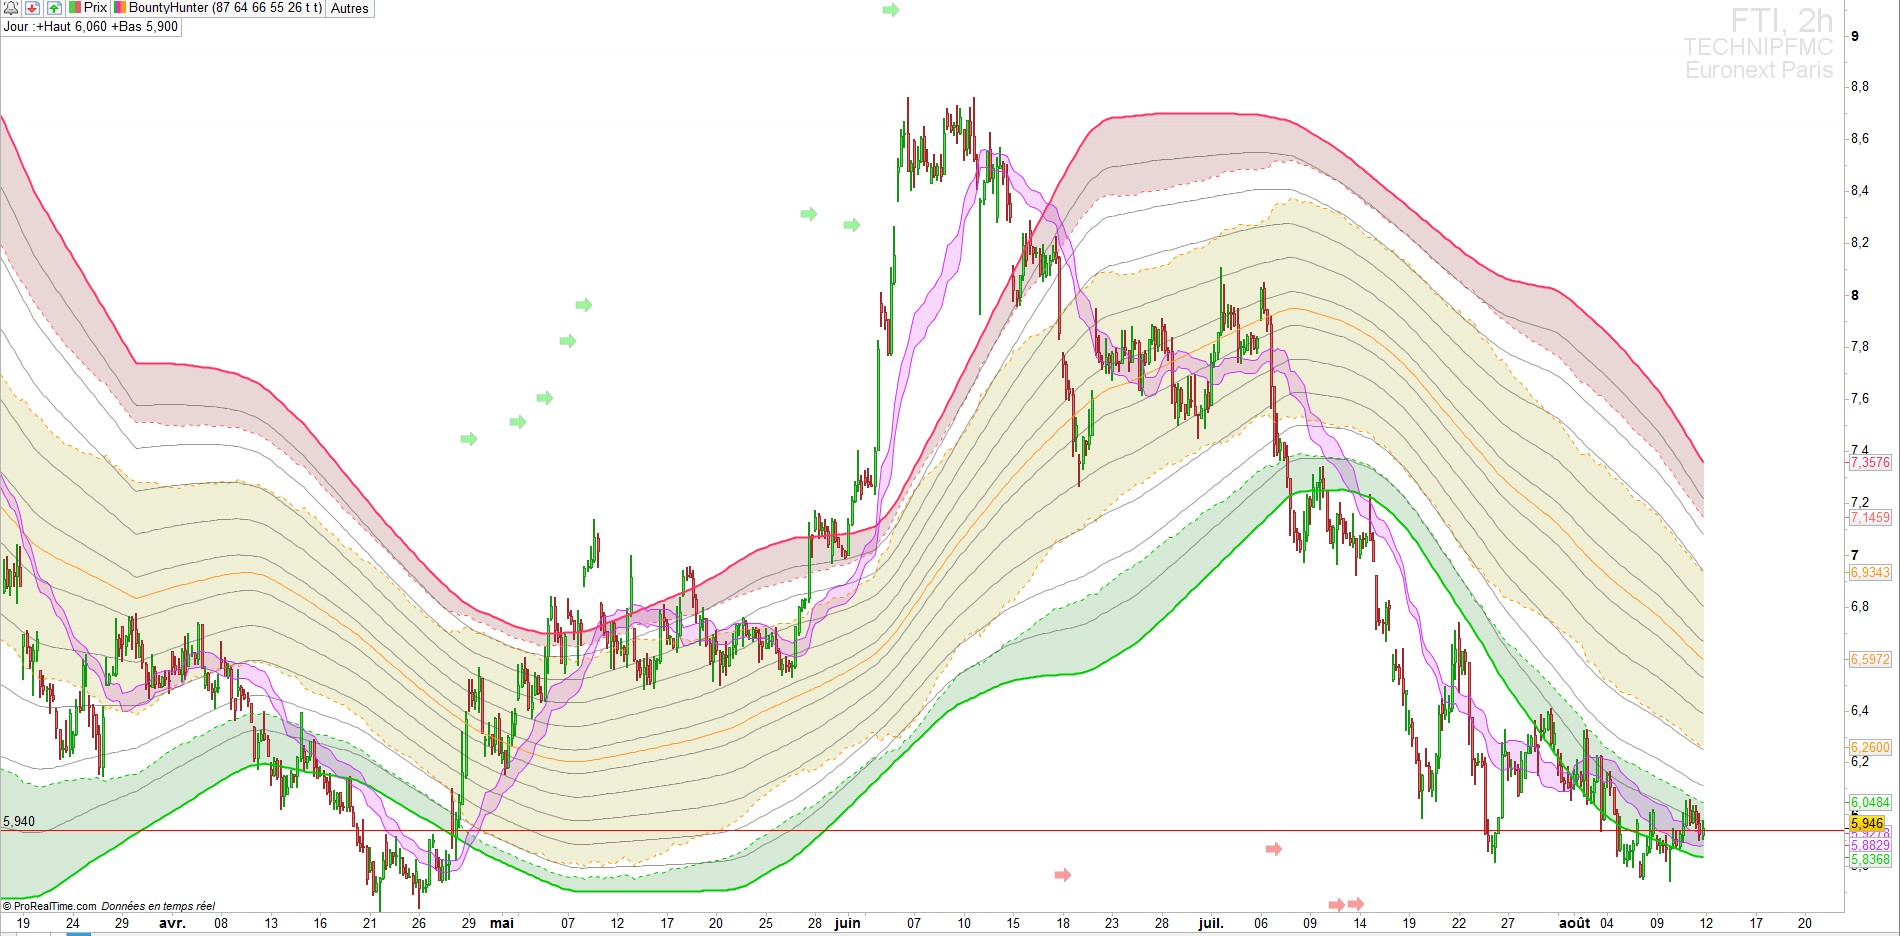
Figure 5 : TechnipFmc 2h chart

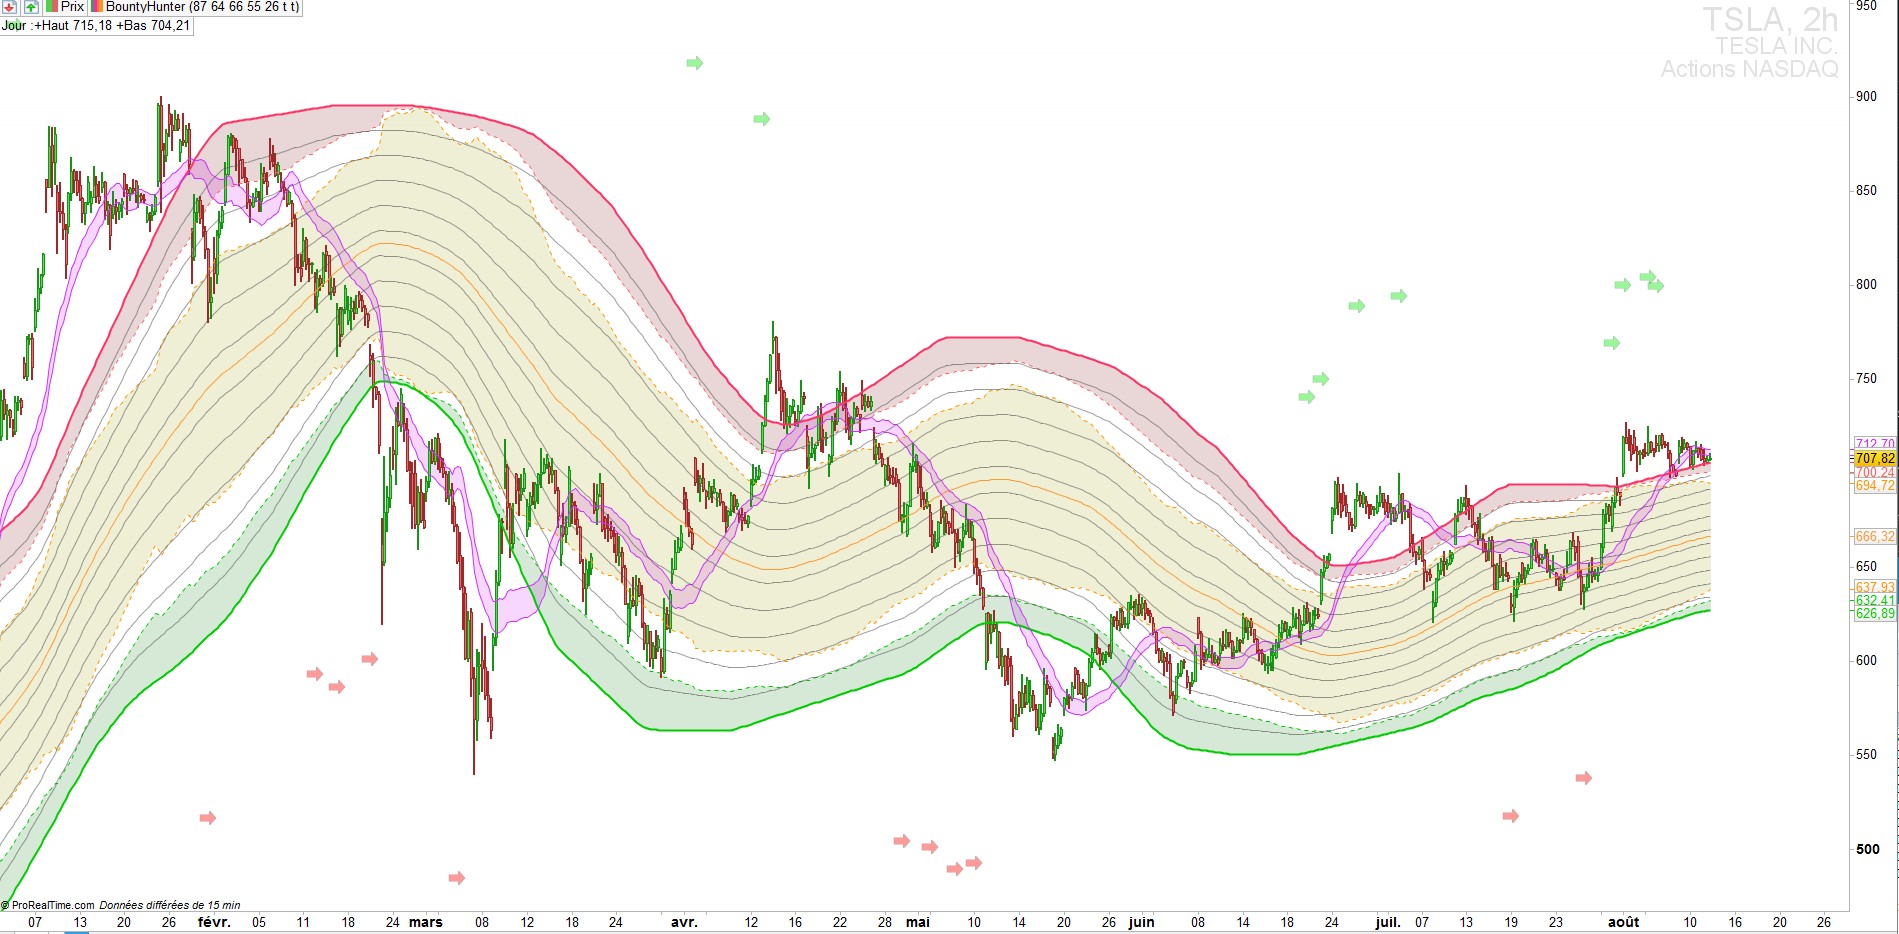
Figure 6 : Tesla 2h chart

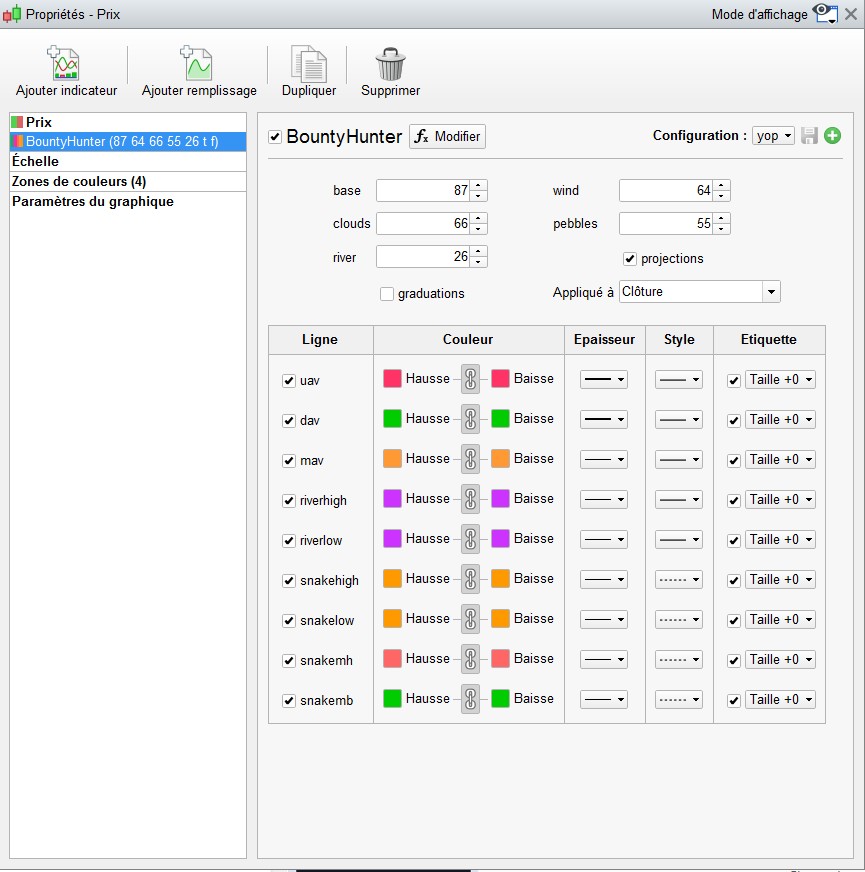
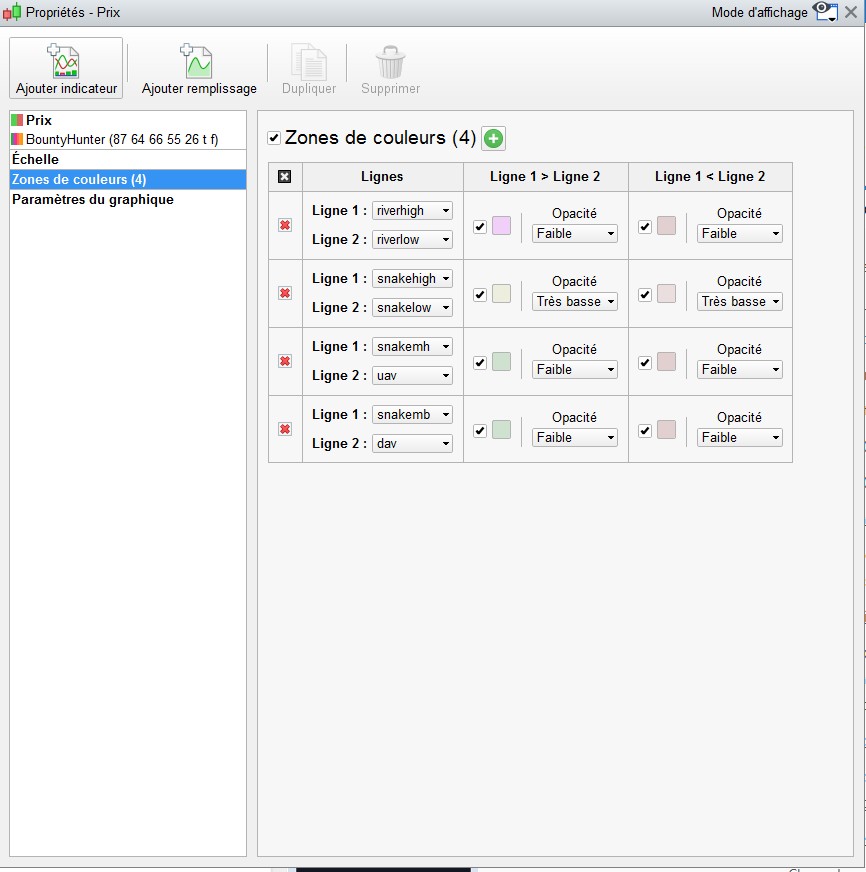
Configuration :

Valoraciones

No hay valoraciones aún.

Solo los usuarios registrados que hayan comprado este producto pueden hacer una valoración.

Solicitud de información

Your personal data will be used to support your experience throughout this website, to manage access to your account, and for other purposes described in our política de privacidad

¡Listo para unirse a nuestro mercado trading!
Además de 1,000,000 los clientes potenciales necesitan productos trading de calidad profesional
Únase a nosotros hoy mismo