

BountyHunter plots a probability channel divided into colored stripes,
green sripe is a dynamic support, red stripe is a dynamic resistance, orange stripe is the balance zone .
It uses a mix of algorythms to achieve its purpose.
The purple “snake” shows the equilibrium of the price compared to the flowing volume of exchange, it’s like a vwap but continuous. It shows short term polarity.
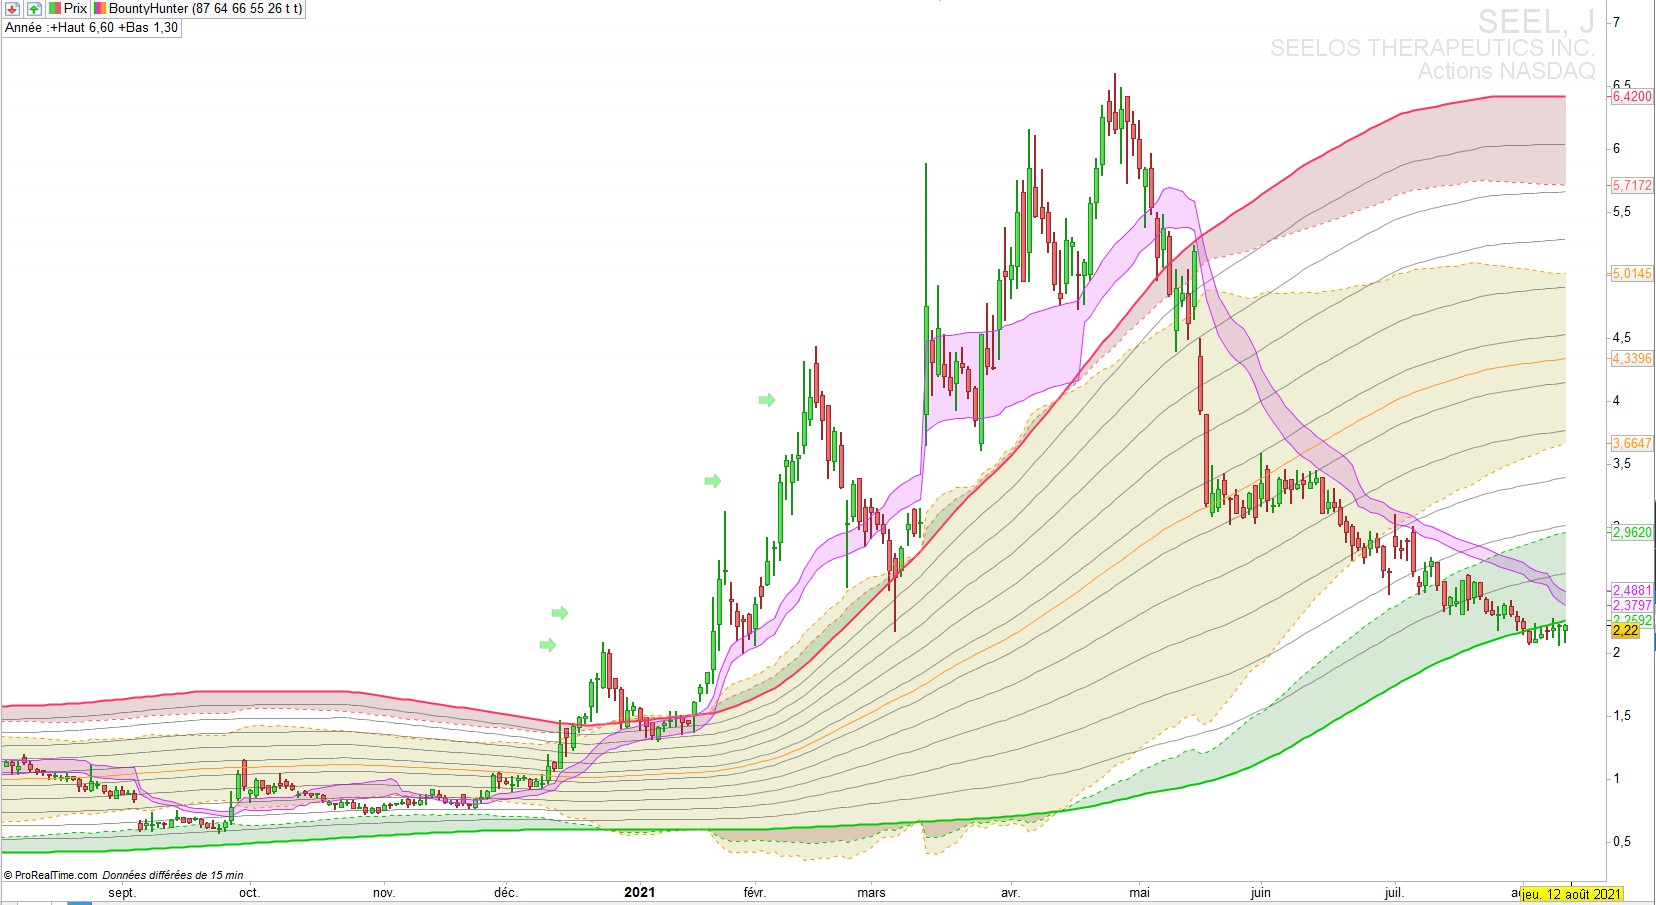
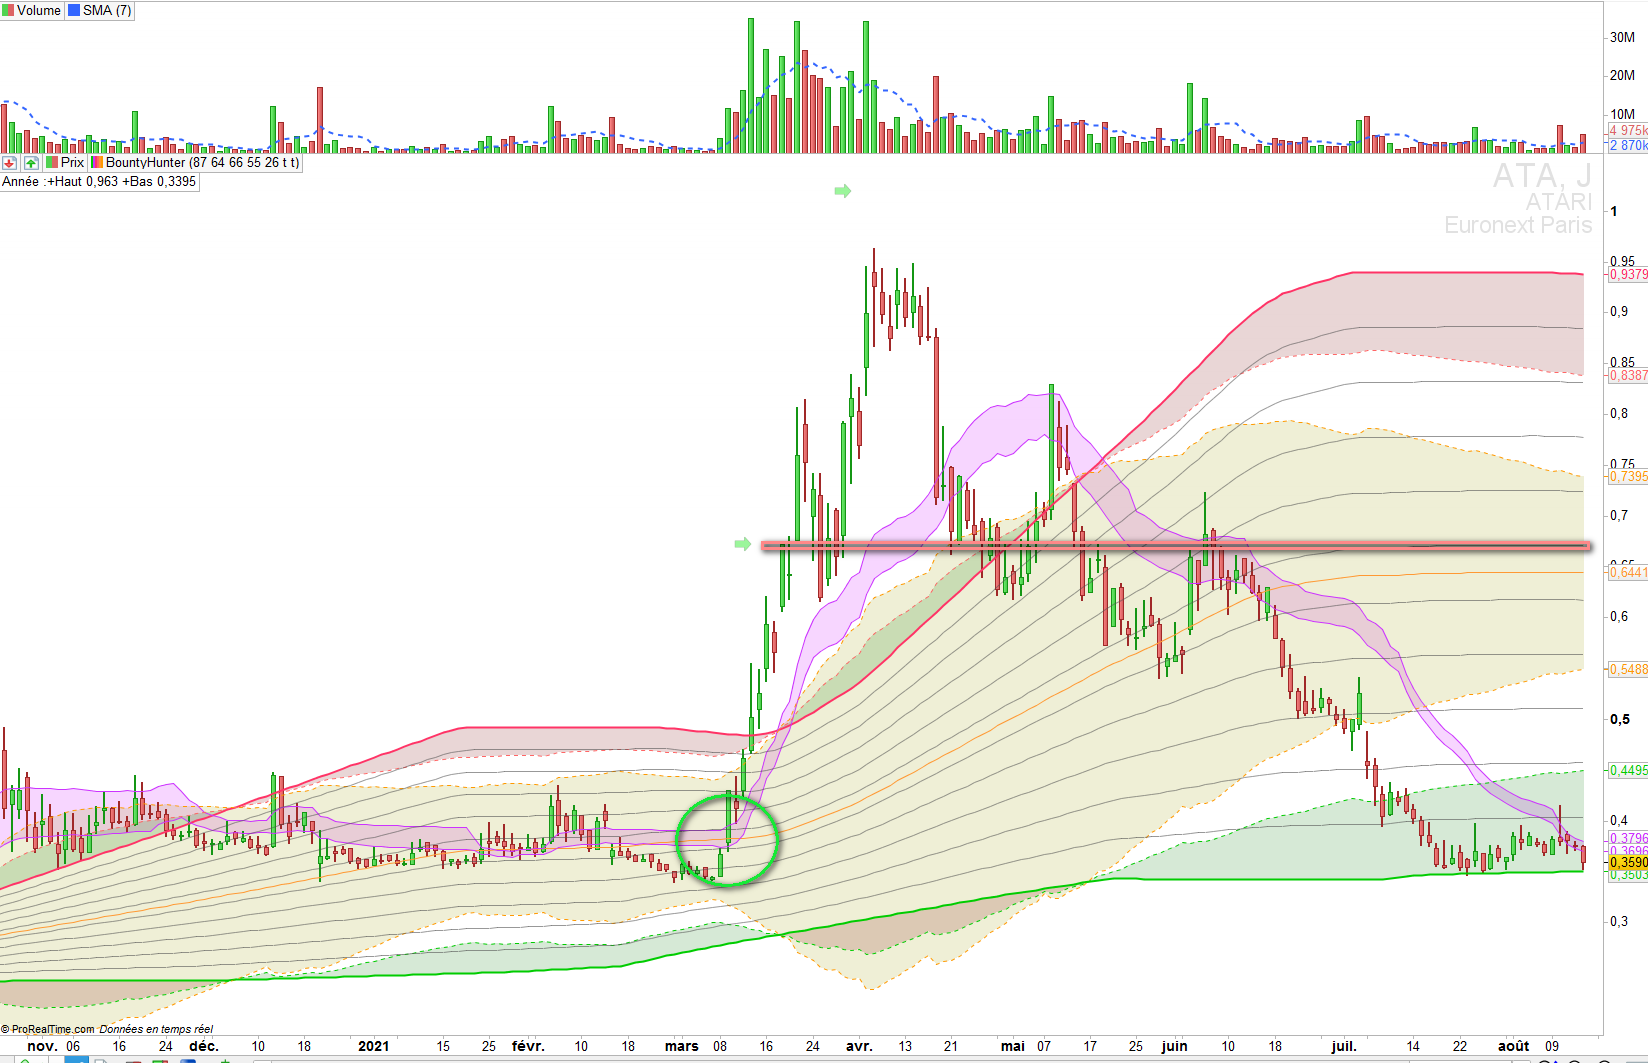
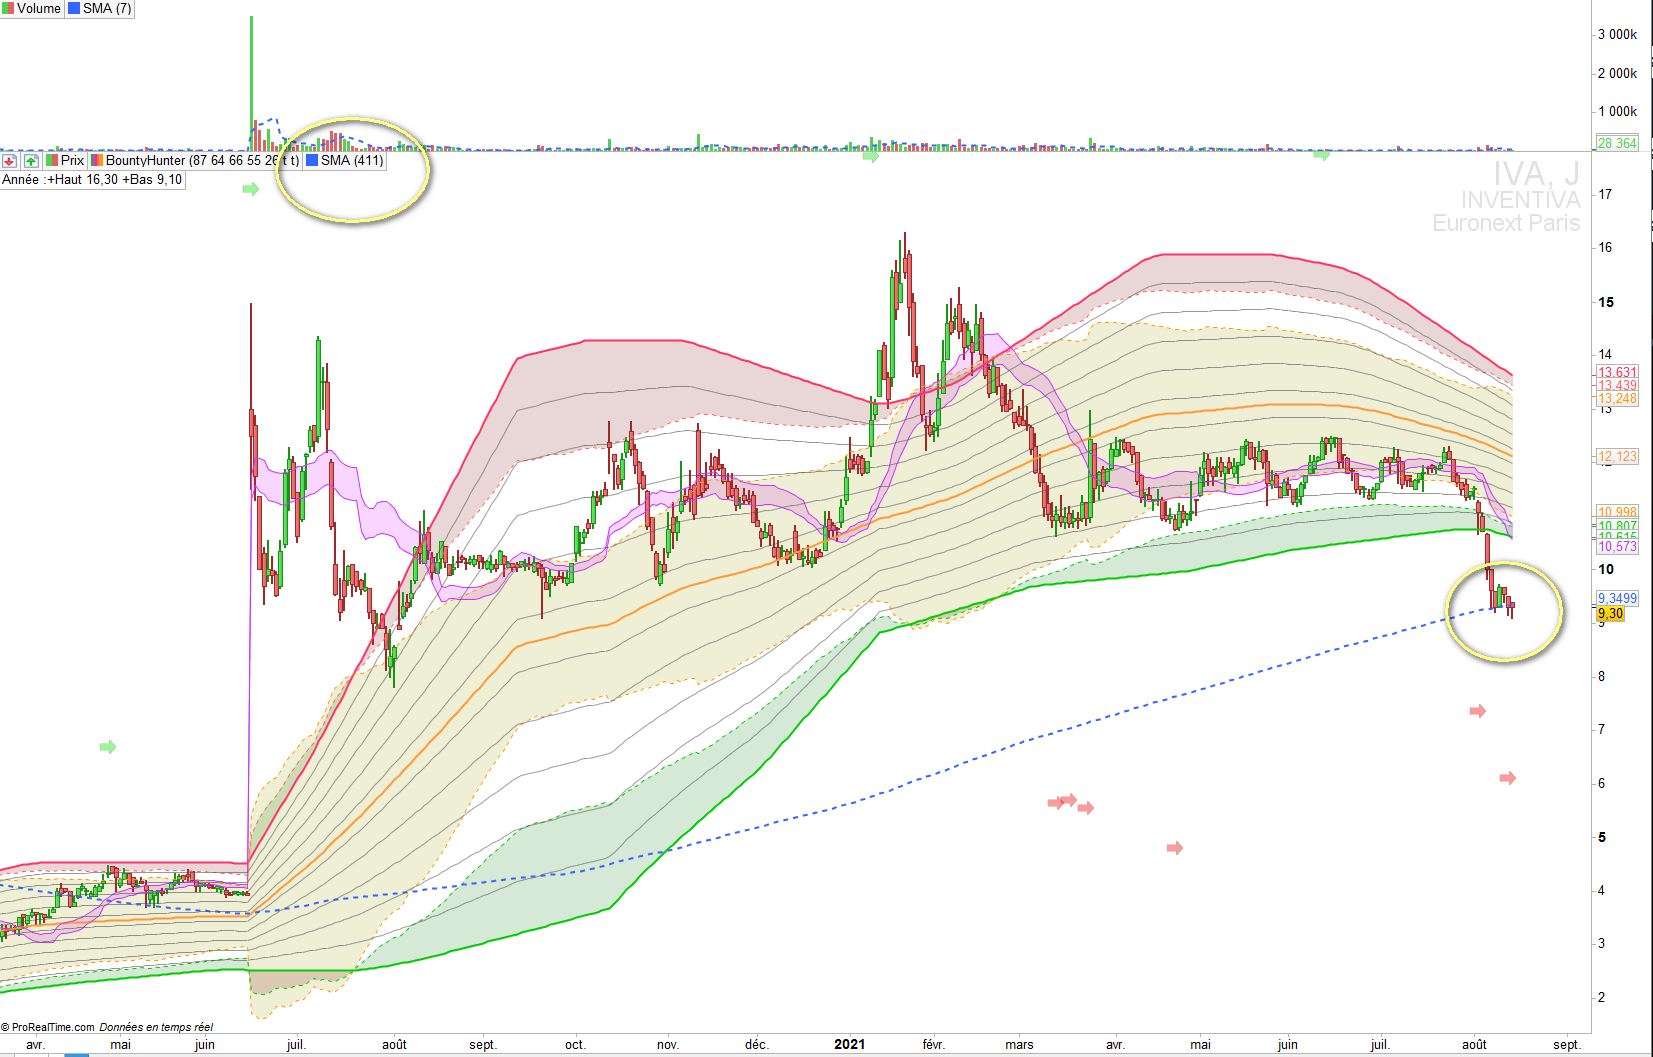
This indicator also shows likely targets when impulsions arise, by the means of green and red arrows , often it shows in advance where the price is going to consolidate or bounce.
Series of arrows at the same level show good overall prediction.
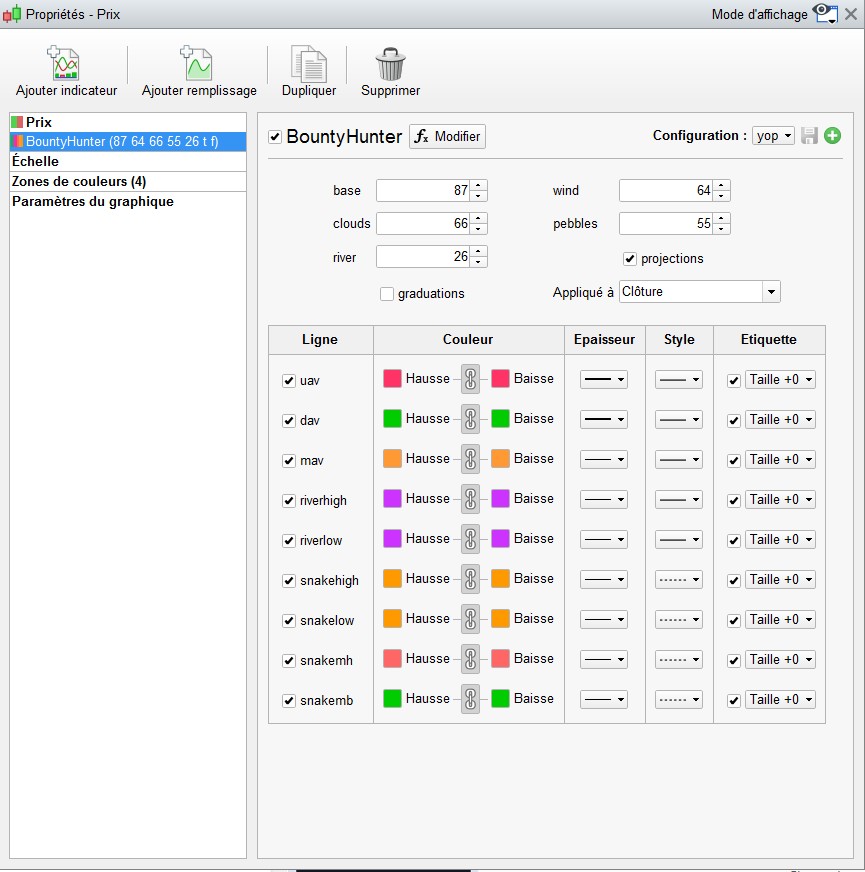
It is fully customizable appart from the color of the arrows (wich can be turned off)
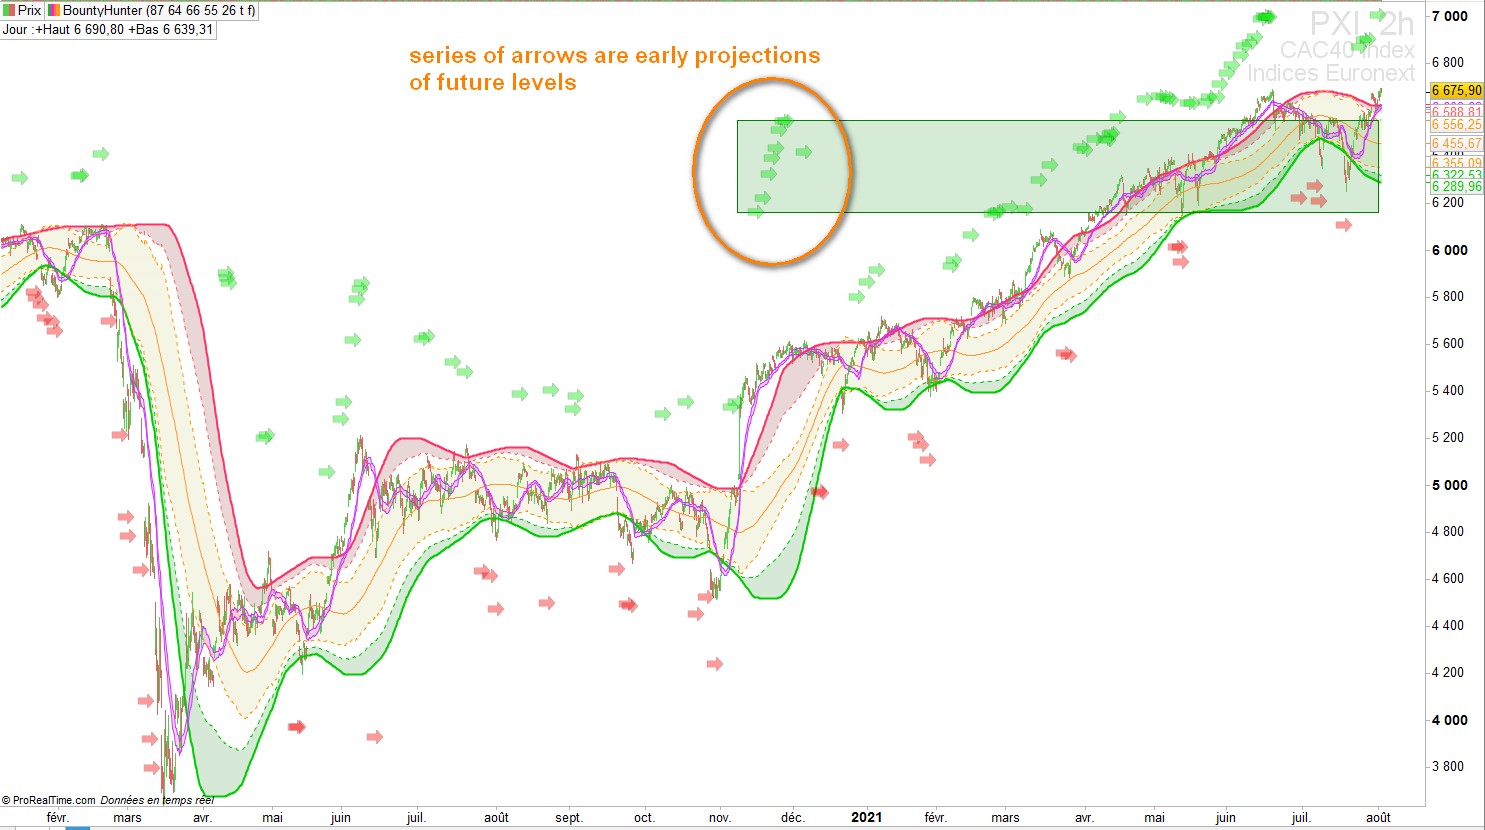
Figure 1 : Cac 40 index in a 2 hours timeframe , shows likely targets in advance
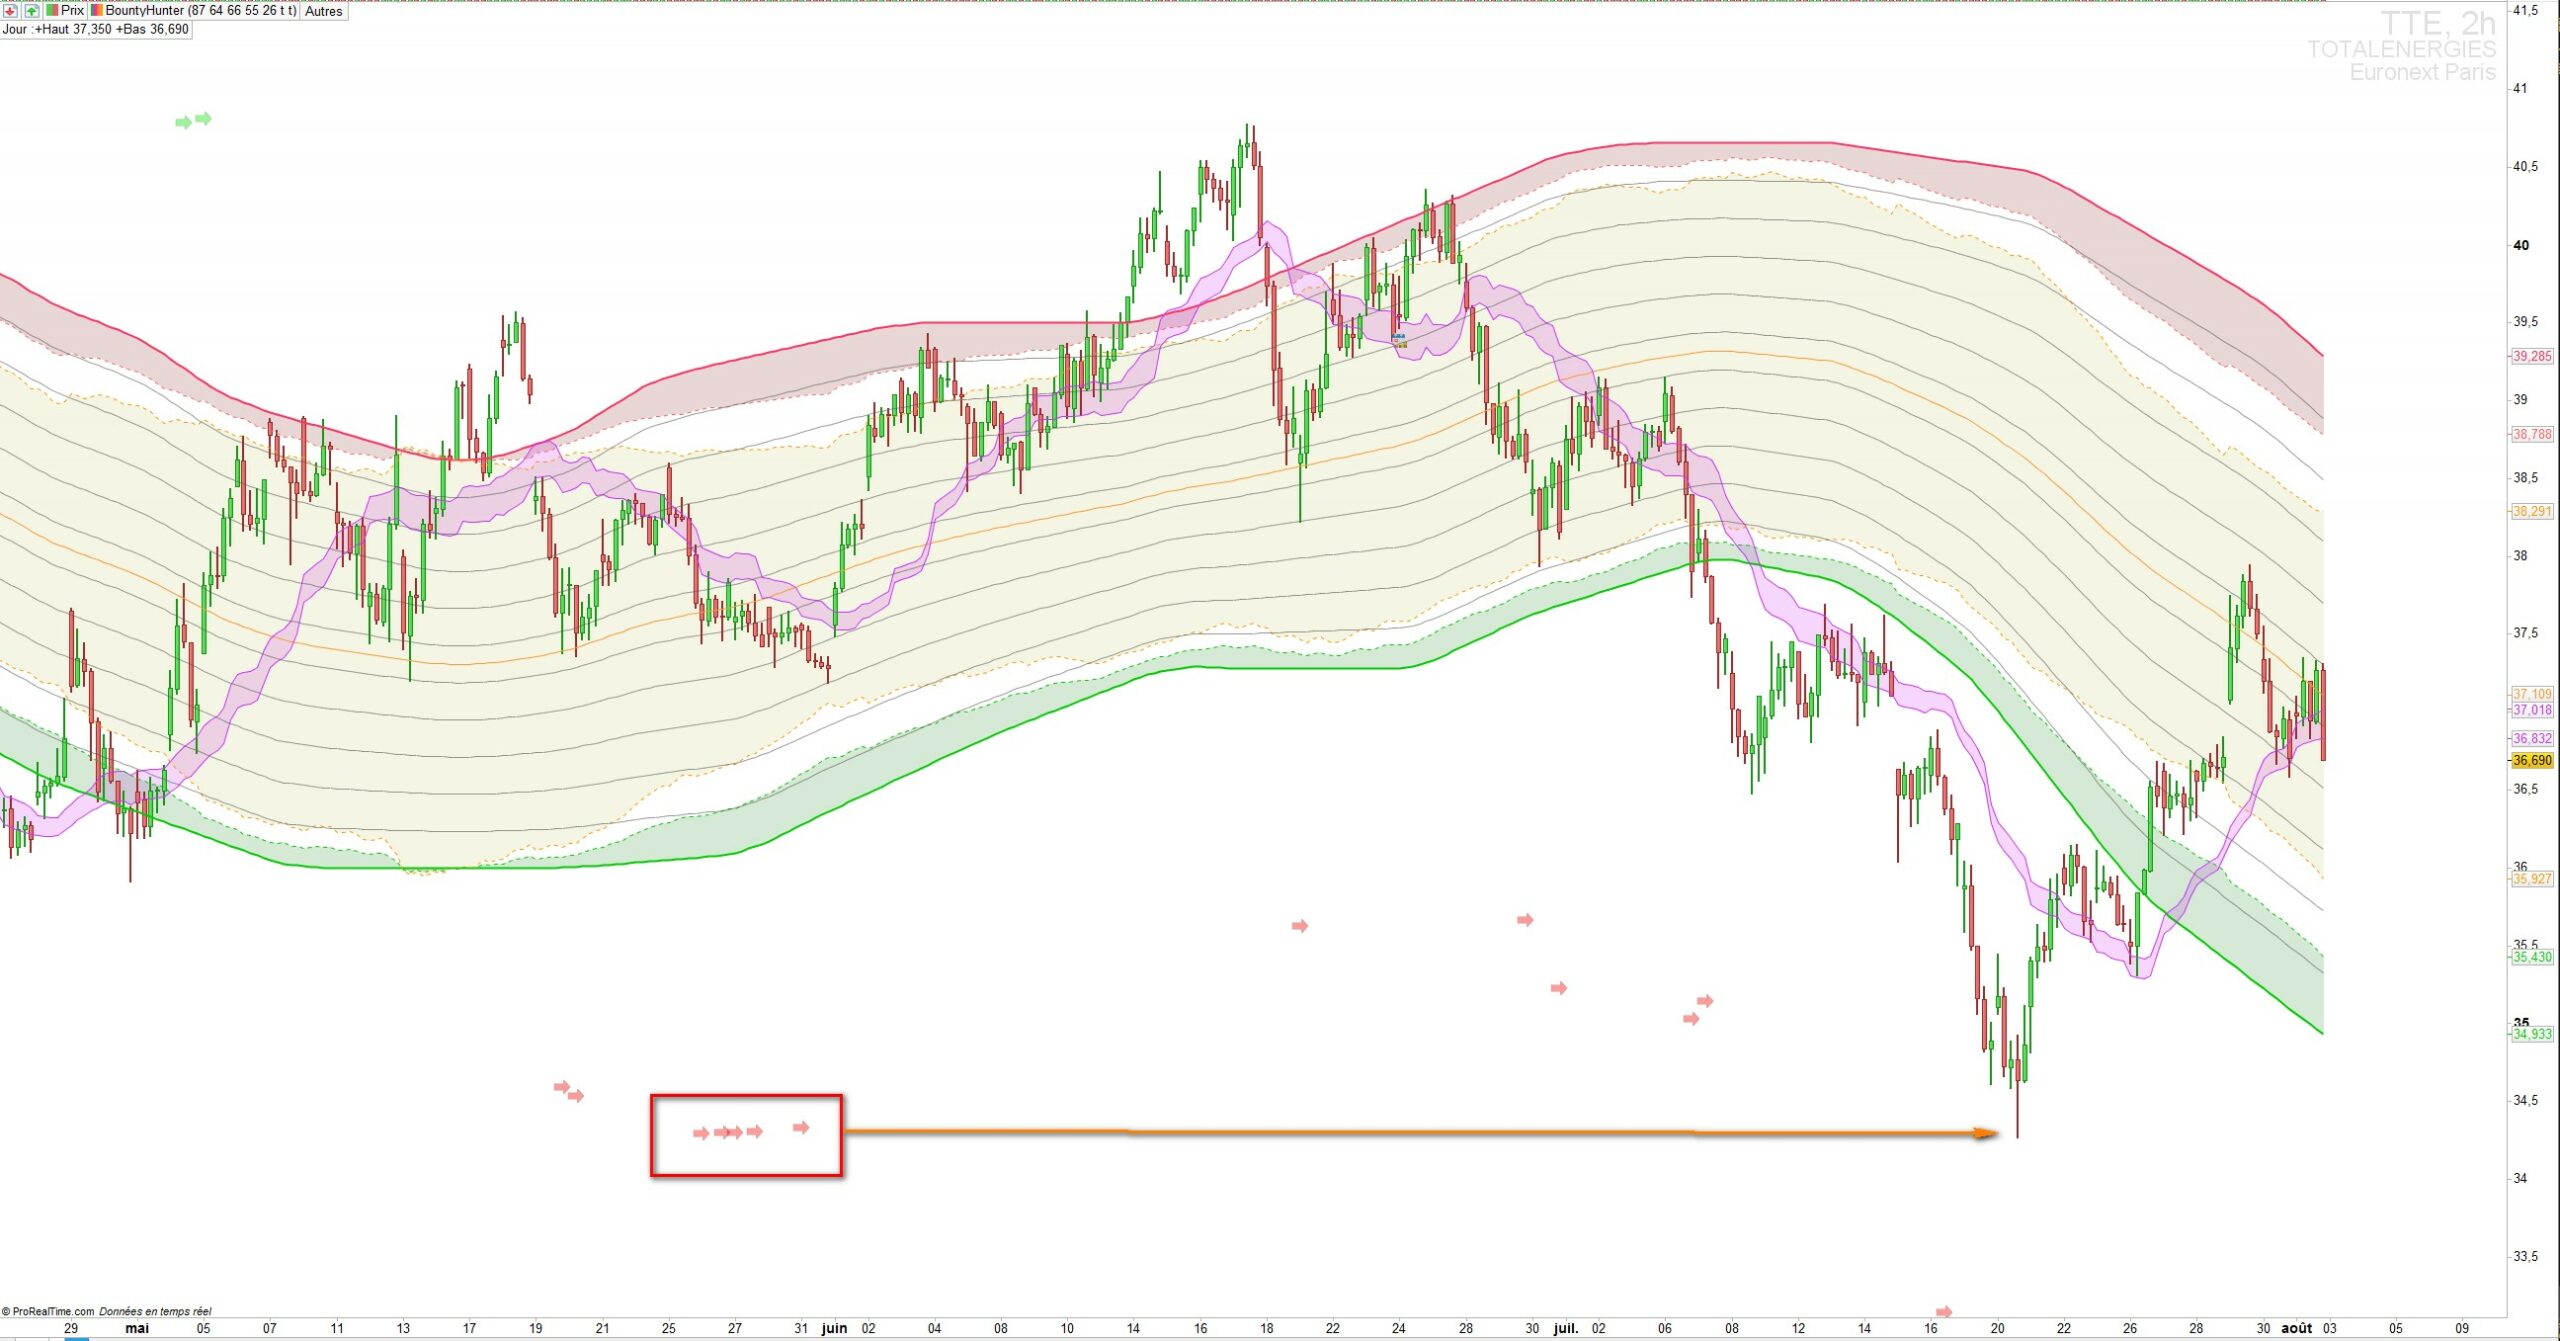
Figure 2 : Totalenergies stock , 2 hours timeframe
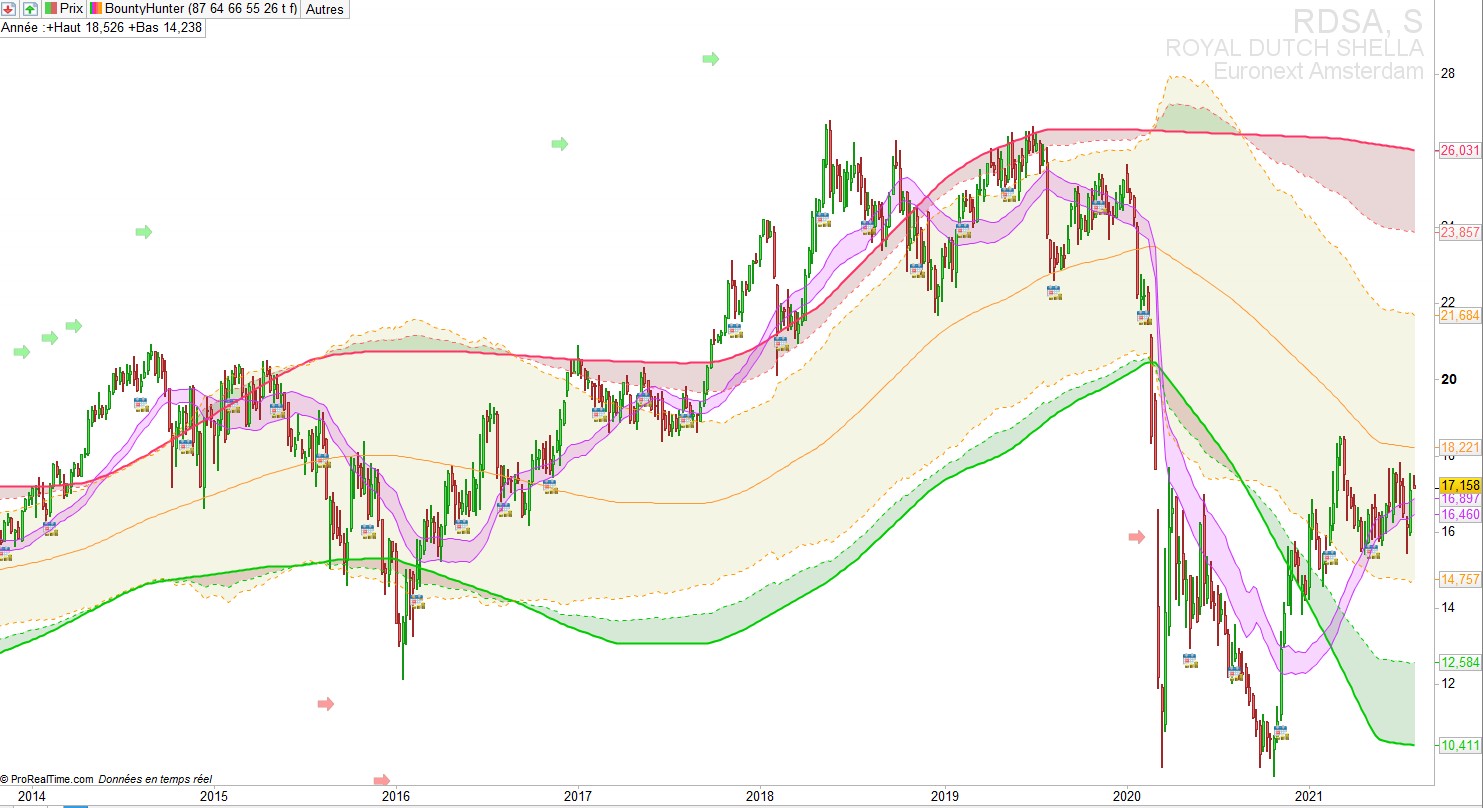
Figure 3 : Royal Dutch Shell A stock, weekly chart .
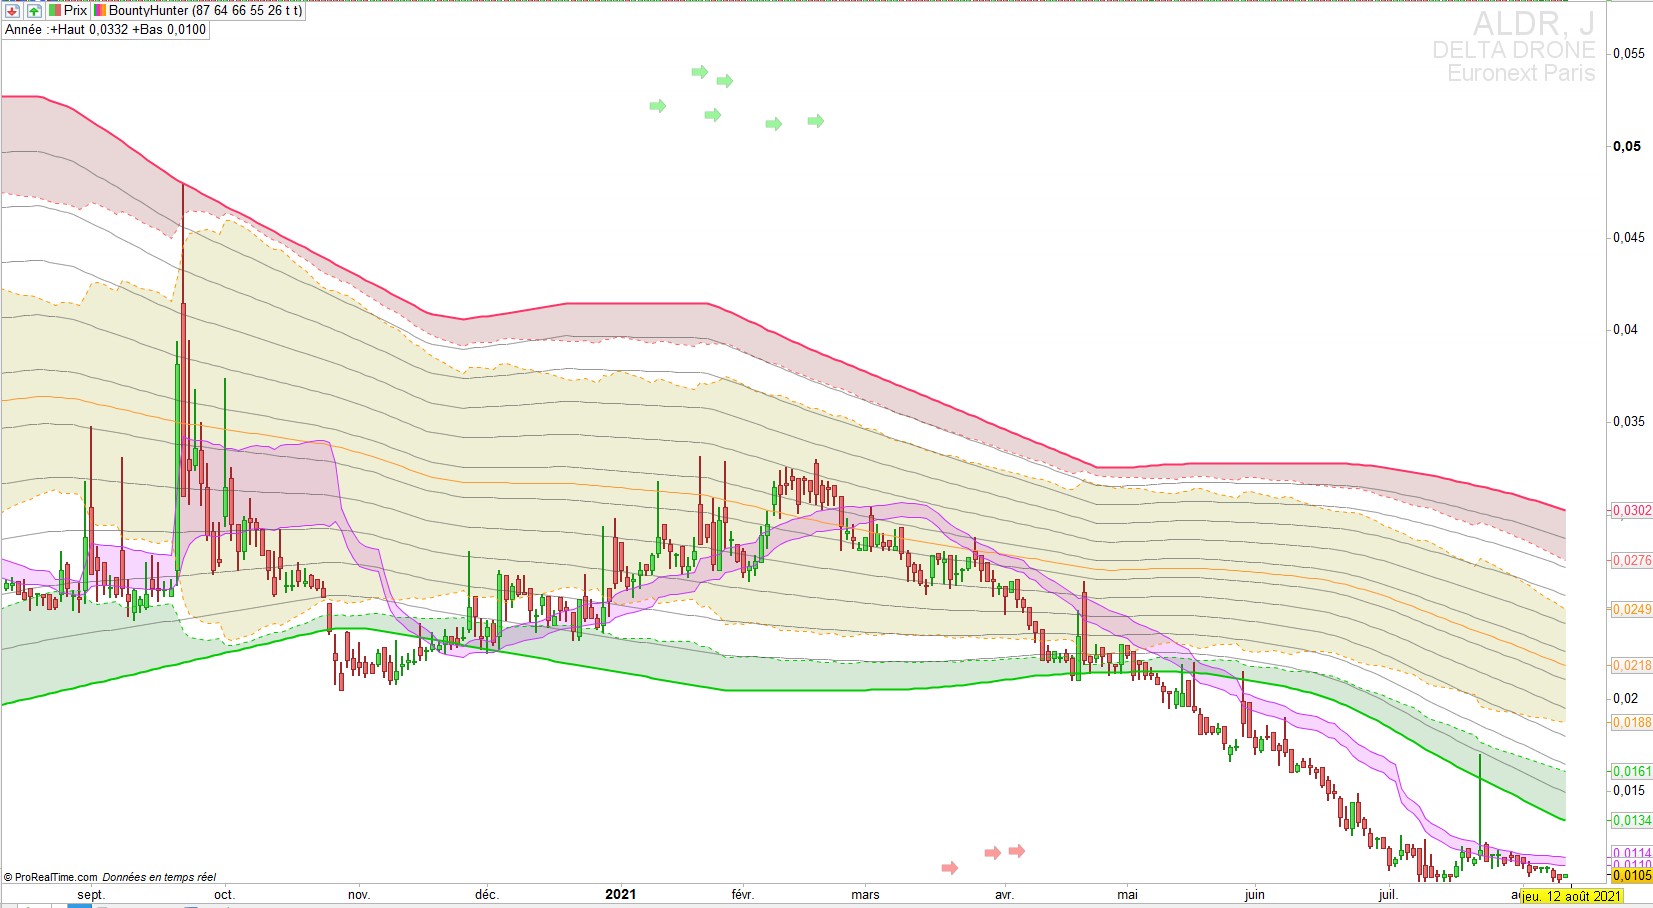
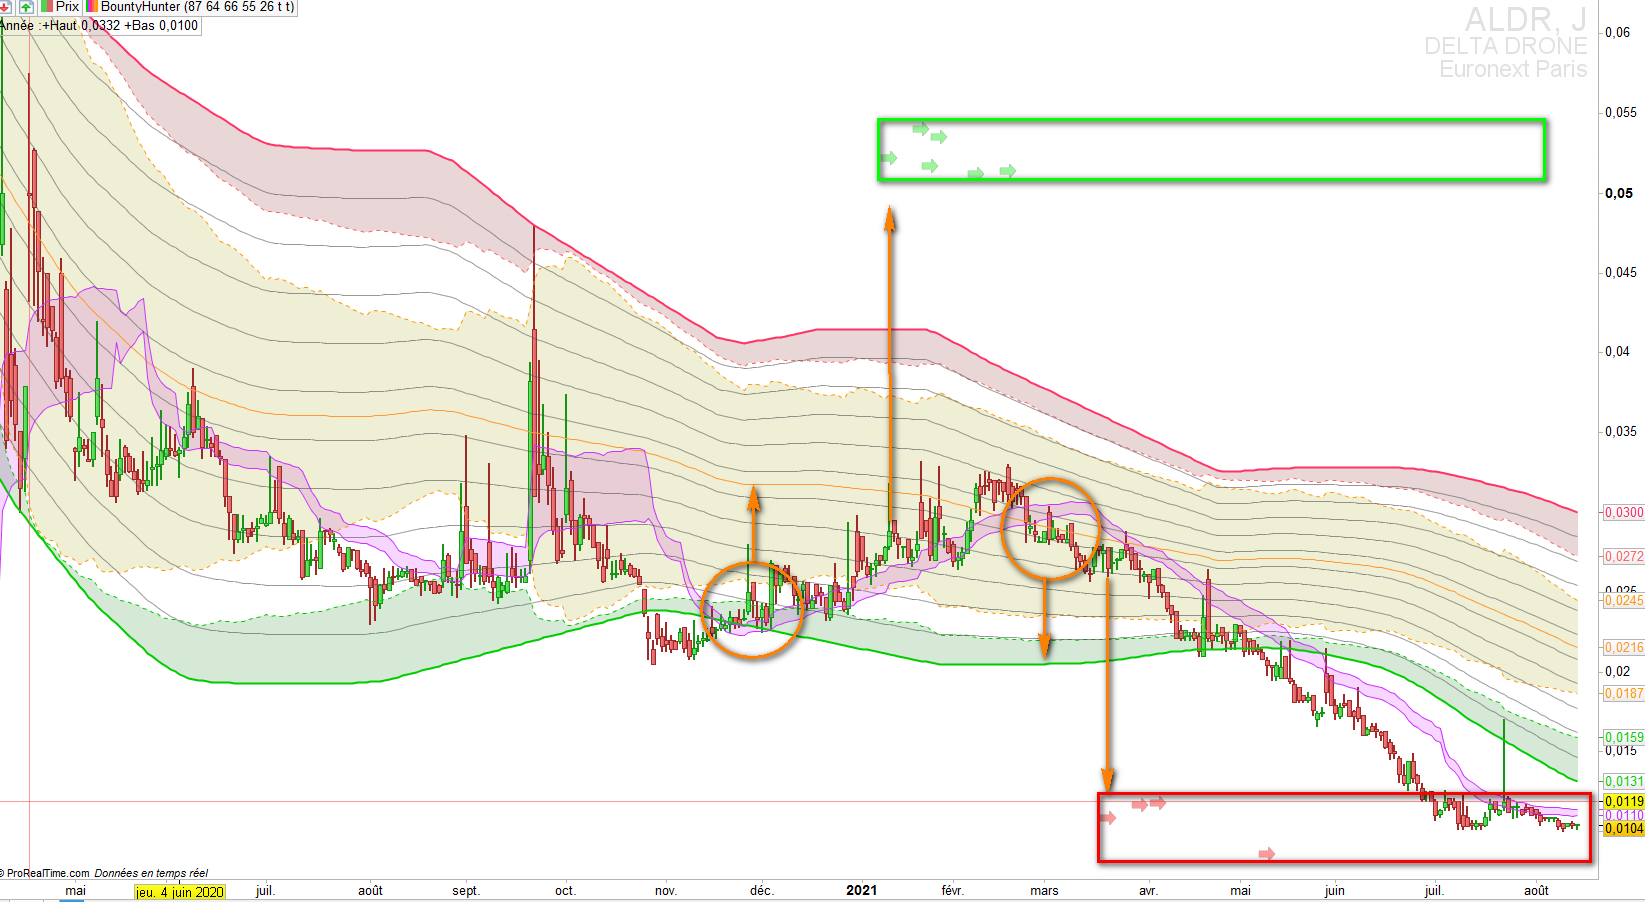
Figure 4 : Delta Drone, daily Chart, purple snake shows polarity
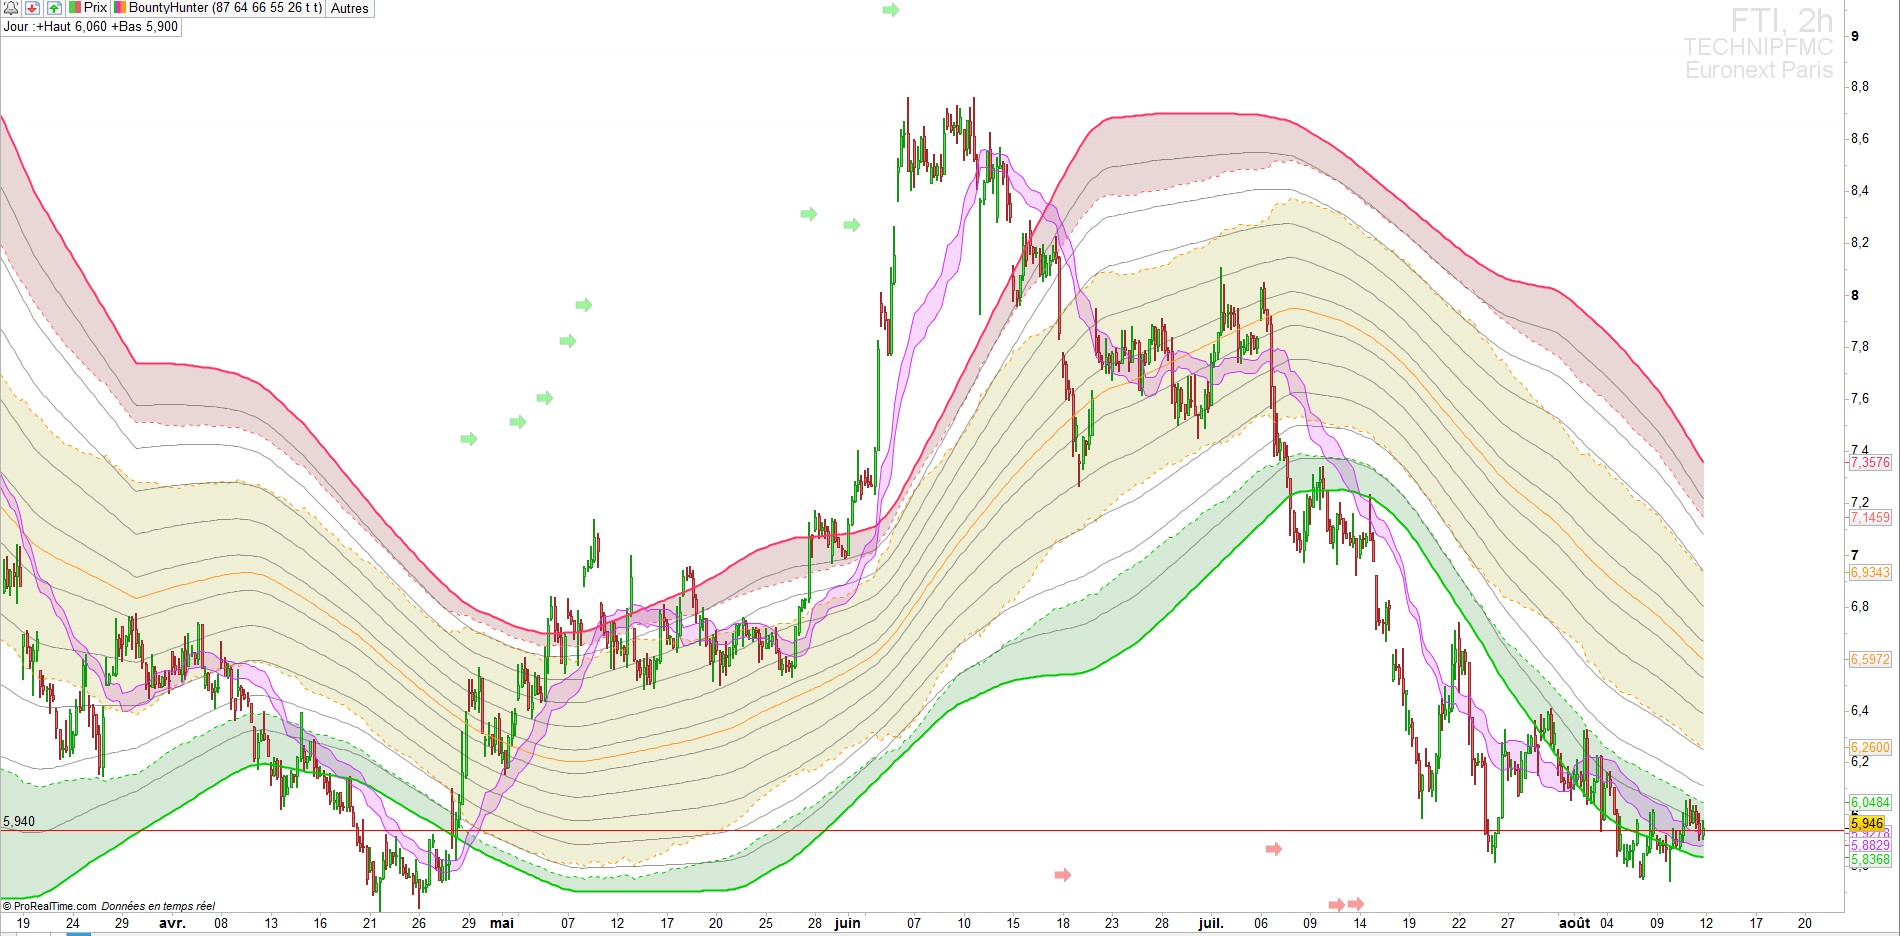
Figure 5 : TechnipFmc 2h chart
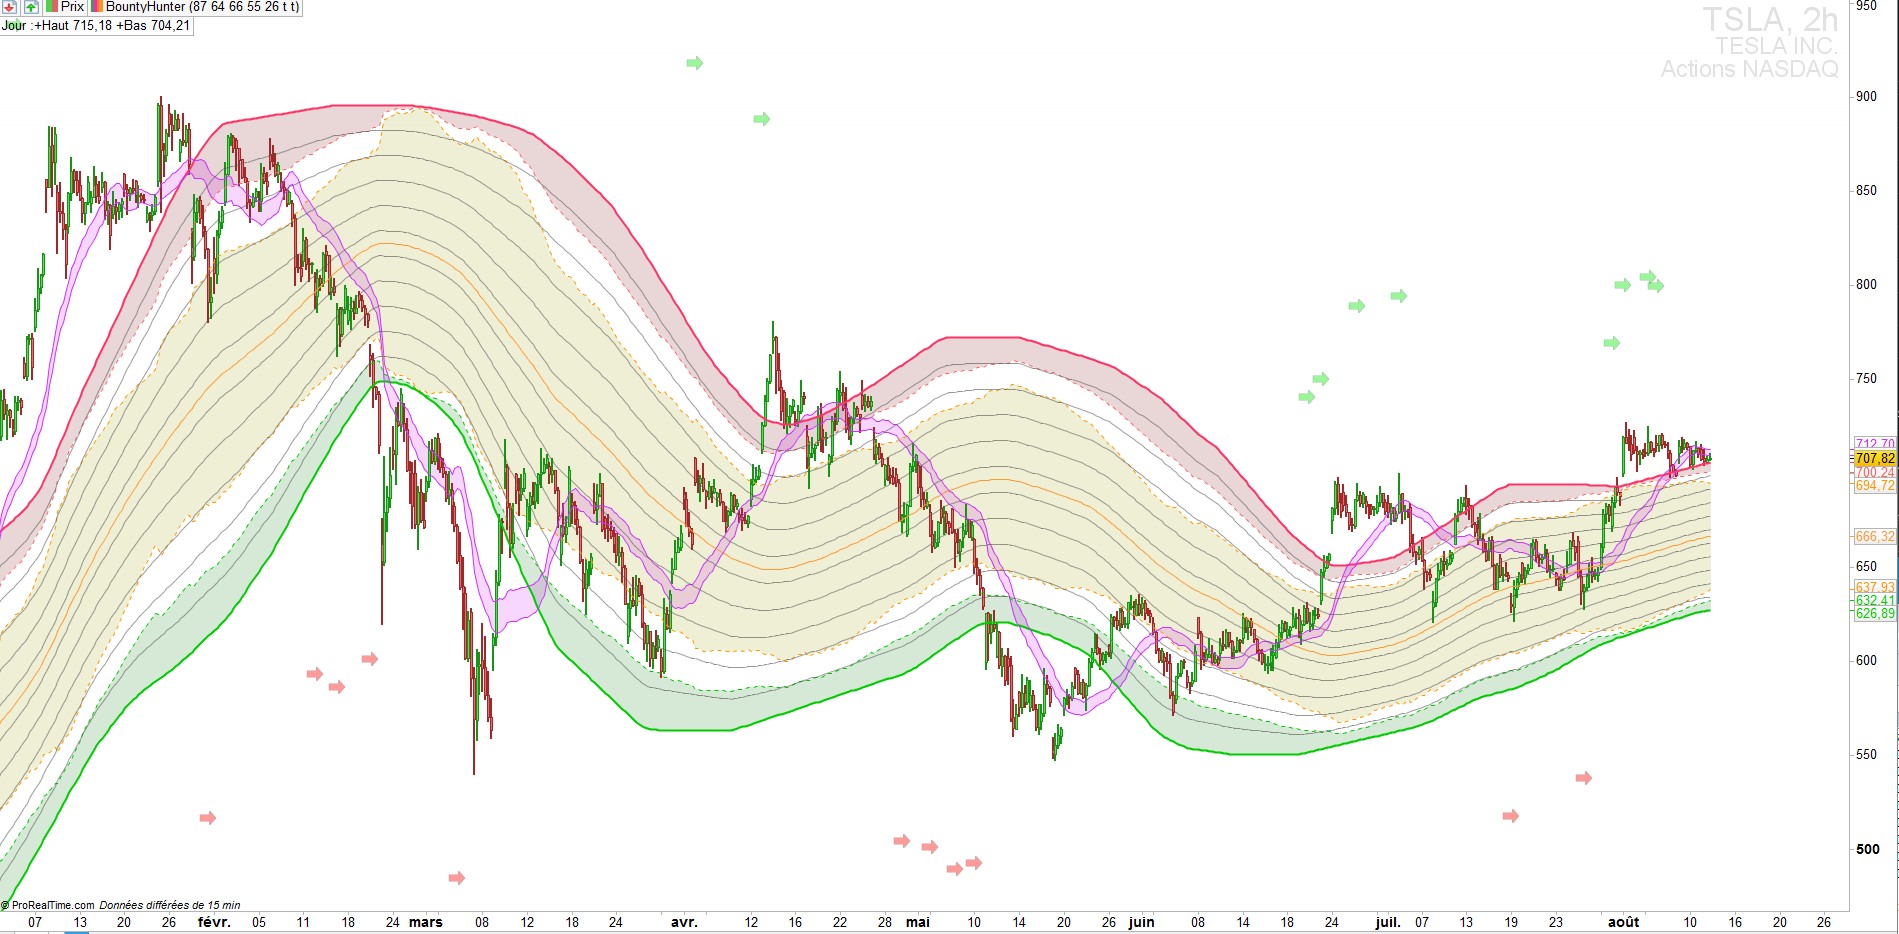
Figure 6 : Tesla 2h chart
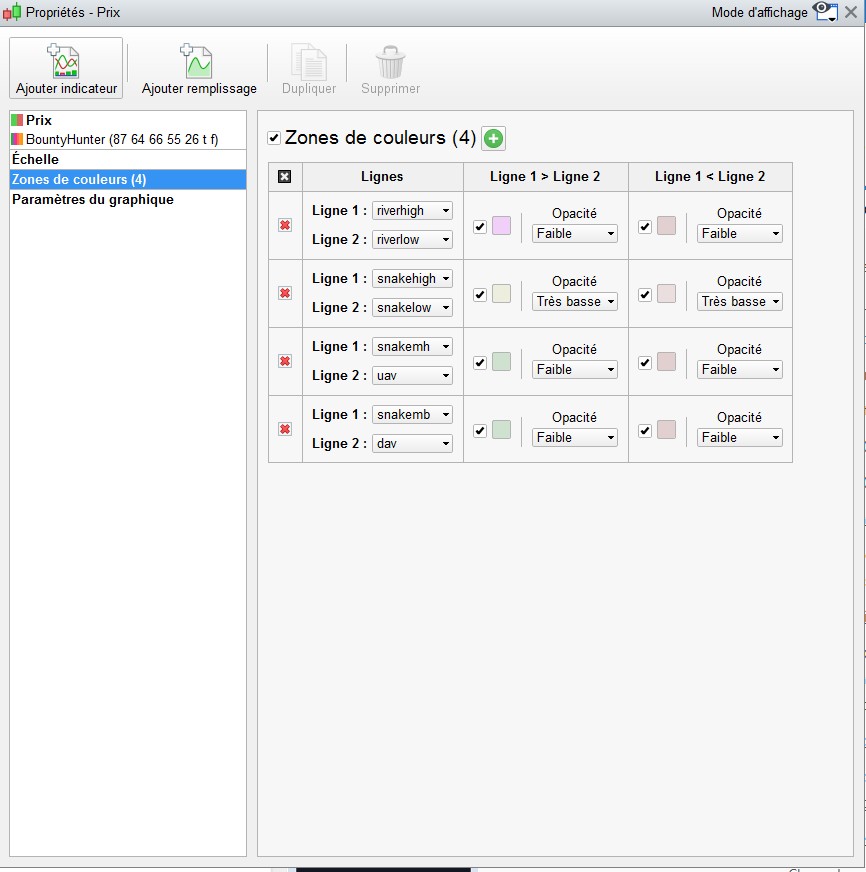
Configuration :
Reviews
There are no reviews yet.