
All Main Reversal Patterns
This indicator will allow you to visualize instantly the most famous reversal patterns which are :
- RSI Divergences
- Candle Patterns
- Wolf Waves
- Head and Shoulders
Please note that a reversal pattern must not be considered if the price is not located in a price area where a price reversal is likely to happen. Reason why I strongly recommend to use my other “Supports & Resistances” indicator in combination with this one, or a personal indicator you would think more suitable.
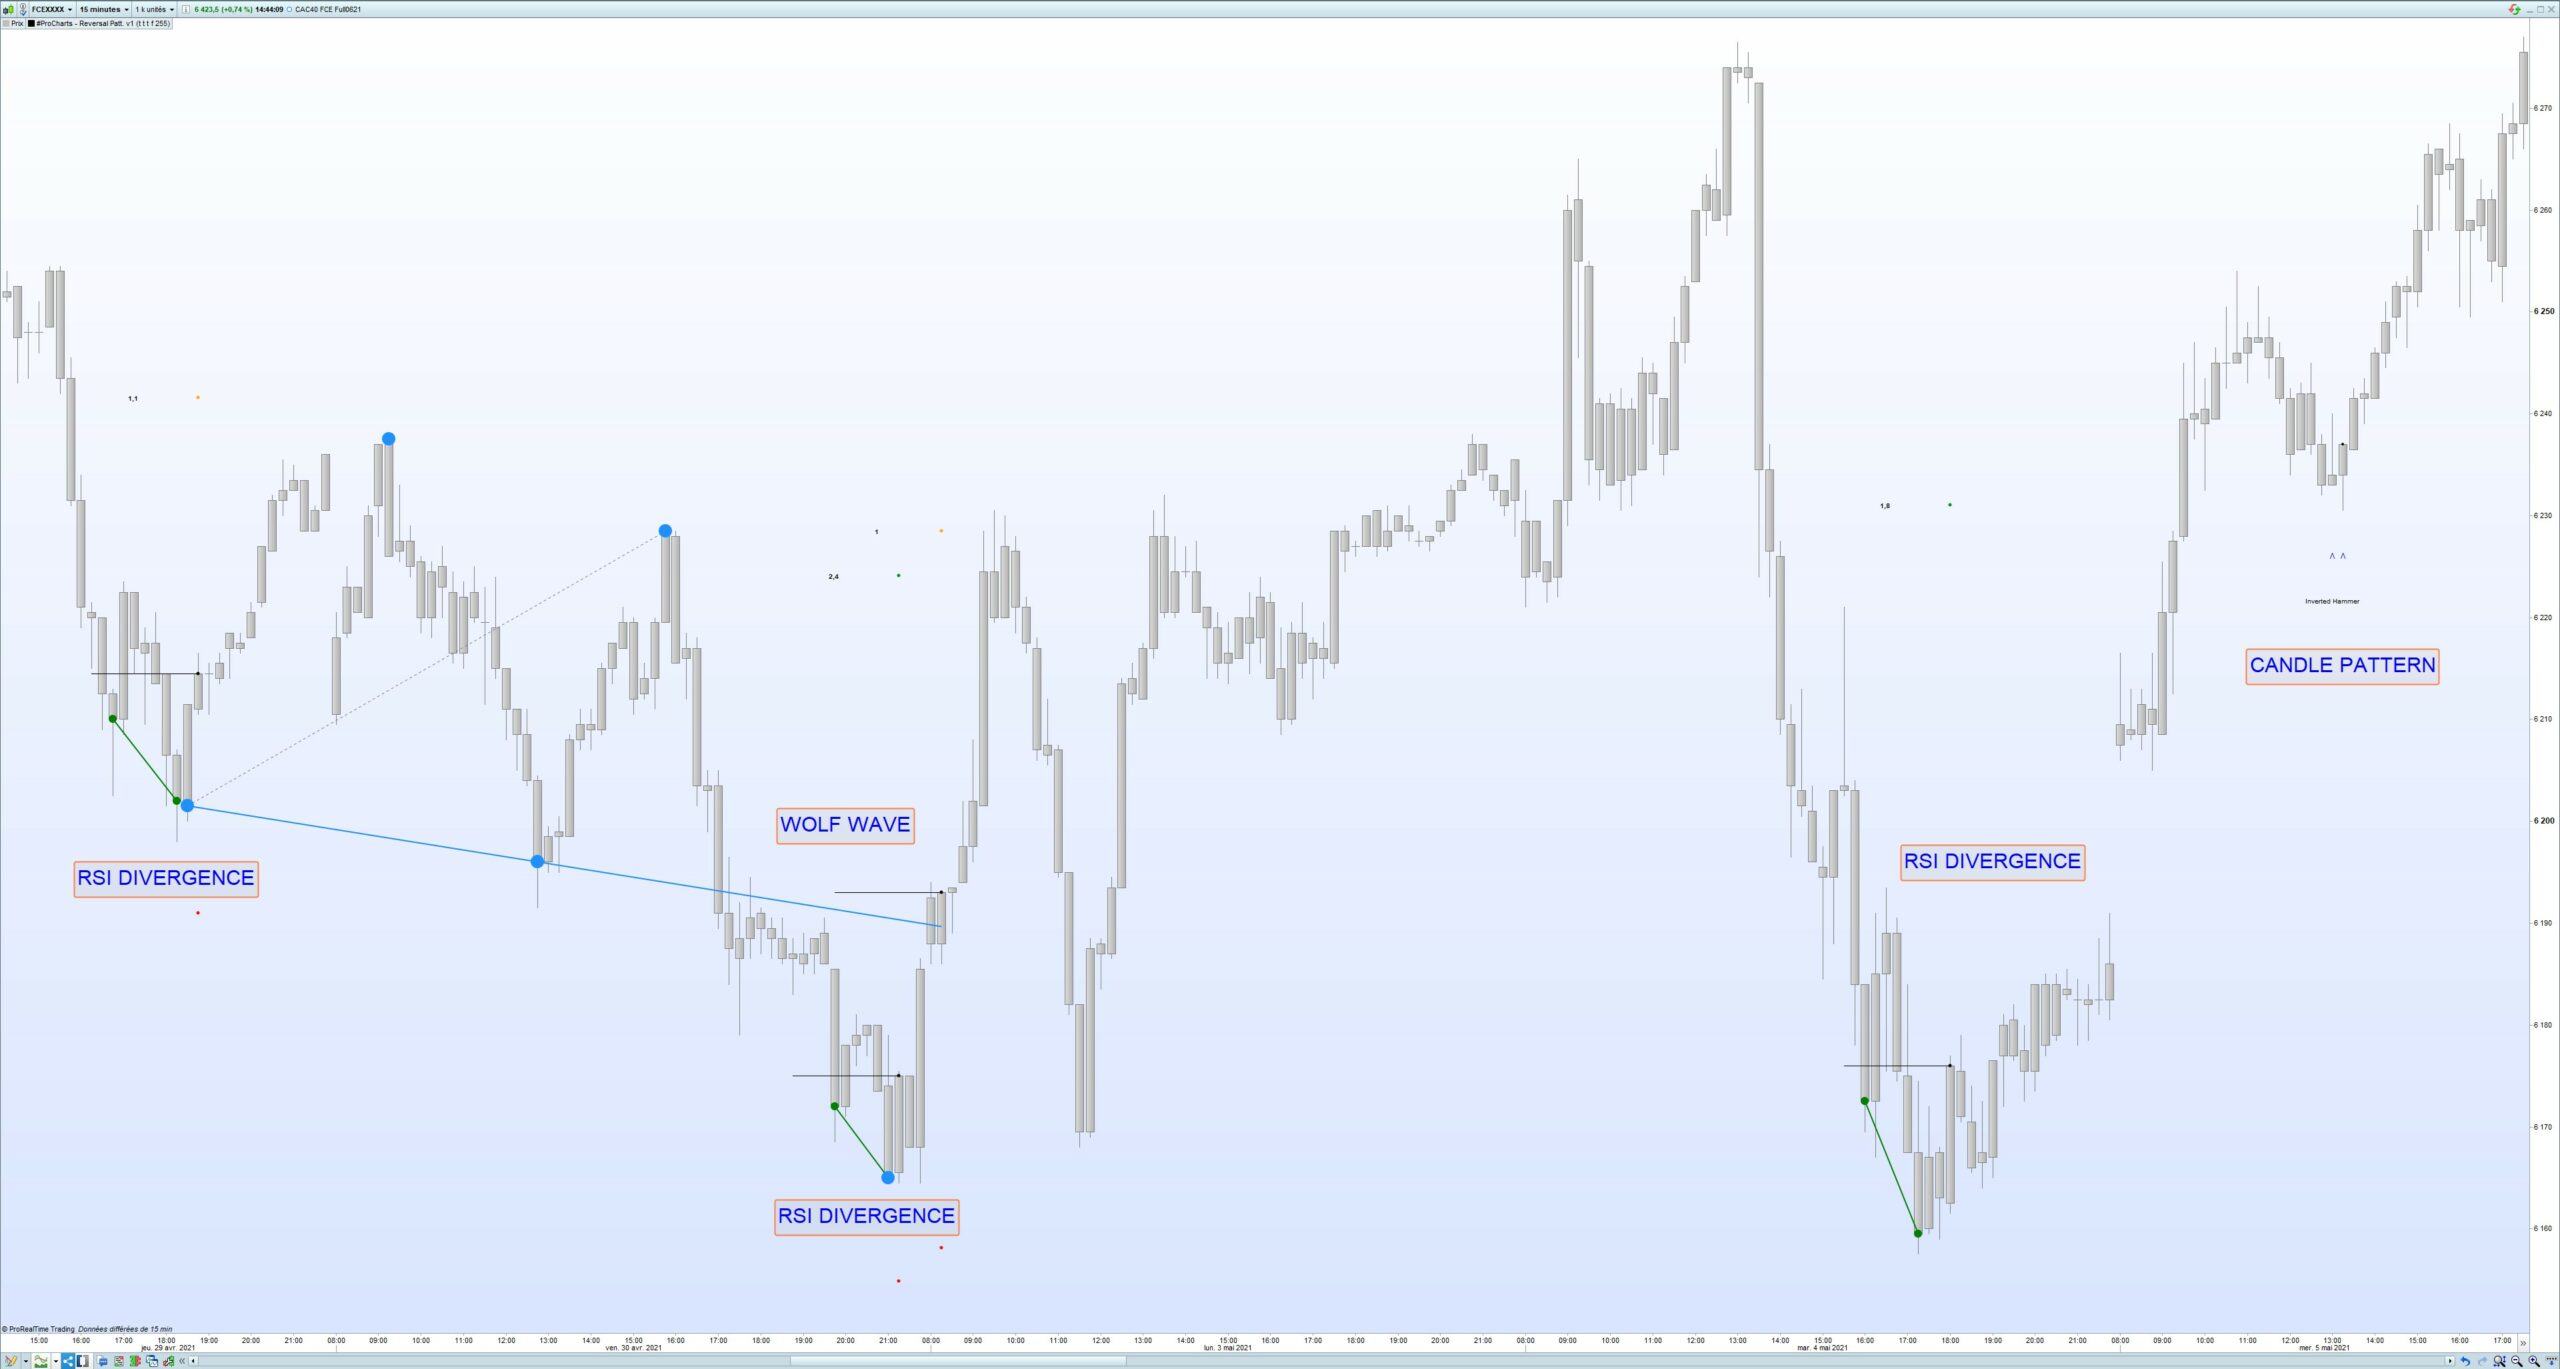
This is what will appear on your screen:
THIS INDICATOR NEVER REPAINTS !!! ONCE THE FINAL CANDLE OF A PATTERN IS CLOSED AND IDENTIFIED WITH A SMALL BLACK DOT, THE PATTERN WILL NEVER BE REMOVED IN THE FUTURE !
Here are the details of all the reversal patterns I have coded into this indicator and that I use in my daily trading activities :
1. RSI Divergence
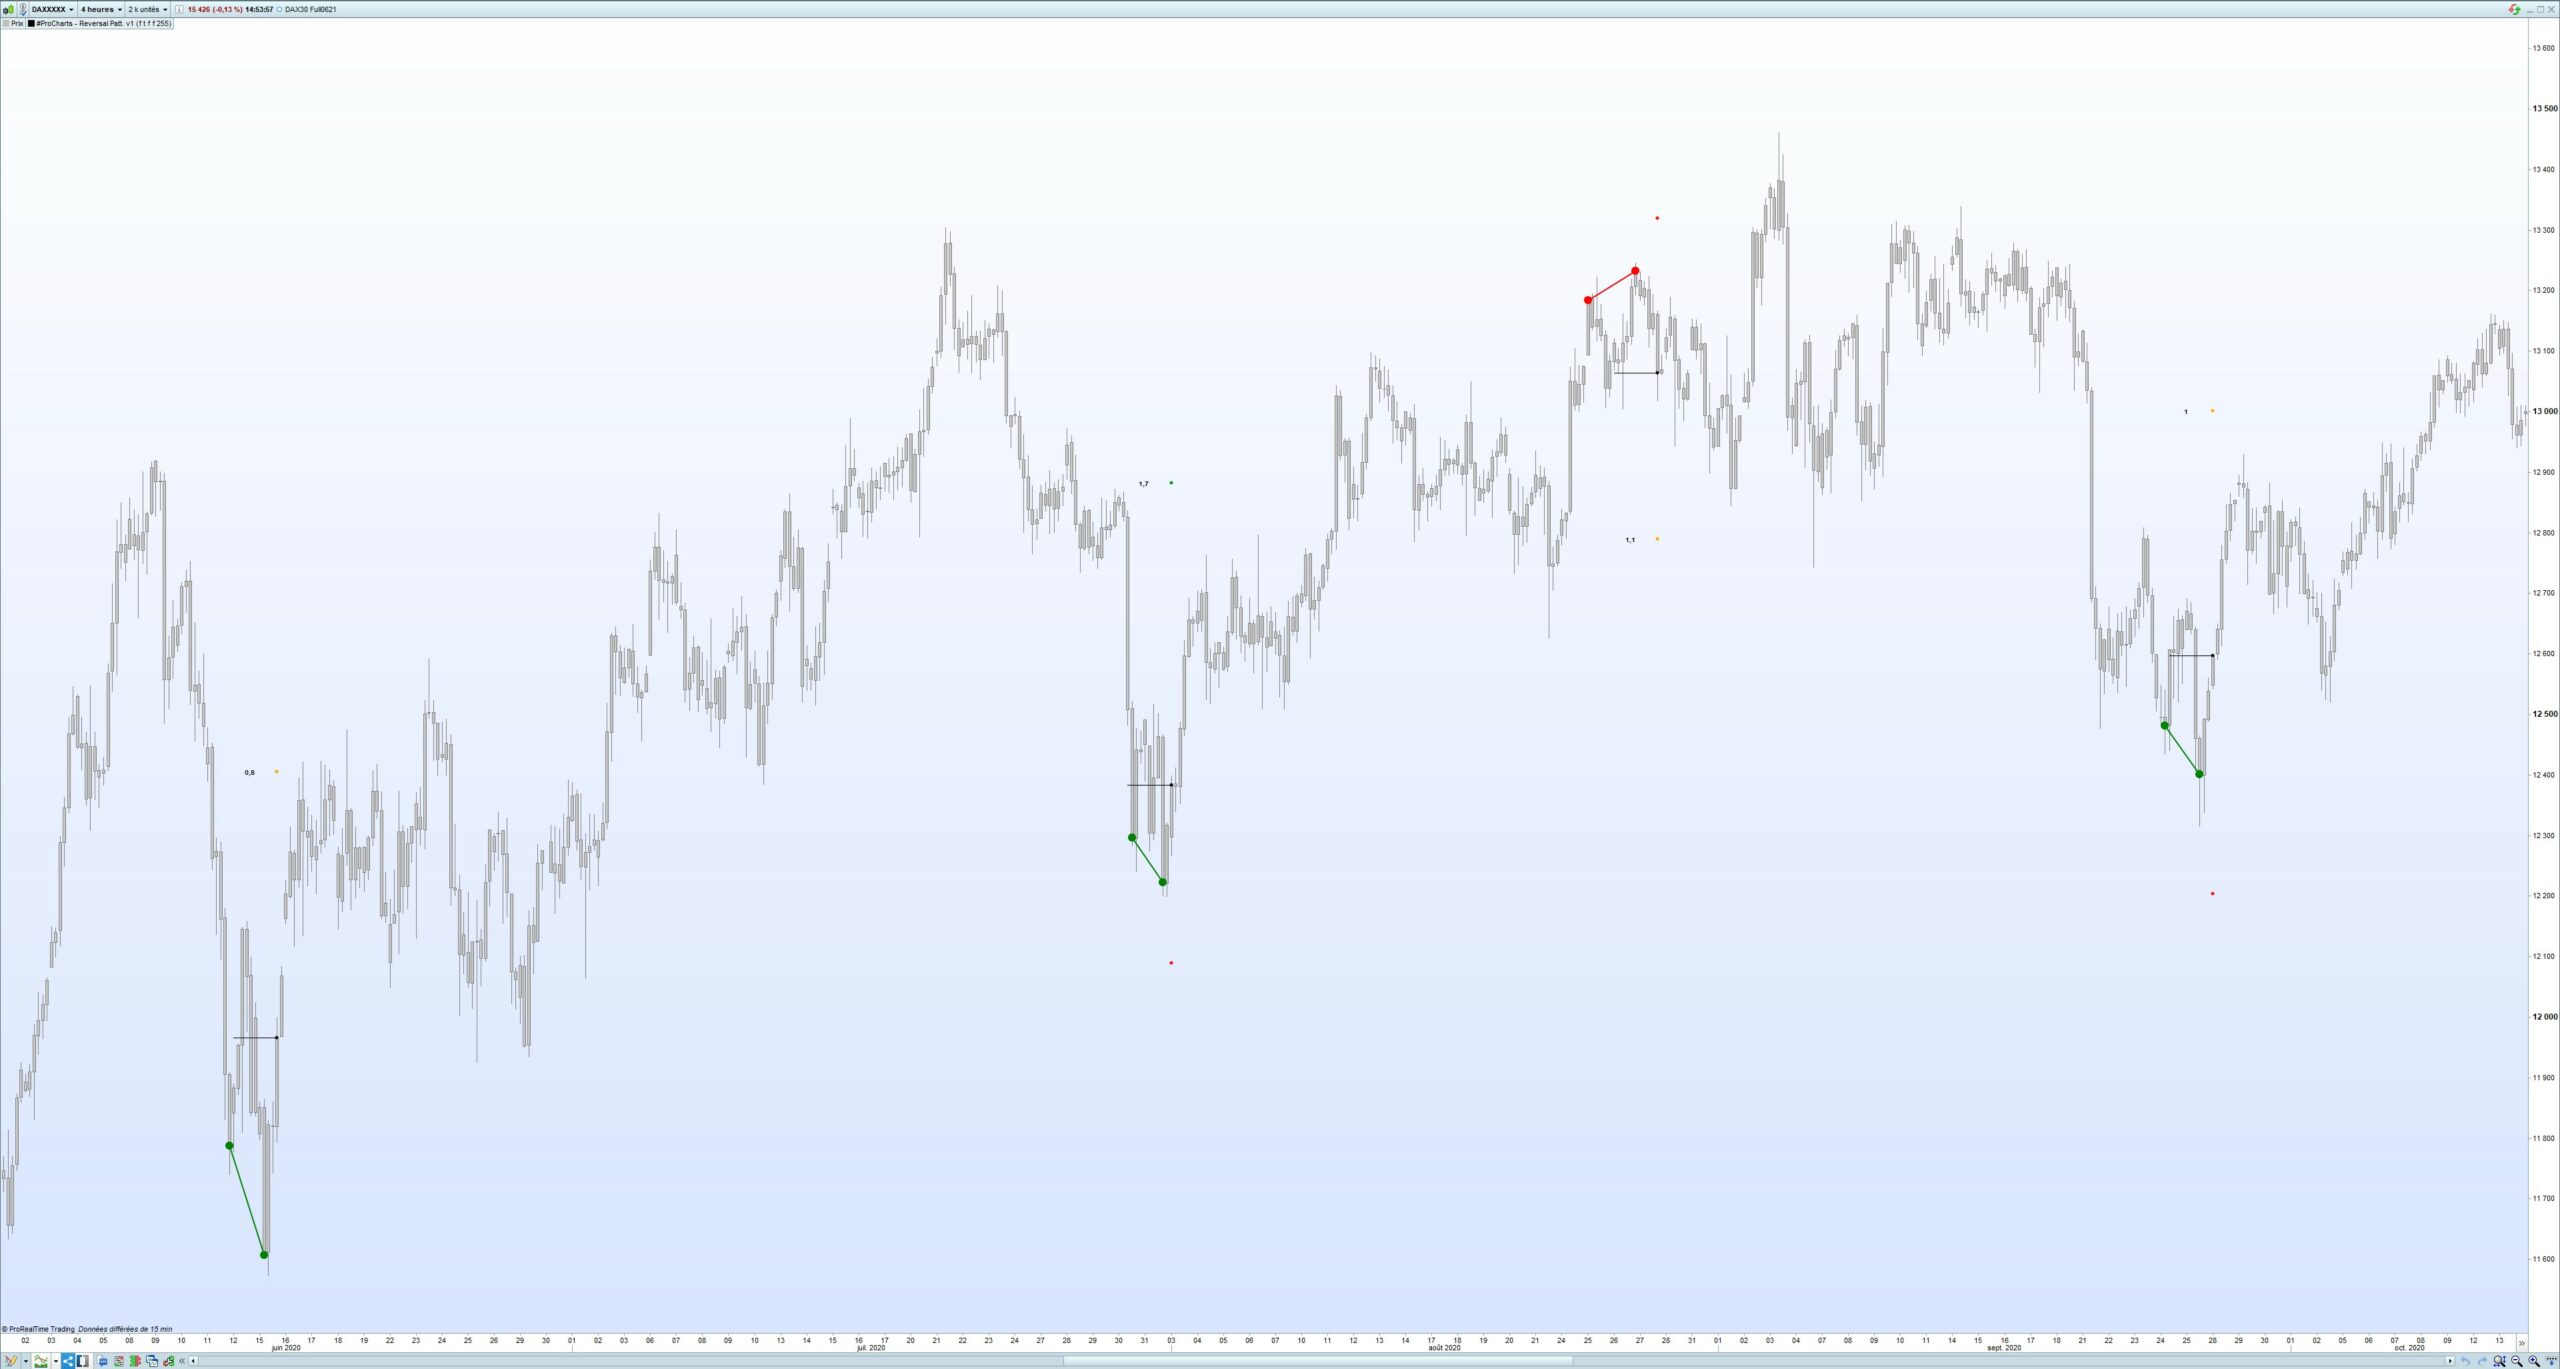
I have coded a RSI divergence script. But on top of all other RSI divergence indicators, you may have seen, I added a filter in order to invalidate divergences without a reversal price pattern. The indicator will not promptly indicate you the divergence but wait a few more candles in order to see if a price reversal is likely to happen. Then it will mark a black dot and line indicating you a price position entrance proposal. In addition, the script will make you a SL and TP proposal based on Fibonacci extension and retracement. Beside the TP dot, the indicator will indicate you the risk/reward ratio in order to show you clearly the risk/reward of this potential trade (always consider a minimum ratio of 1.5 identified with a green dot, below such ratio the dot will be displayed as yellow).
2. Candle Patterns
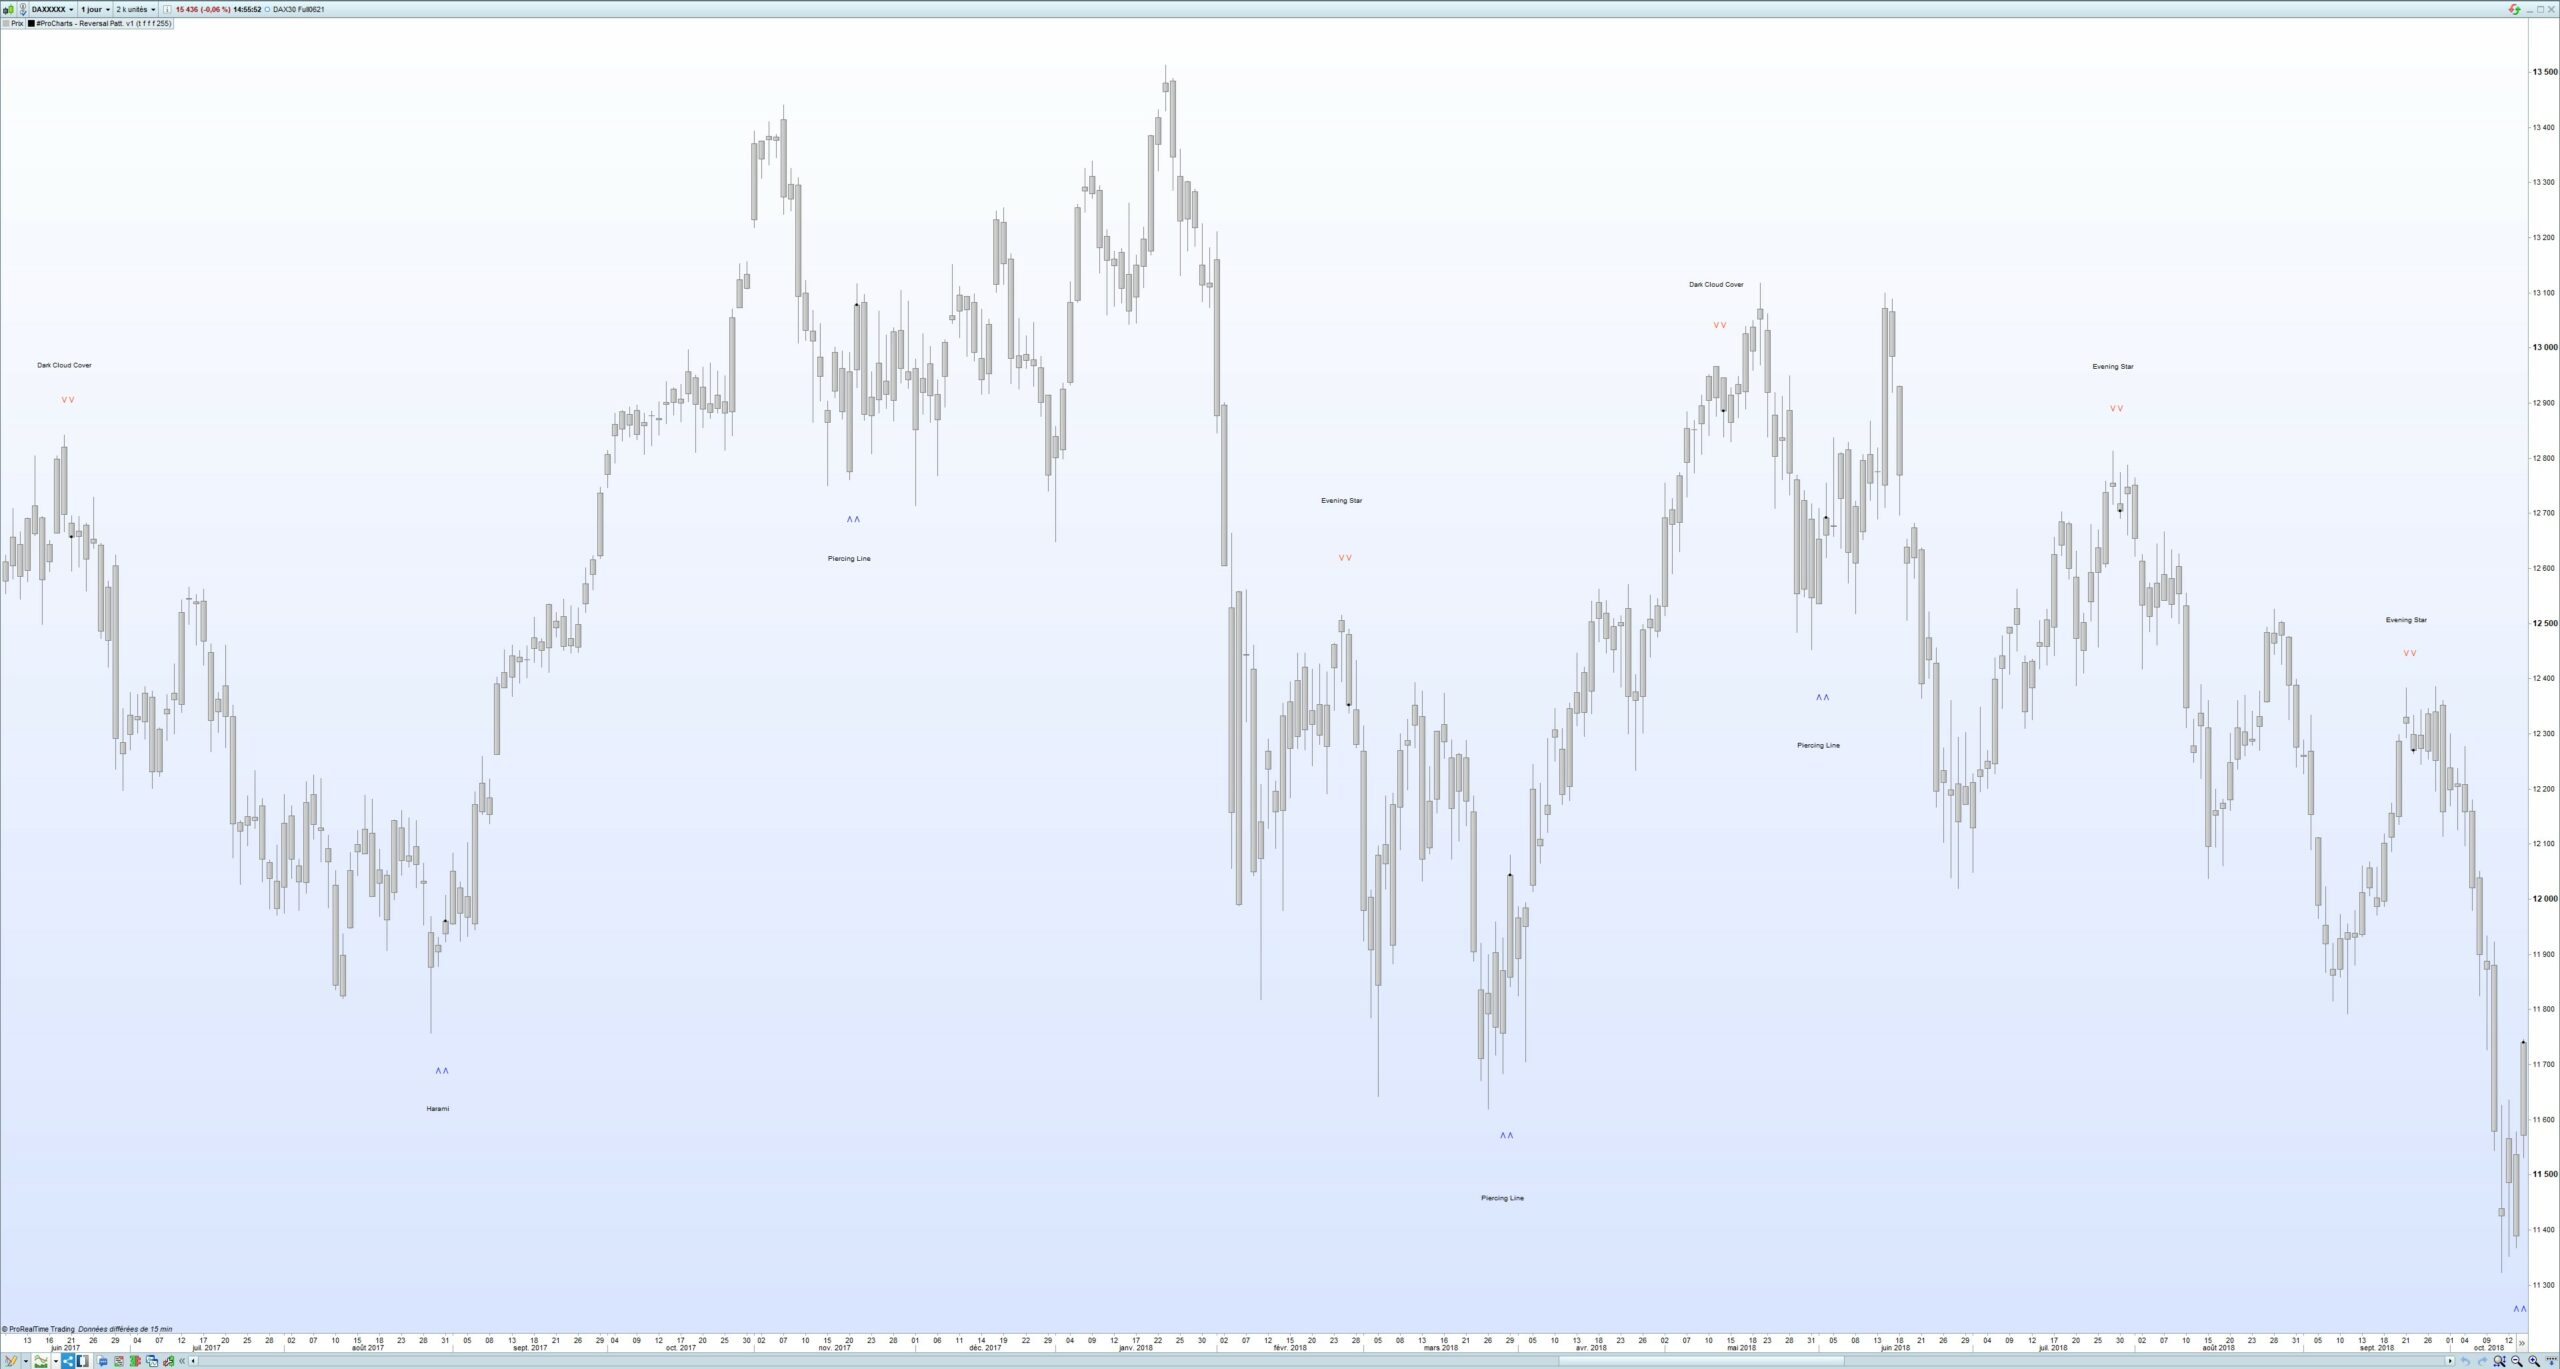
I have implemented into my script the detection of all those candle patterns : Engulfing, Piercing Line, Dark Cloud Cover, Harami, Hammer, Hanging Man, Inverted Hammer, Shooting Star, Morning Star, Evening Star, Three White Soldiers, Three Black Crows. Do not be surprised to see that my candle pattern detection requires 2 candles, due to the fact that I always wait for the next candle to be green for a bullish pattern or the next candle to be red for a bearish pattern, otherwise the candle pattern is invalidated and not displayed. It is often more profitable to wait one more candle for a confirmation in order to increase the trade success probability. Once the pattern is validated, a small black dot will be displayed on the candle closure and will never be removes from the chart.
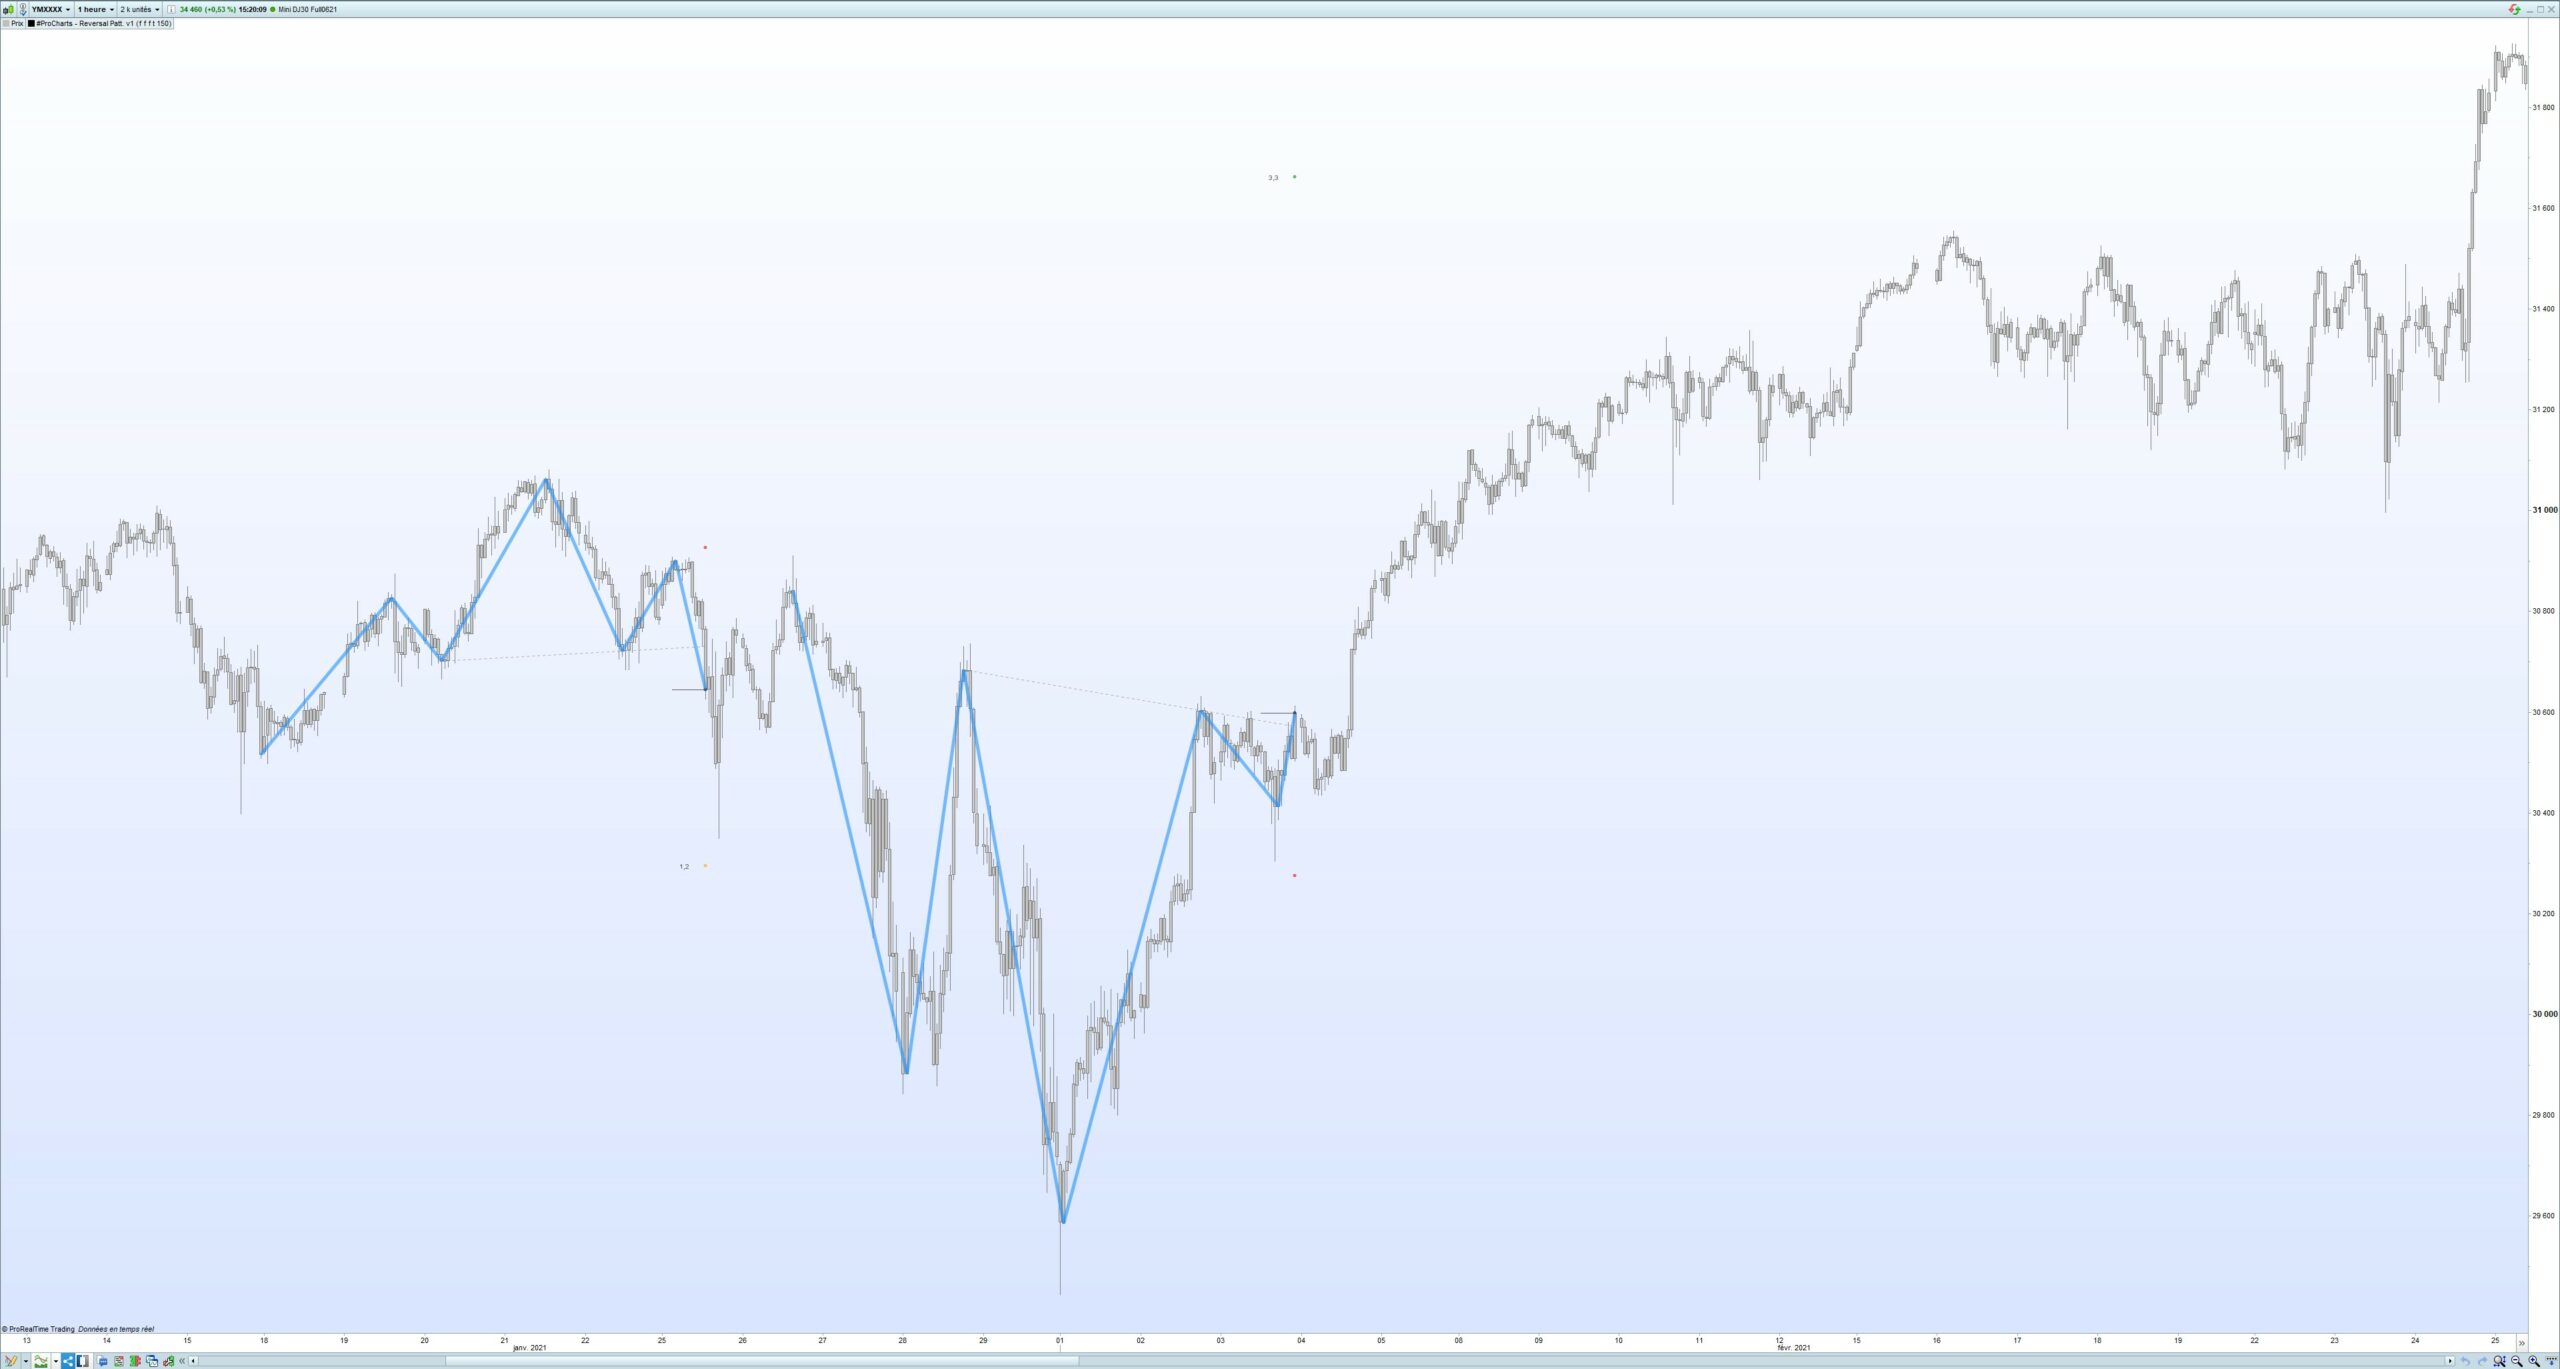
3. Wolf Waves
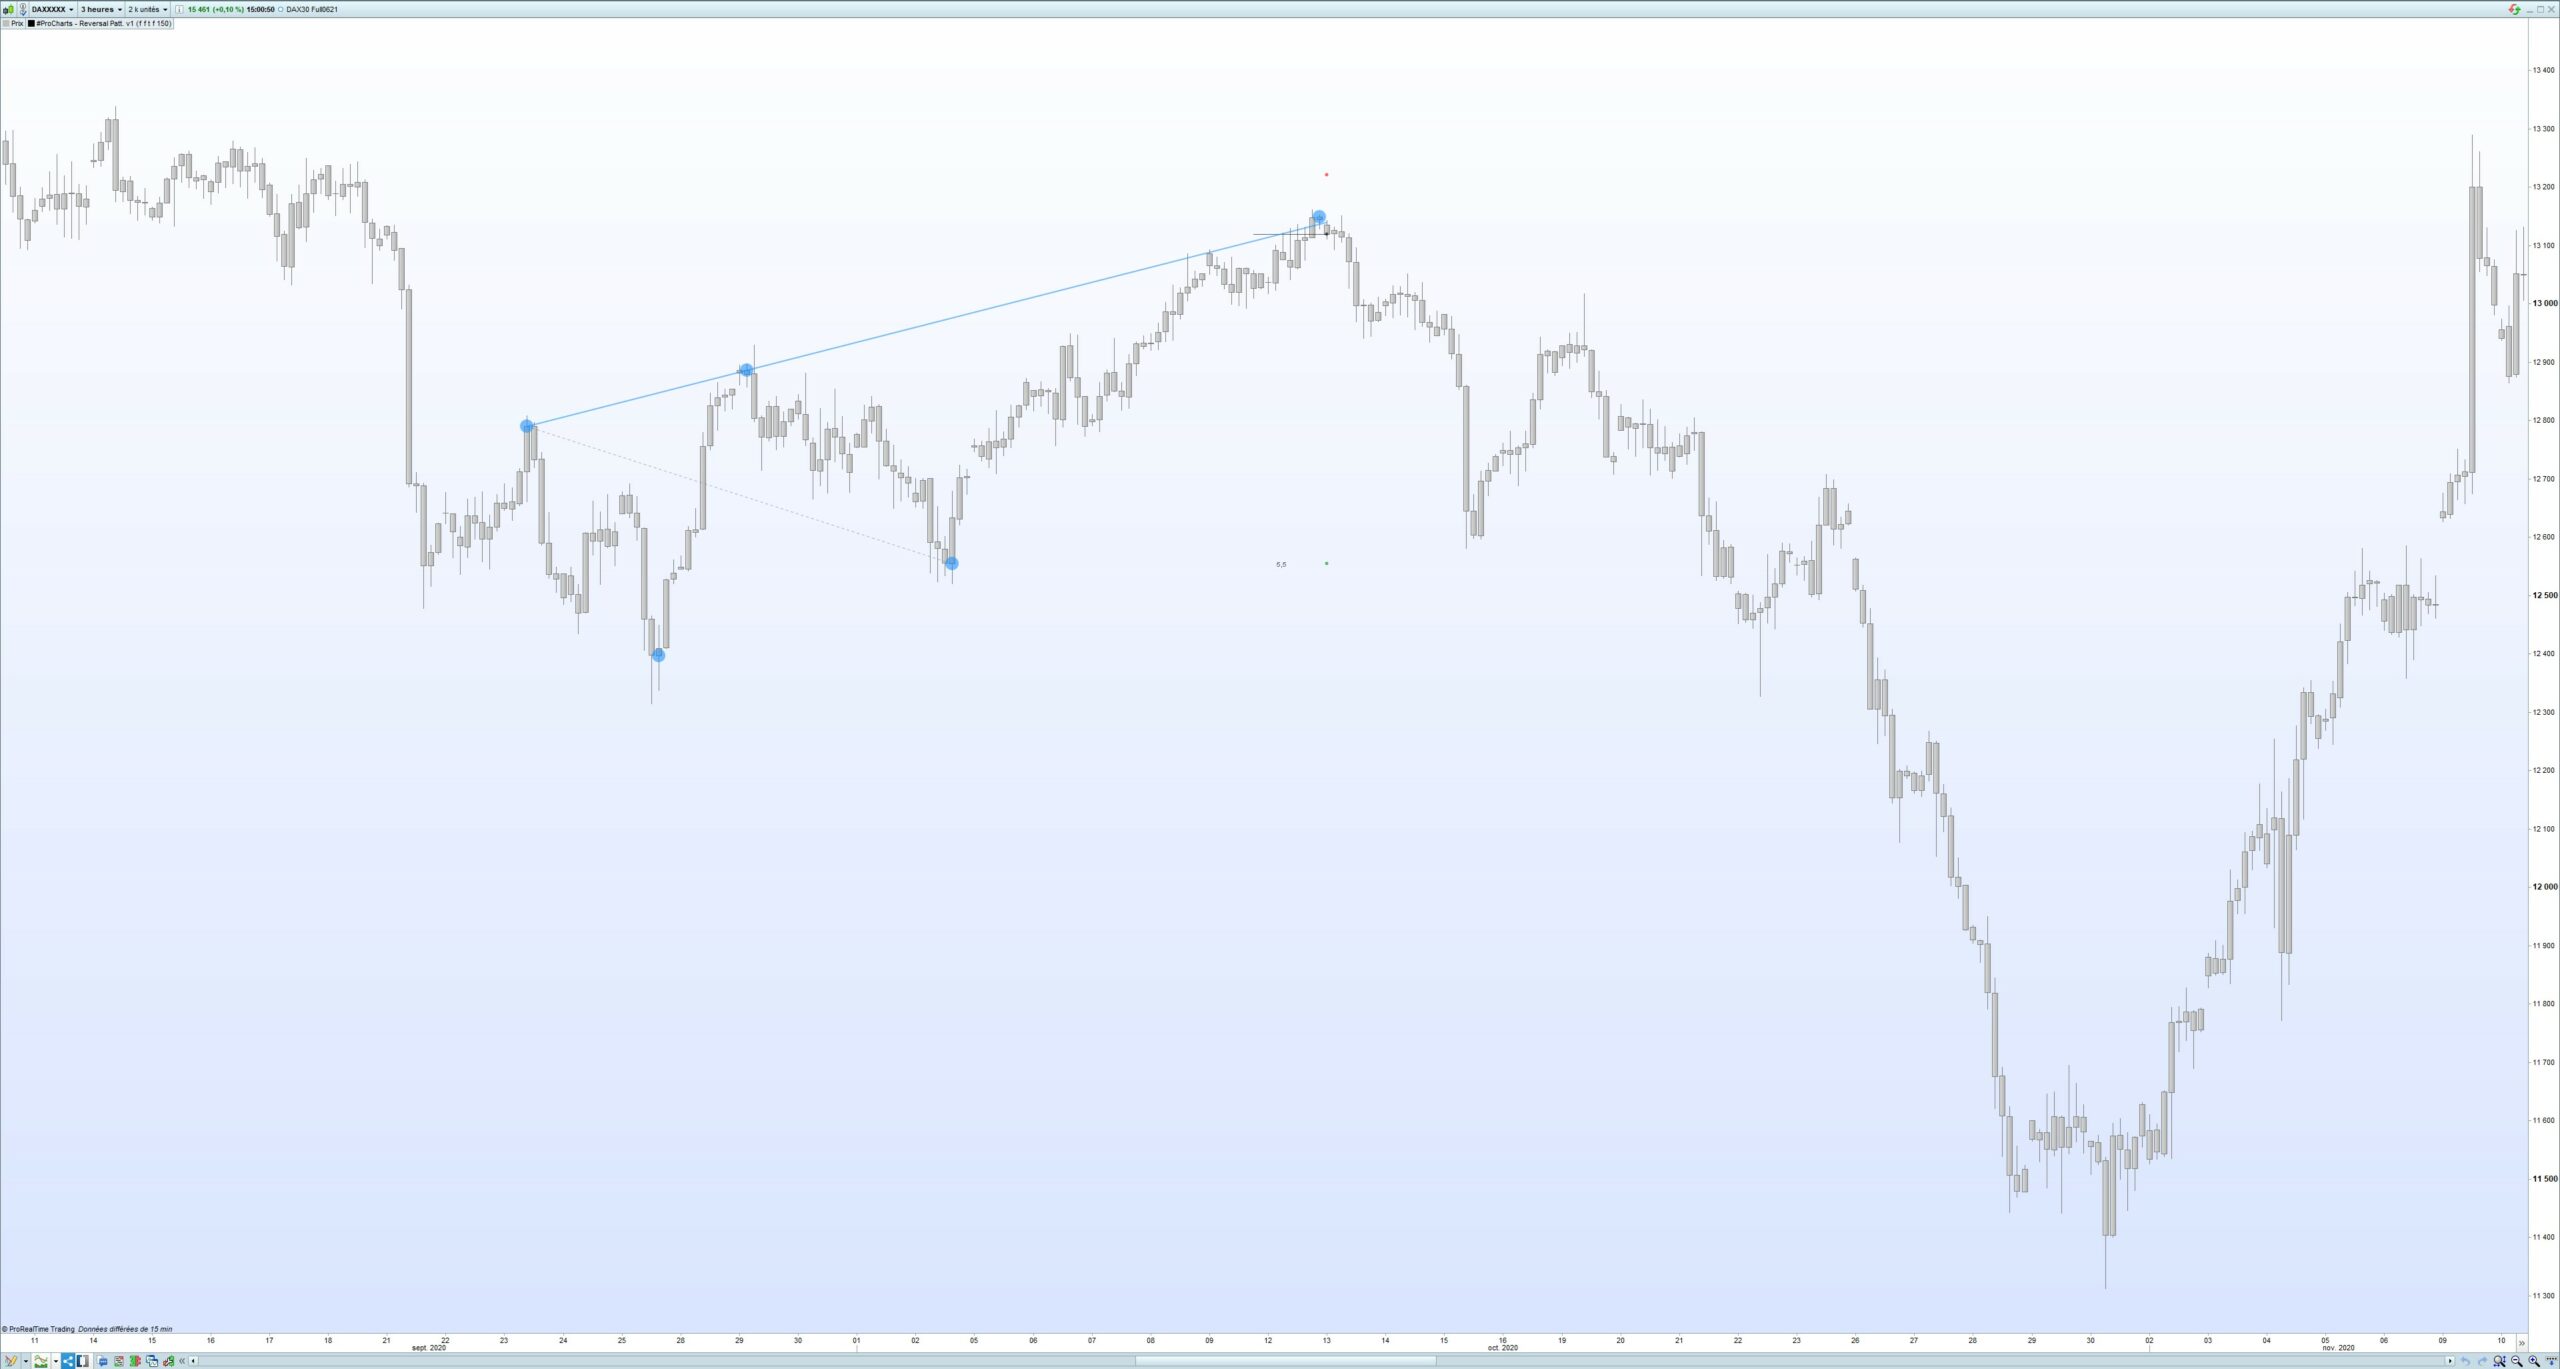
The indicator analyze all tops and bottoms and verify the compliance with a wolf wave criteria. Once a wolf wave is detected, its validation is identified with a black dot and line suggesting a price trade entrance. Once again a SL & TP & risk/reward ratio will be displayed on the chart.
4. Head and Shoulders
The process is identical with an analyze on the last tops and bottoms and check the compliance with a head and shoulders pattern. Once a head and shoulders is detected, its validation is identified with a black dot and line suggesting a price trade entrance. Once again a SL & TP & risk/reward ratio will be displayed on the chart.
Indicator Menu:
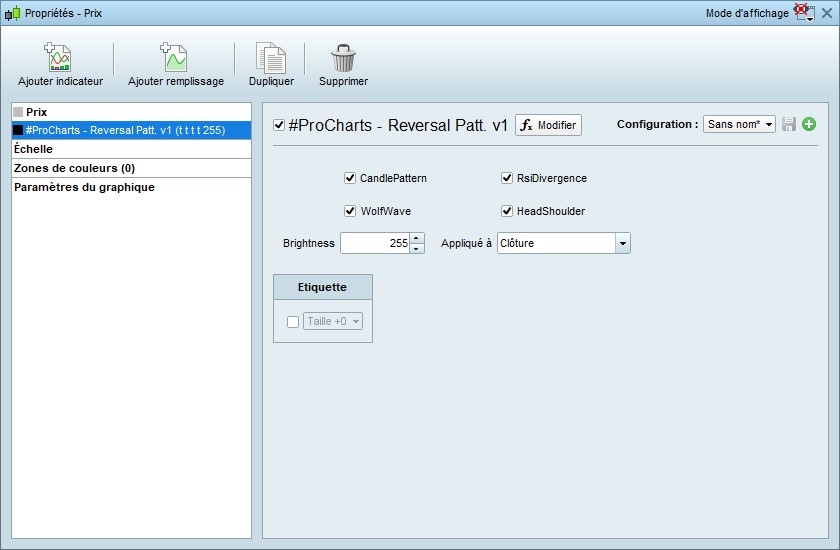
As you can see, you can select which items you want to be displayed.
You will not have any complex setting to adjust, everything is done automatically !
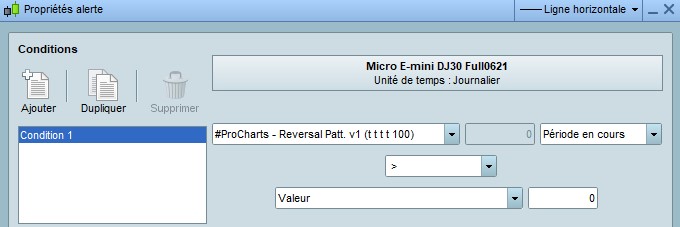
ALERTS:
You can set up an alert on the commodity and time frame you would like by opening the alert panel, choosing the “Reversal Pattern” indicator and then select “> value 0”.
Purchase Details:
– This indicator is for rent for 1€/day for Monthly subscription (subscription can be cancelled anytime, so feel free to try it and see if it suits your trading style as it does for me)
– Support can be provided in English or French

Avis
Il n’y a pas encore d’avis.